
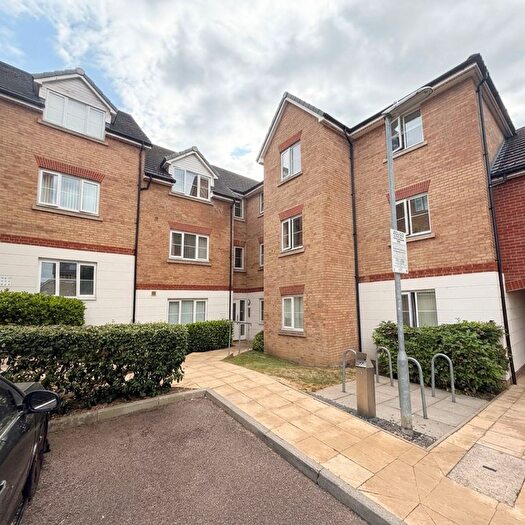
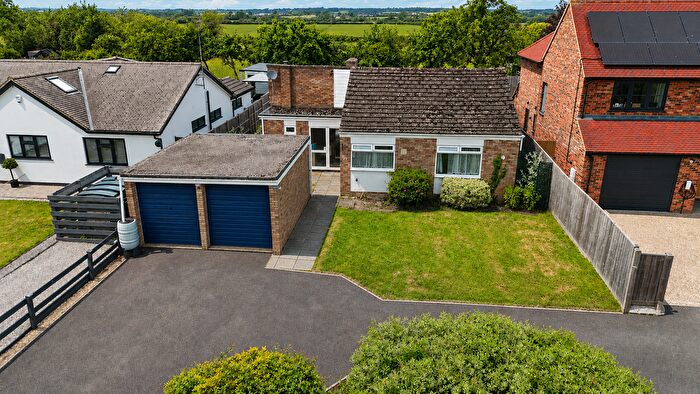
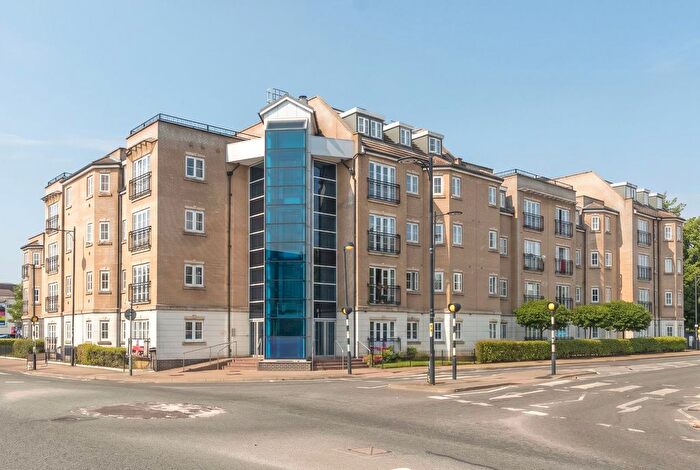
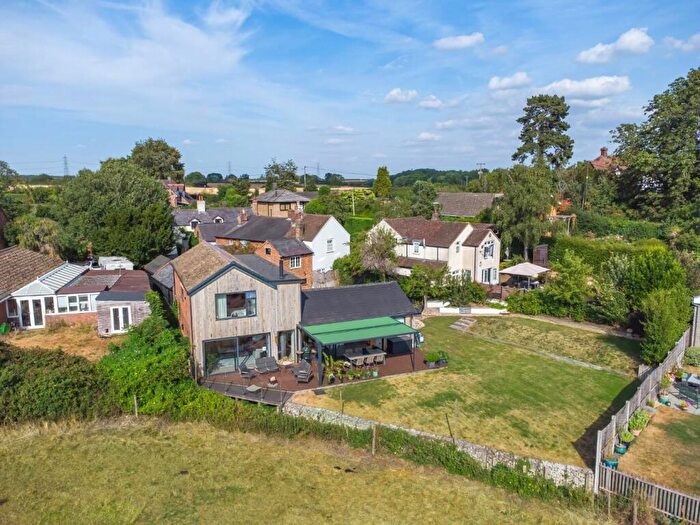
Houses for sale in Leighton Buzzard, Bedfordshire
House Prices in Leighton Buzzard
Properties in Leighton Buzzard have an average house price of £353k and had 2,334 Property Transactions within the last 3 years.¹
Leighton Buzzard is an area in Bedfordshire with 19,980 households², where the most expensive property was sold for £1.75M.
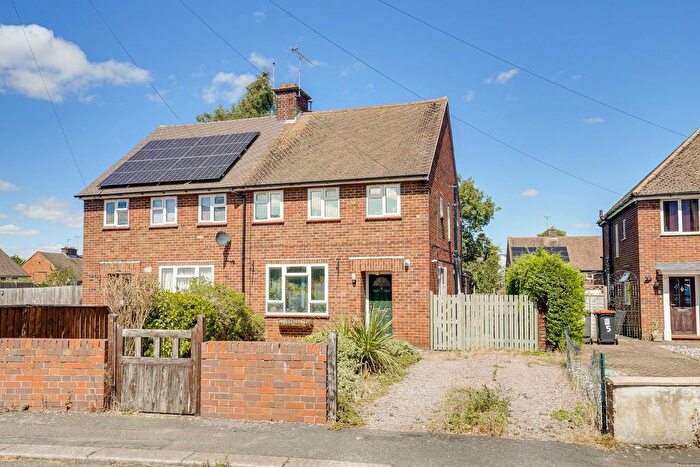
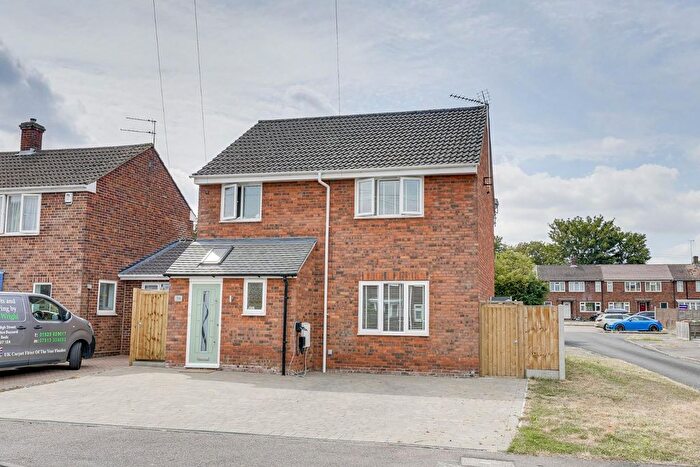
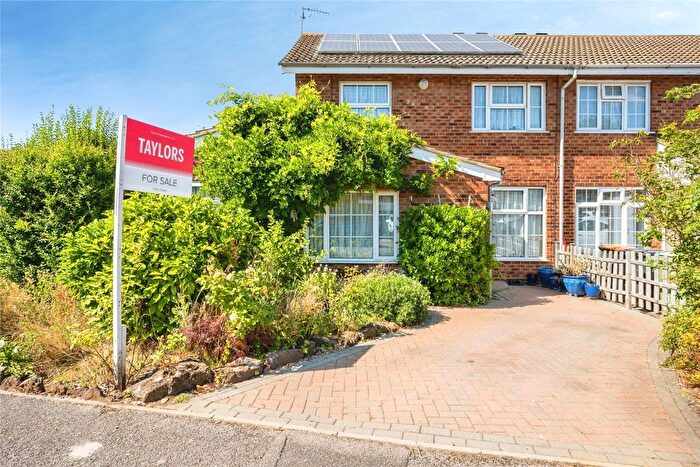
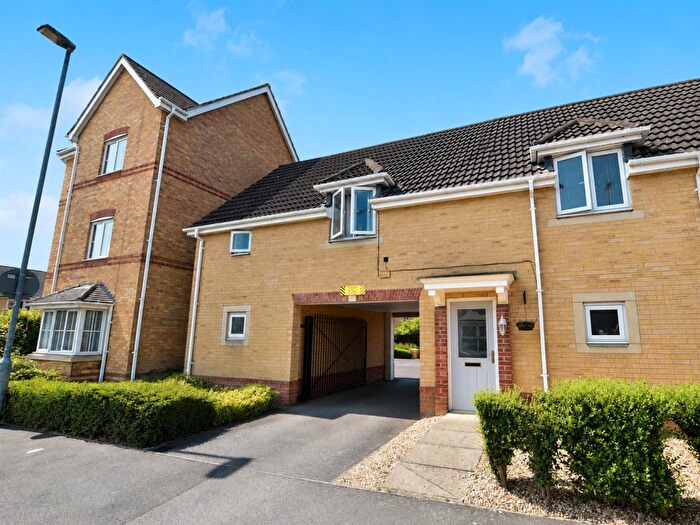
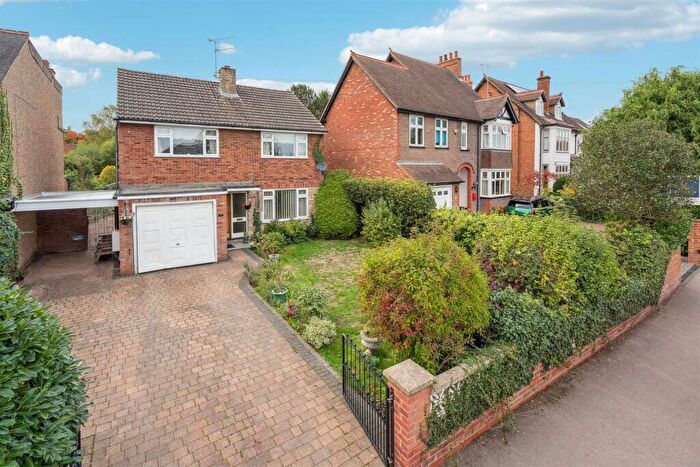
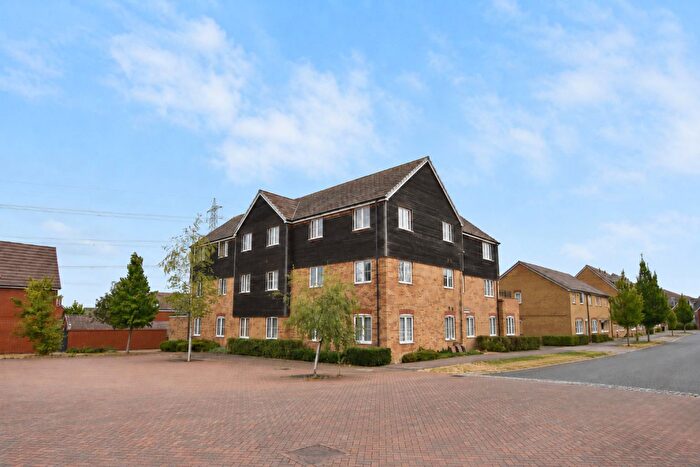
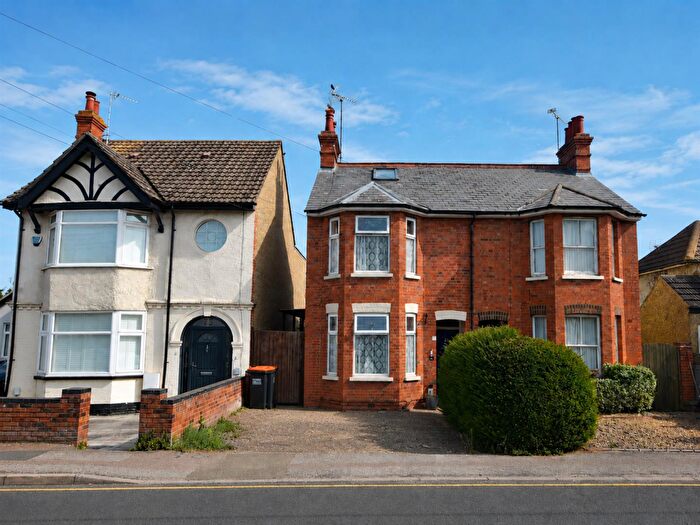
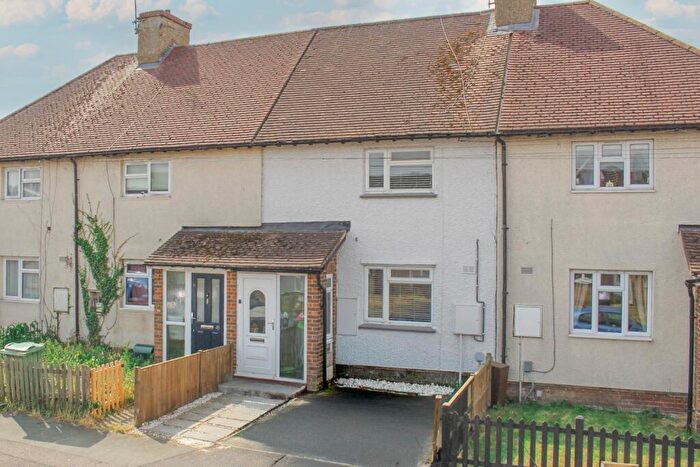
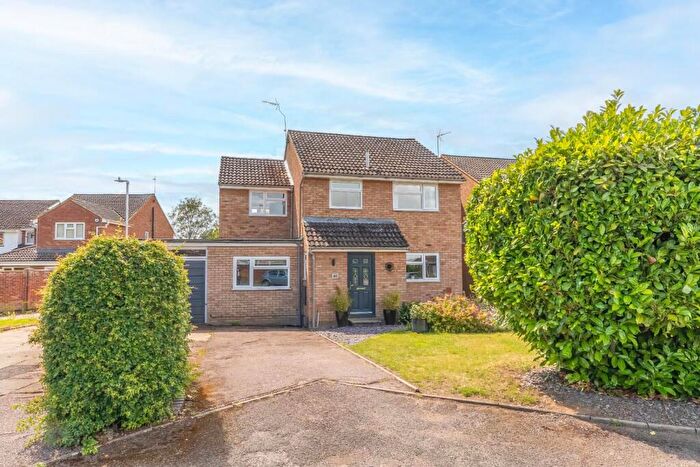
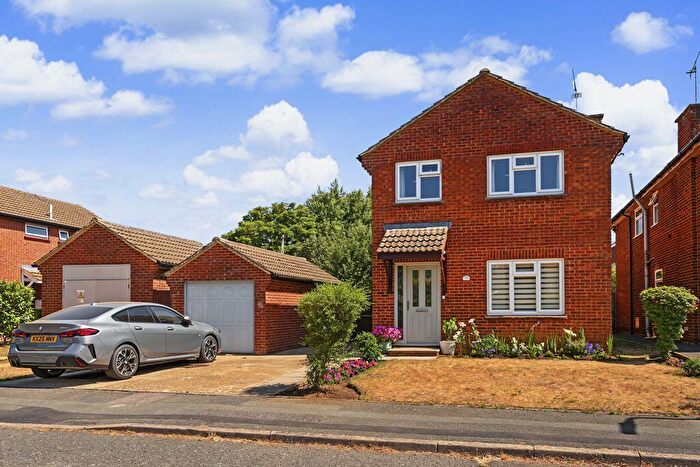
Properties for sale in Leighton Buzzard
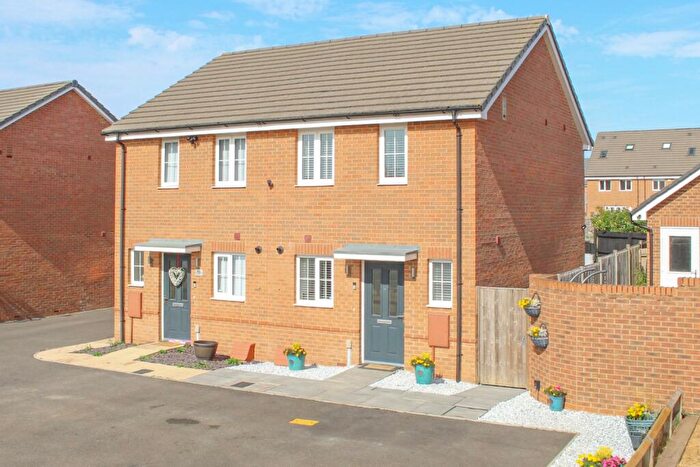
![]()
If you are looking to sell your house, let it out, or receive a property valuation, an expert can help you.
Click the button below to get started.


Neighbourhoods in Leighton Buzzard
Navigate through our locations to find the location of your next house in Leighton Buzzard, Bedfordshire for sale or to rent.
Property price trends in Leighton Buzzard
According to the latest Land Registry data, the average home in Leighton Buzzard sold for £399,900 in 2026. That figure comes from a substantial record of 30,337 sales logged over the past 31 years.
Prices have continued to climb over the last three years. Compared with 2023, when the typical sale came in around £348,857, that's a rise of roughly 14.6%.
Looking back five years, average prices are up about 19.4% since 2021, a gain of around £64,959 in cash terms.
Zoom out to the past decade for the fuller picture. Back in 2016, homes here averaged £272,726, so the typical sold price has climbed about 46.6% since then, roughly 3.9% a year. Stretch the view to fifteen years and that annual pace edges up closer to 5%.
Frequently asked questions about Leighton Buzzard
What is the average price for a property for sale in Leighton Buzzard?
The average price for a property for sale in Leighton Buzzard is £352,668. This amount is 5% lower than the average price in Bedfordshire. There are 6,922 property listings for sale in Leighton Buzzard.
What locations have the most expensive properties for sale in Leighton Buzzard?
The locations with the most expensive properties for sale in Leighton Buzzard are Aspley And Woburn at an average of £825,000, Eaton Bray at an average of £668,437 and Heath And Reach at an average of £434,045.
What locations have the most affordable properties for sale in Leighton Buzzard?
The locations with the most affordable properties for sale in Leighton Buzzard are Leighton Buzzard South at an average of £324,132, Leighton Buzzard North at an average of £347,604 and Linslade at an average of £356,467.
Which train stations are available in or near Leighton Buzzard?
Some of the train stations available in or near Leighton Buzzard are Leighton Buzzard, Cheddington and Bow Brickhill.
Property Price Paid in Leighton Buzzard by Year
The average sold property price by year was:
| Year | Average Sold Price | Price Change |
Sold Properties
|
|---|---|---|---|
| 2026 | £399,900 | 11% |
53 Properties |
| 2025 | £355,667 | 2% |
834 Properties |
| 2024 | £349,530 | 0,2% |
757 Properties |
| 2023 | £348,857 | -2% |
690 Properties |
| 2022 | £354,202 | 5% |
990 Properties |
| 2021 | £334,941 | 0,1% |
1,198 Properties |
| 2020 | £334,567 | 5% |
967 Properties |
| 2019 | £317,773 | 5% |
982 Properties |
| 2018 | £300,340 | 2% |
836 Properties |
| 2017 | £295,780 | 8% |
994 Properties |
Property Price per Property Type in Leighton Buzzard
Here you can find historic sold price data in order to help with your property search.
The average Property Paid Price for specific property types in the last three years are:
| Property Type | Average Sold Price | Sold Properties |
|---|---|---|
| Semi Detached House | £367,584.00 | 670 Semi Detached Houses |
| Detached House | £558,623.00 | 465 Detached Houses |
| Terraced House | £311,509.00 | 754 Terraced Houses |
| Flat | £184,737.00 | 445 Flats |
Transport in Leighton Buzzard
Please see below transportation links in this area:
