
Houses for sale in Bedfordshire, England
House Prices in Bedfordshire
Properties in Bedfordshire have
an average house price of
£372k
and had 20,188 Property Transactions
within the last 3 years.¹
Bedfordshire is a location in
England with
196,071 households², where the most expensive property was sold for £3.6M.
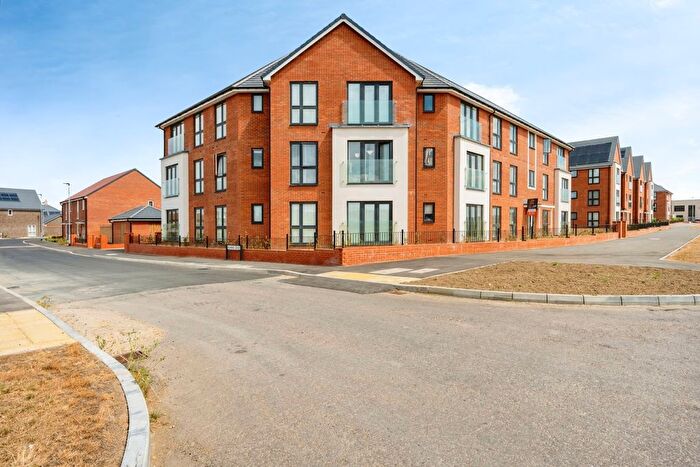
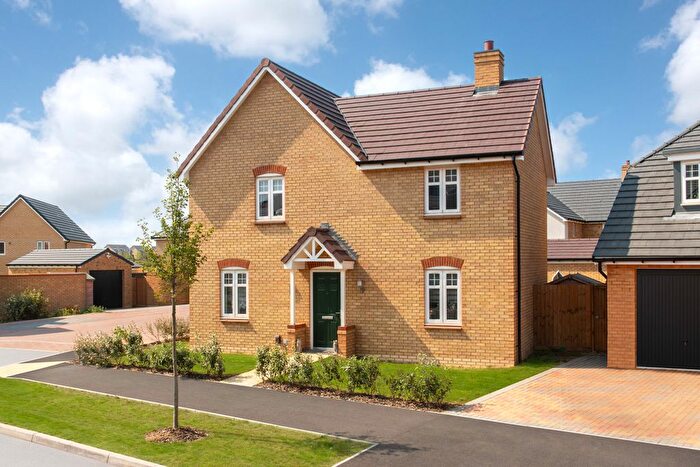
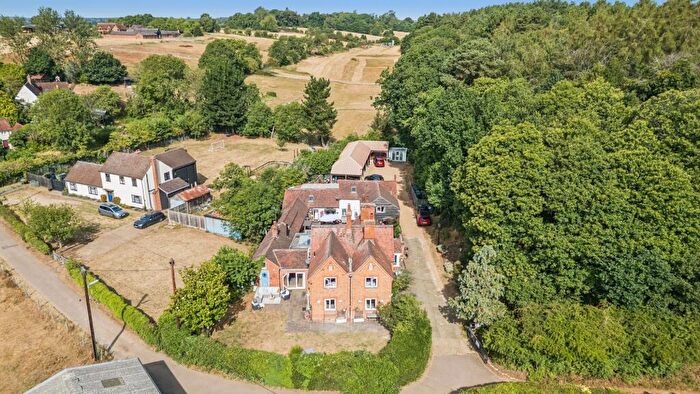
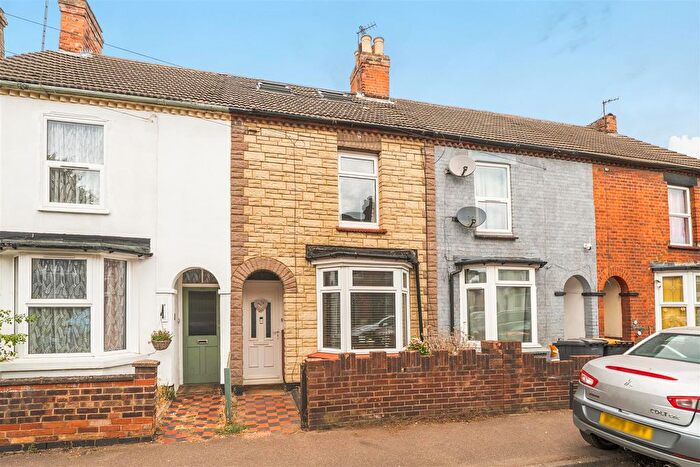
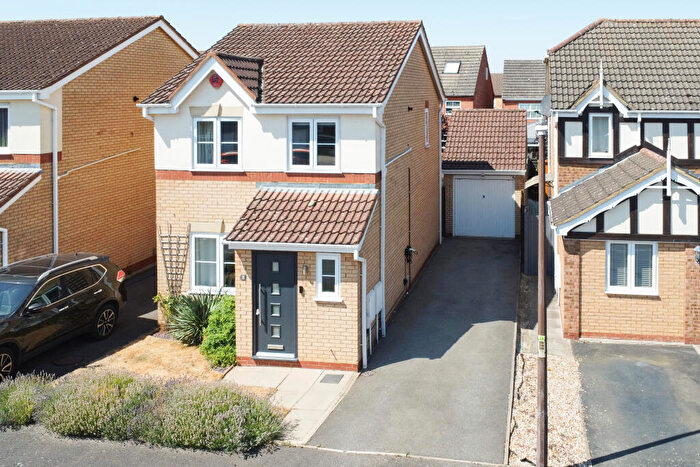
Properties for sale in Bedfordshire
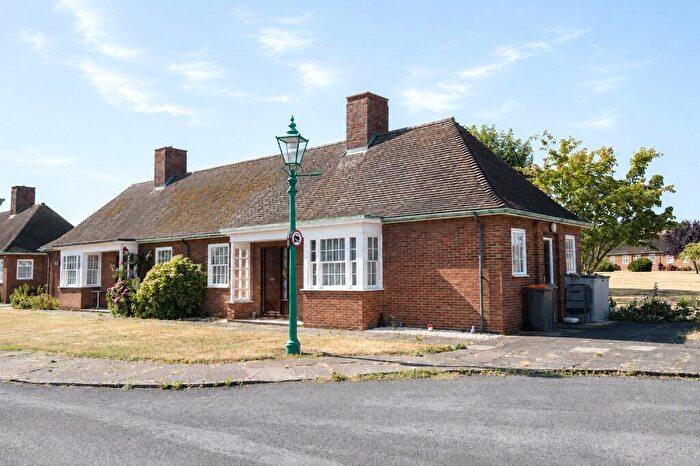
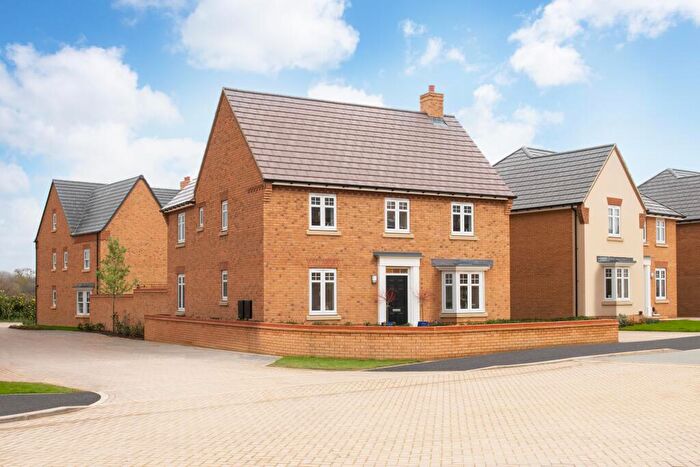
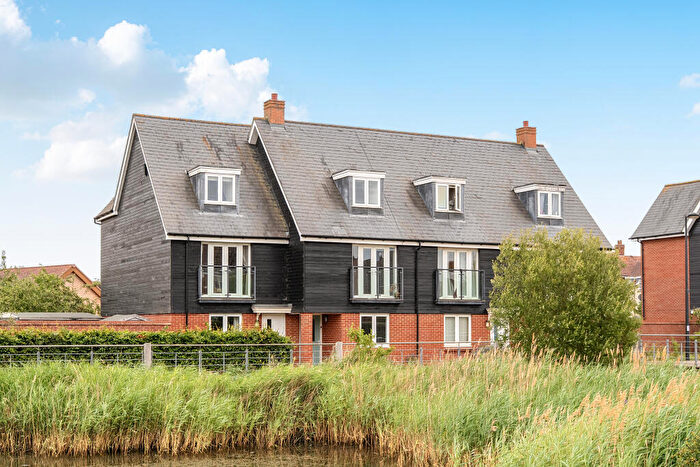
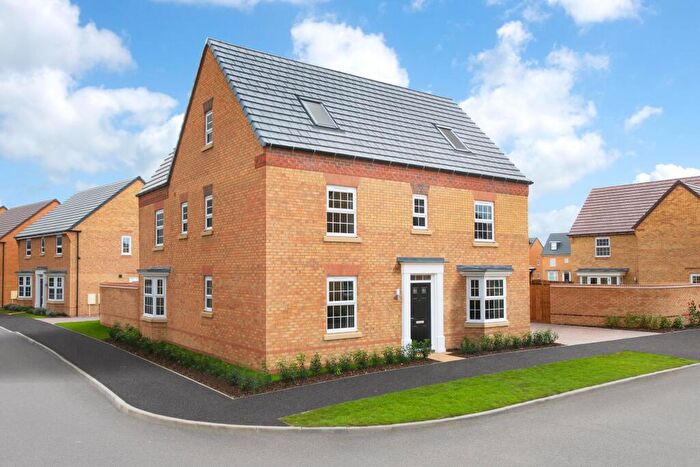

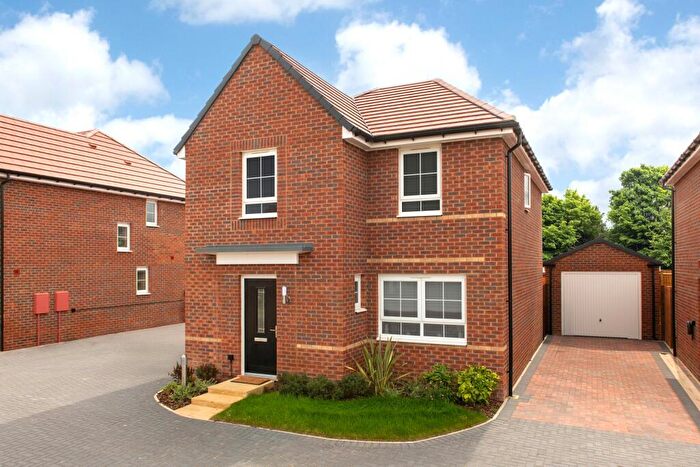
![]()
If you are looking to sell your house, let it out, or receive a property valuation, an expert can help you.
Click the button below to get started.


Towns in Bedfordshire
Navigate through our locations to find the location of your next house in Bedfordshire, England for sale or to rent.
Property price trends in Bedfordshire
According to the latest Land Registry data, the average home in Bedfordshire sold for £374,329 in 2026. That figure comes from a substantial record of 262,147 sales logged over the past 31 years.
Prices have moved up over the last three years. Compared with 2023, when the typical sale came in around £363,747, that's a rise of roughly 2.9%.
Looking back five years, average prices are up about 5.7% since 2021, a gain of around £20,221 in cash terms.
Zoom out to the past decade for the fuller picture. Back in 2016, homes here averaged £284,580, so the typical sold price has climbed about 31.5% since then, roughly 2.8% a year. Stretch the view to fifteen years and that annual pace edges up closer to 3.7%.
Frequently asked questions about Bedfordshire
What is the average price for a property for sale in Bedfordshire?
The average price for a property for sale in Bedfordshire is £371,870. This amount is 4% higher than the average price in England. There are more than 10,000 property listings for sale in Bedfordshire.
What locations have the most expensive properties for sale in Bedfordshire?
The locations with the most expensive properties for sale in Bedfordshire are Milton Keynes at an average of £636,201, Huntingdon at an average of £538,687 and Luton at an average of £440,118.
What locations have the most affordable properties for sale in Bedfordshire?
The locations with the most affordable properties for sale in Bedfordshire are Wellingborough at an average of £279,600, Rushden at an average of £301,691 and Sandy at an average of £340,036.
Which train stations are available in or near Bedfordshire?
Some of the train stations available in or near Bedfordshire are Stewartby, Millbrook (Bedfordshire) and Kempston Hardwick.
Property Price Paid in Bedfordshire by Year
The average sold property price by year was:
| Year | Average Sold Price | Price Change |
Sold Properties
|
|---|---|---|---|
| 2026 | £374,329 | -1% |
1,205 Properties |
| 2025 | £377,966 | 2% |
6,870 Properties |
| 2024 | £371,971 | 2% |
6,512 Properties |
| 2023 | £363,747 | -2% |
5,601 Properties |
| 2022 | £371,625 | 5% |
7,602 Properties |
| 2021 | £354,108 | 5% |
10,492 Properties |
| 2020 | £337,321 | 4% |
7,829 Properties |
| 2019 | £324,848 | 0,4% |
8,764 Properties |
| 2018 | £323,697 | 3% |
8,710 Properties |
| 2017 | £314,256 | 9% |
9,072 Properties |
Property Price per Property Type in Bedfordshire
Here you can find historic sold price data in order to help with your property search.
The average Property Paid Price for specific property types in the last three years are:
| Property Type | Average Sold Price | Sold Properties |
|---|---|---|
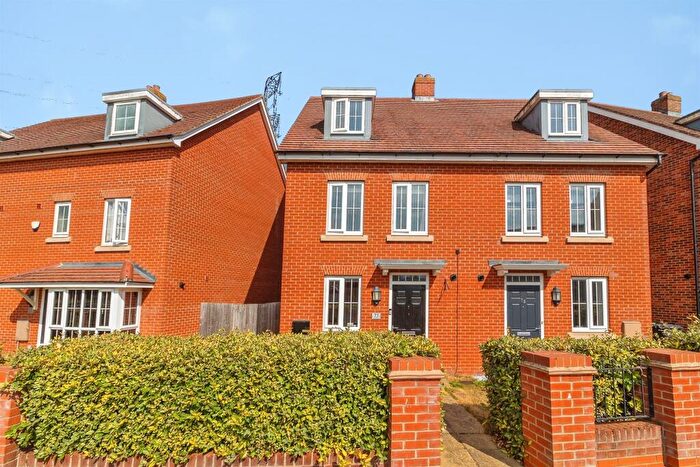
| Semi Detached House | £362,576.00 | 6,490 Semi Detached Houses |
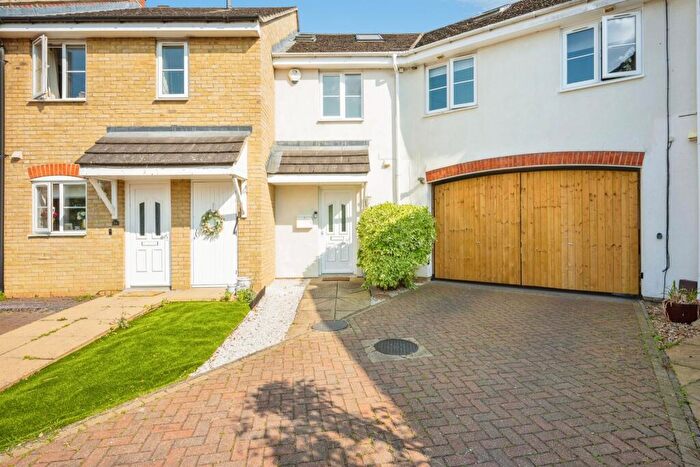
| Terraced House | £299,790.00 | 5,740 Terraced Houses |
| Detached House | £556,444.00 | 5,278 Detached Houses |
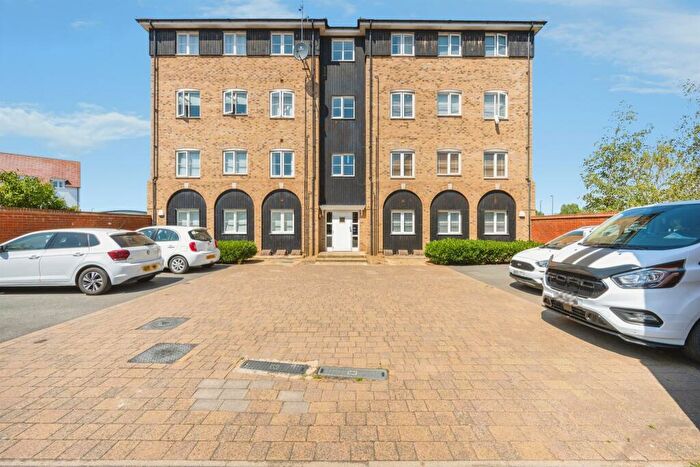
| Flat | £185,258.00 | 2,680 Flats |
Transport in Bedfordshire
Please see below transportation links in this area:
