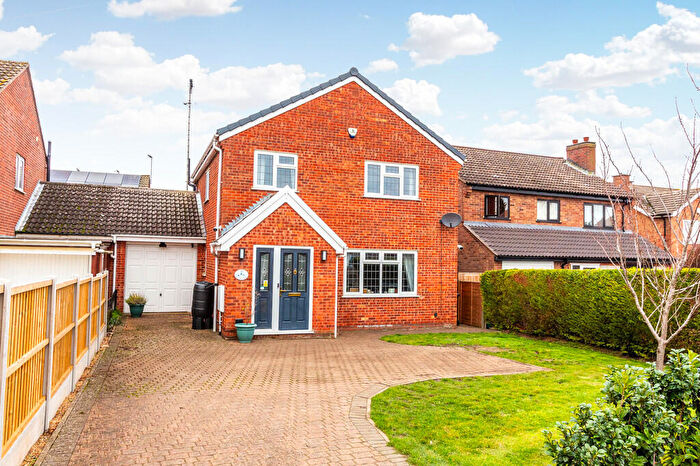
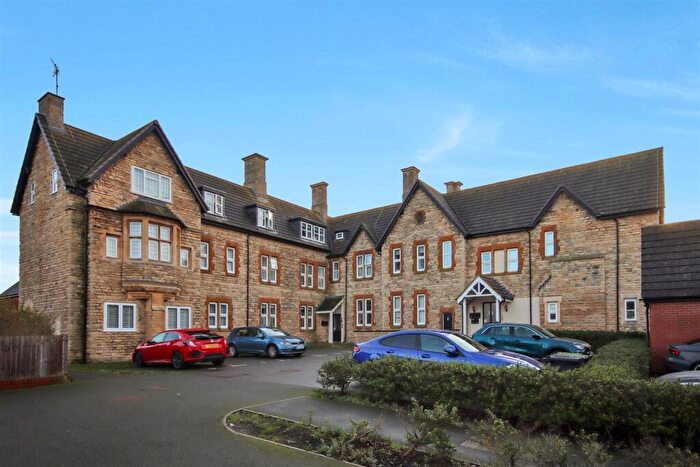
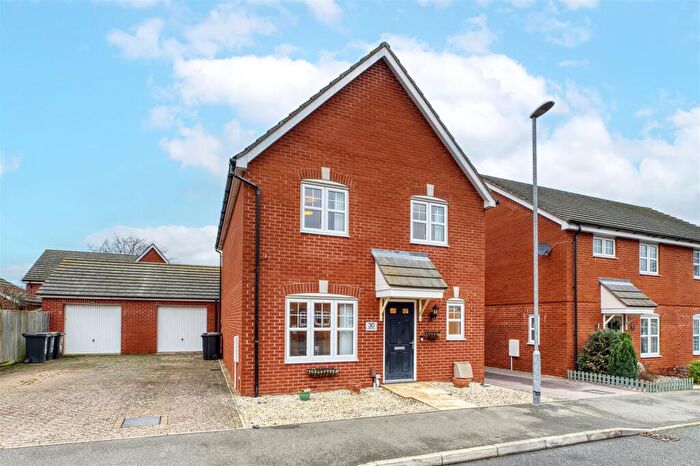
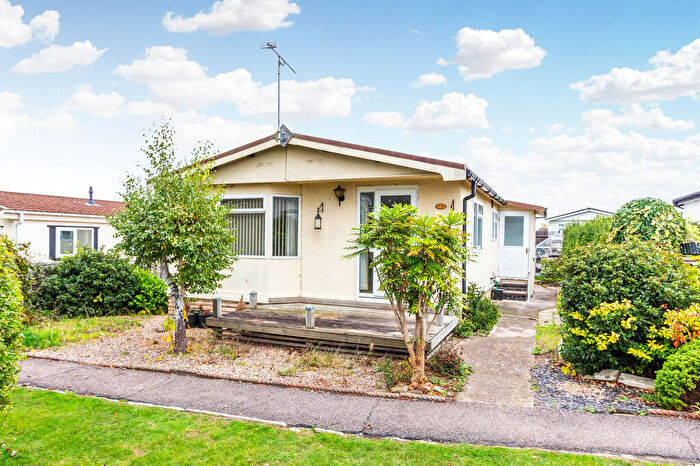
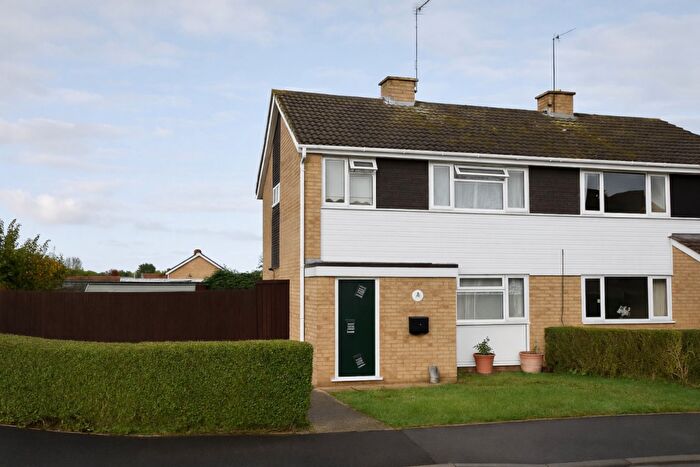
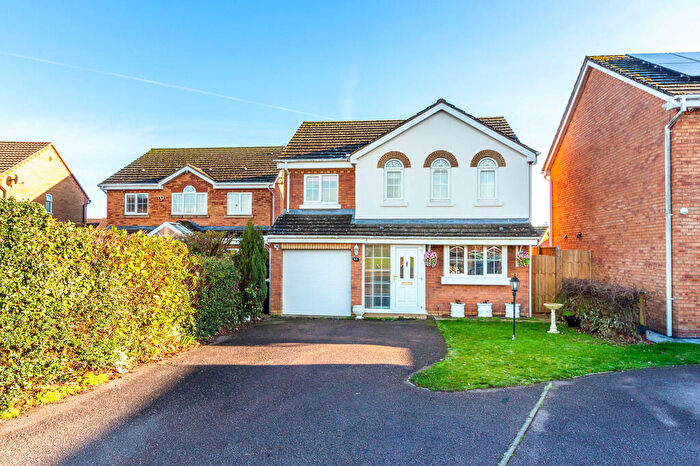
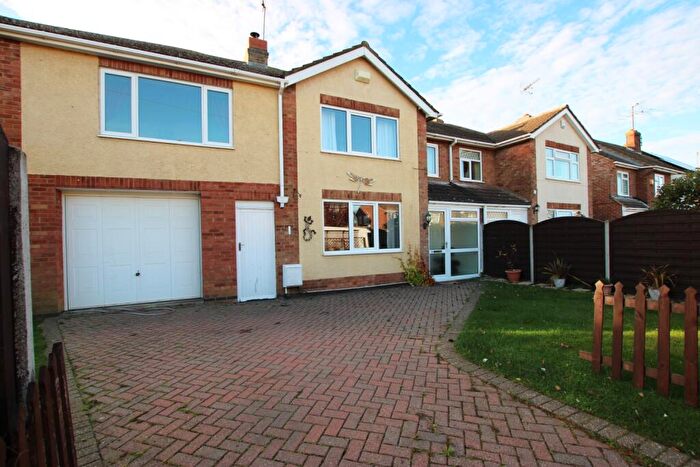
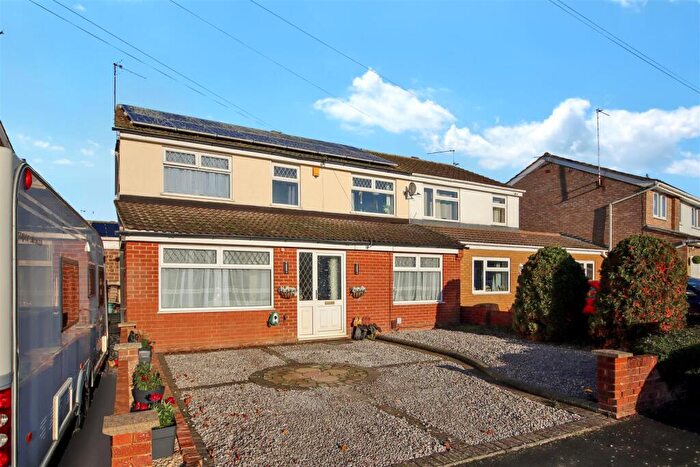
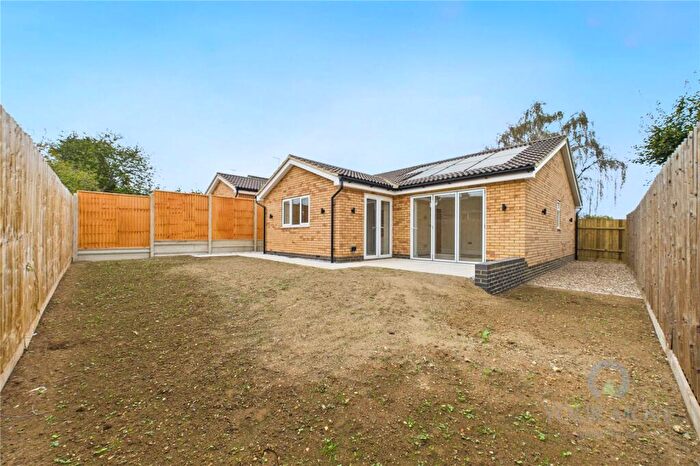
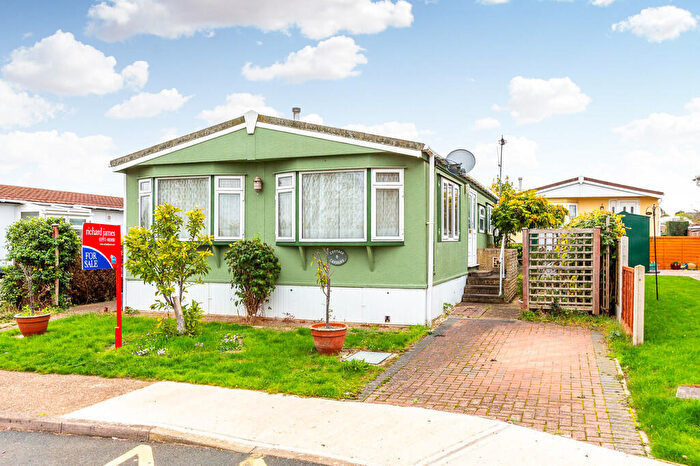
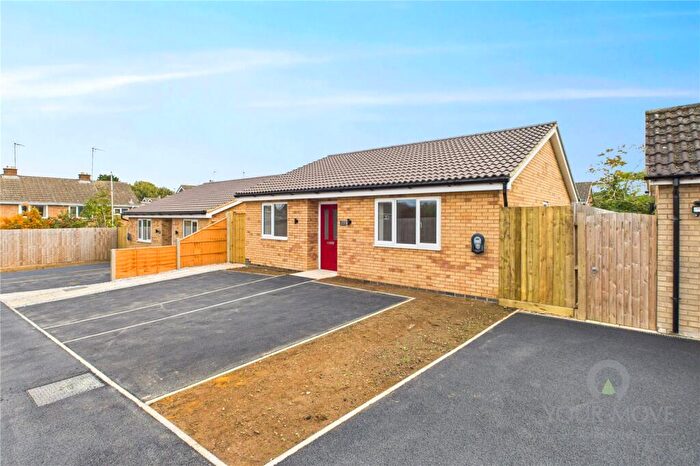
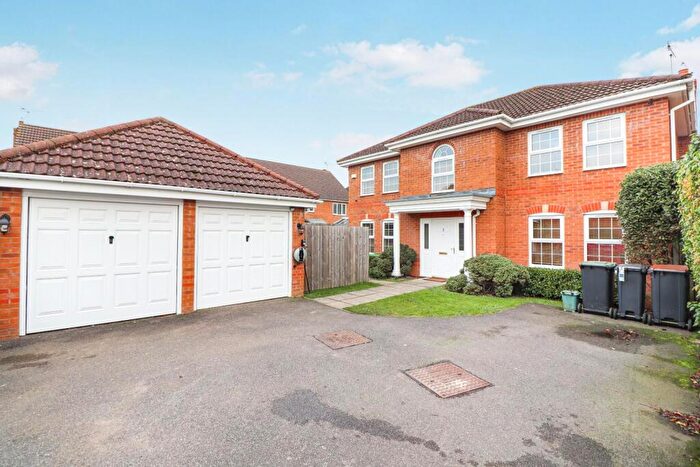
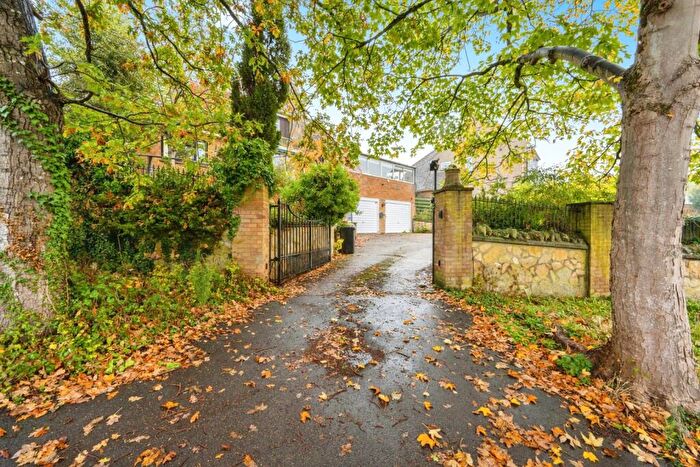
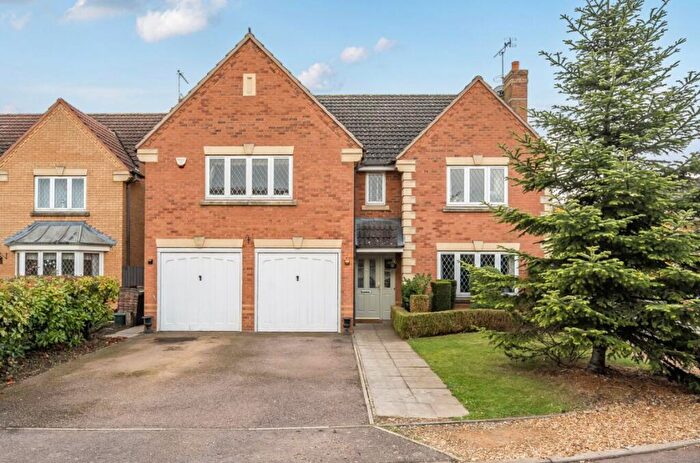
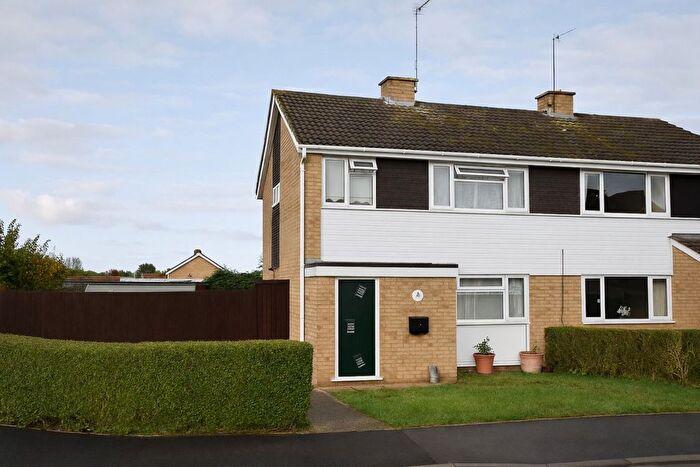
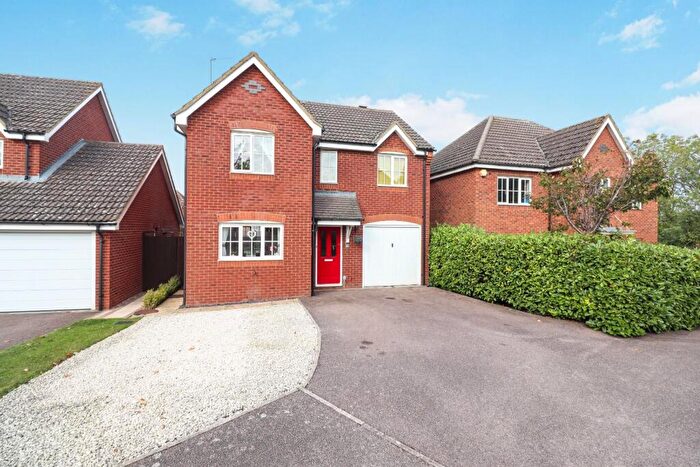
Houses for sale & to rent in Harrold, Rushden
House Prices in Harrold
Properties in Harrold have an average house price of £306,181.00 and had 33 Property Transactions within the last 3 years¹.
Harrold is an area in Rushden, Bedfordshire with 339 households², where the most expensive property was sold for £1,121,000.00.
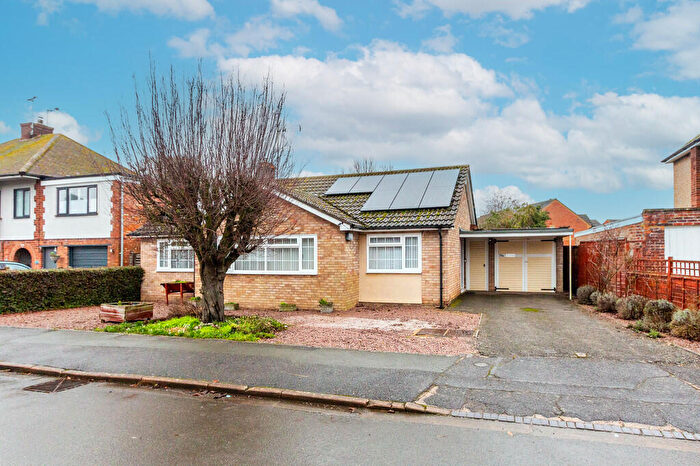
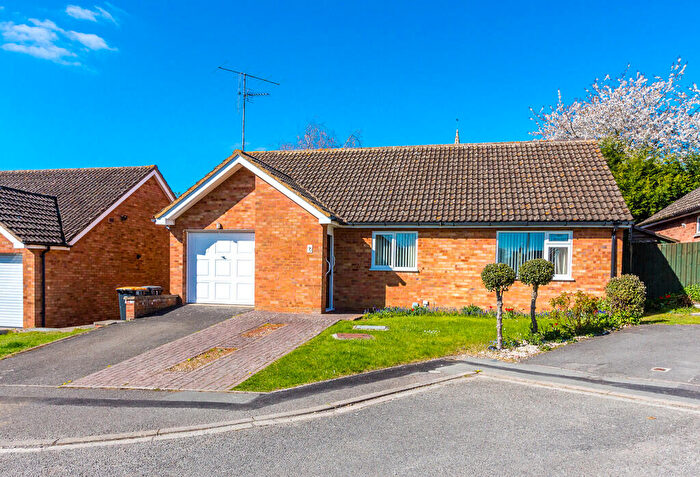
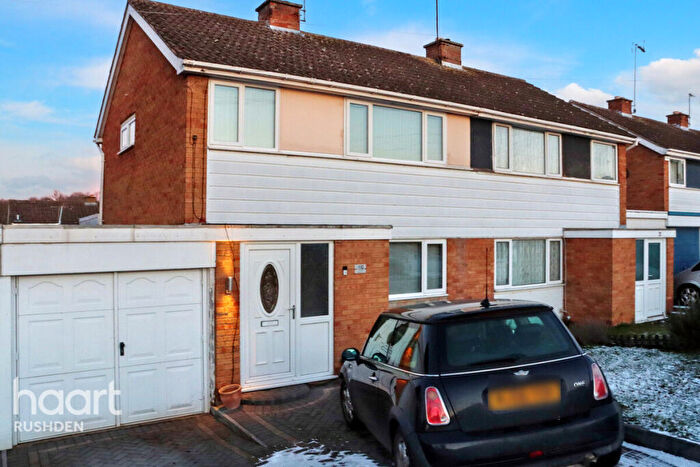
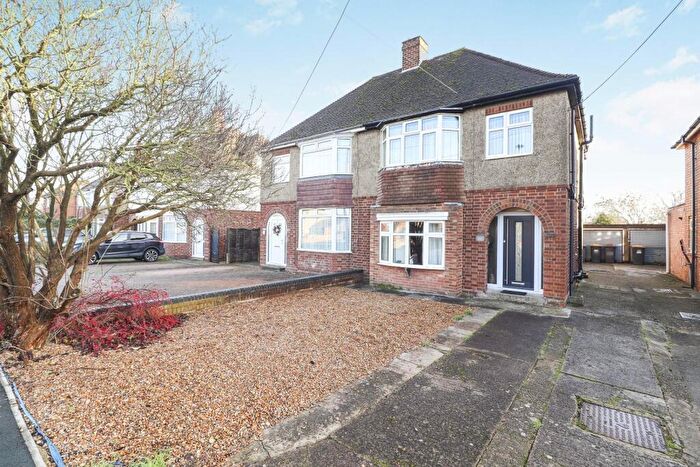
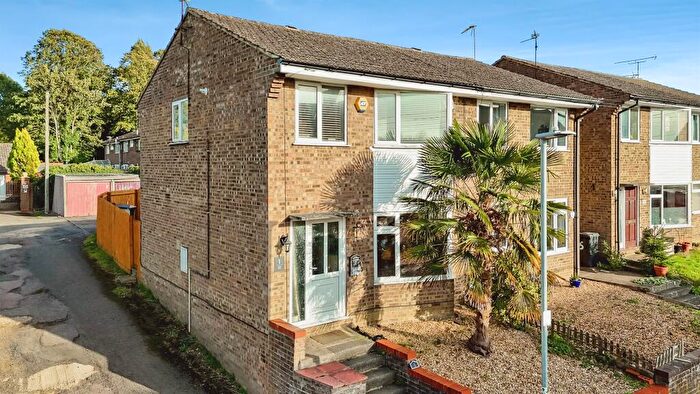
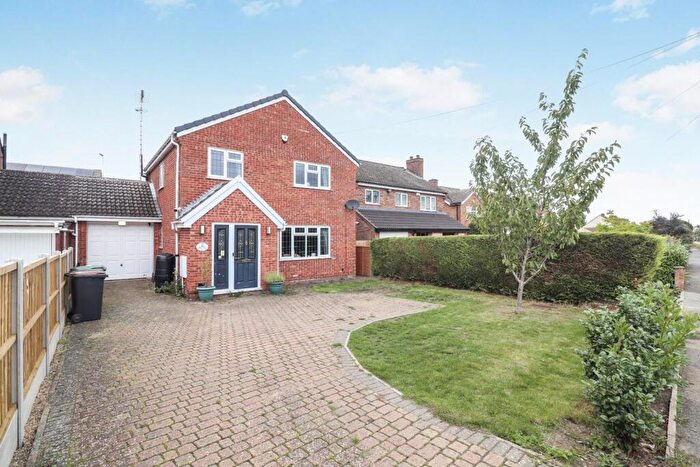
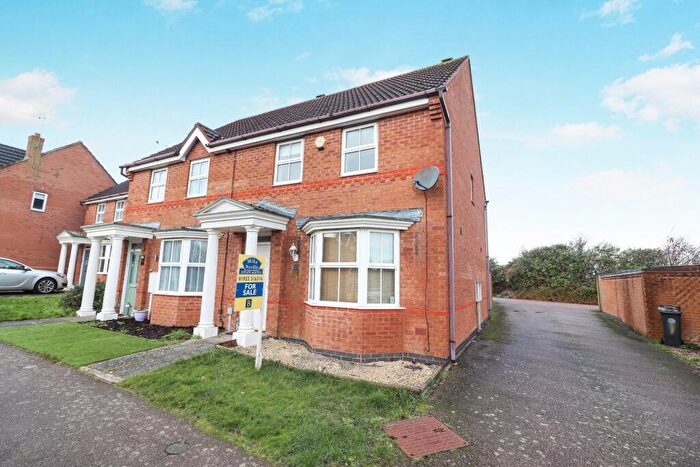
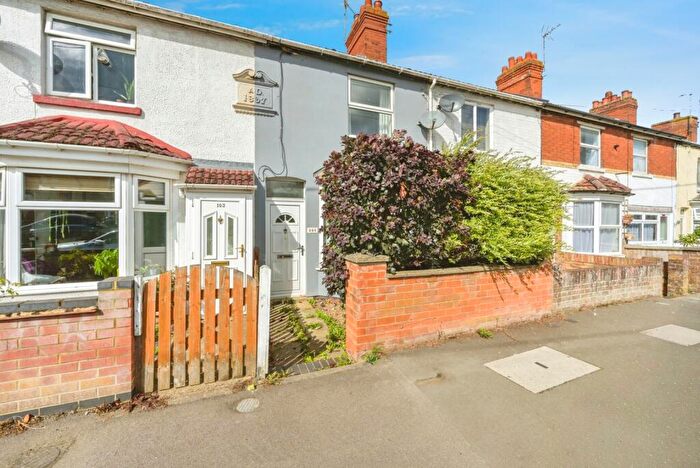
Properties for sale in Harrold
Previously listed properties in Harrold
Roads and Postcodes in Harrold
Navigate through our locations to find the location of your next house in Harrold, Rushden for sale or to rent.
| Streets | Postcodes |
|---|---|
| Brook Farm Close | NN10 9NQ |
| Cambridge Street | NN10 9LG |
| Chestnut Close | NN10 9LX |
| Church Close | NN10 9FG |
| Church Lane | NN10 9LW |
| Green Lane | NN10 9NA |
| High Street | NN10 9LS |
| Lancaster Gardens | NN10 9FR |
| Manor Lane | NN10 9LL |
| Oxford Street | NN10 9LJ |
| Podington Road | NN10 9FT |
| Rushden Road | NN10 9LE NN10 9LF NN10 9LH NN10 9LN NN10 9LQ |
| South Grove | NN10 9LR |
| St Lawrence Walk | NN10 9LP |
| The Brambles | NN10 9PT |
| Wymington Lane | NN10 9LT NN10 9LU |
Transport near Harrold
-
Wellingborough Station
-
Kettering Station
-
Bedford Midland Station
-
Bedford St.Johns Station
-
Kempston Hardwick Station
-
Northampton Station
-
Stewartby Station
- FAQ
- Price Paid By Year
- Property Type Price
Frequently asked questions about Harrold
What is the average price for a property for sale in Harrold?
The average price for a property for sale in Harrold is £306,181. There are 228 property listings for sale in Harrold.
What streets have the most expensive properties for sale in Harrold?
The streets with the most expensive properties for sale in Harrold are Manor Lane at an average of £1,121,000, Rushden Road at an average of £315,690 and Brook Farm Close at an average of £300,000.
What streets have the most affordable properties for sale in Harrold?
The streets with the most affordable properties for sale in Harrold are St Lawrence Walk at an average of £165,000, Chestnut Close at an average of £225,000 and Church Lane at an average of £230,000.
Which train stations are available in or near Harrold?
Some of the train stations available in or near Harrold are Wellingborough, Kettering and Bedford Midland.
Property Price Paid in Harrold by Year
The average sold property price by year was:
| Year | Average Sold Price | Price Change |
Sold Properties
|
|---|---|---|---|
| 2025 | £275,500 | -27% |
8 Properties |
| 2024 | £348,566 | 23% |
15 Properties |
| 2023 | £267,150 | -8% |
10 Properties |
| 2022 | £289,200 | 11% |
15 Properties |
| 2021 | £256,562 | -24% |
16 Properties |
| 2020 | £318,681 | 26% |
11 Properties |
| 2019 | £234,500 | 1% |
6 Properties |
| 2018 | £232,593 | 2% |
16 Properties |
| 2017 | £227,362 | 5% |
15 Properties |
| 2016 | £215,080 | 5% |
13 Properties |
| 2015 | £204,888 | 1% |
18 Properties |
| 2014 | £202,412 | 29% |
12 Properties |
| 2013 | £143,264 | 14% |
5 Properties |
| 2012 | £122,716 | -25% |
6 Properties |
| 2011 | £153,125 | -39% |
8 Properties |
| 2010 | £213,138 | 30% |
18 Properties |
| 2009 | £150,000 | -13% |
7 Properties |
| 2008 | £169,740 | -9% |
11 Properties |
| 2007 | £185,666 | 16% |
18 Properties |
| 2006 | £156,157 | 0,1% |
18 Properties |
| 2005 | £156,045 | -20% |
11 Properties |
| 2004 | £187,093 | 29% |
16 Properties |
| 2003 | £132,621 | 30% |
16 Properties |
| 2002 | £93,473 | -37% |
21 Properties |
| 2001 | £127,724 | 30% |
26 Properties |
| 2000 | £89,559 | 26% |
22 Properties |
| 1999 | £66,677 | 16% |
11 Properties |
| 1998 | £56,050 | -16% |
20 Properties |
| 1997 | £65,089 | 23% |
15 Properties |
| 1996 | £50,375 | 18% |
8 Properties |
| 1995 | £41,157 | - |
10 Properties |
Property Price per Property Type in Harrold
Here you can find historic sold price data in order to help with your property search.
The average Property Paid Price for specific property types in the last three years are:
| Property Type | Average Sold Price | Sold Properties |
|---|---|---|
| Semi Detached House | £306,058.00 | 17 Semi Detached Houses |
| Terraced House | £186,818.00 | 11 Terraced Houses |
| Detached House | £569,200.00 | 5 Detached Houses |

