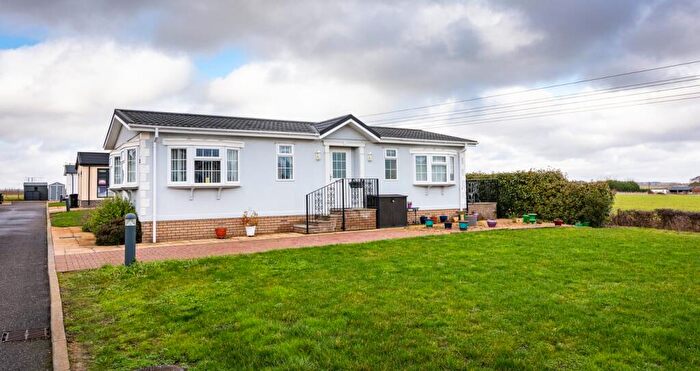
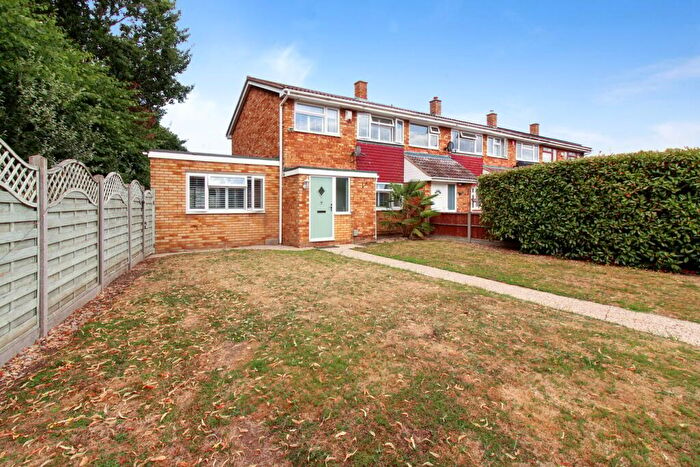
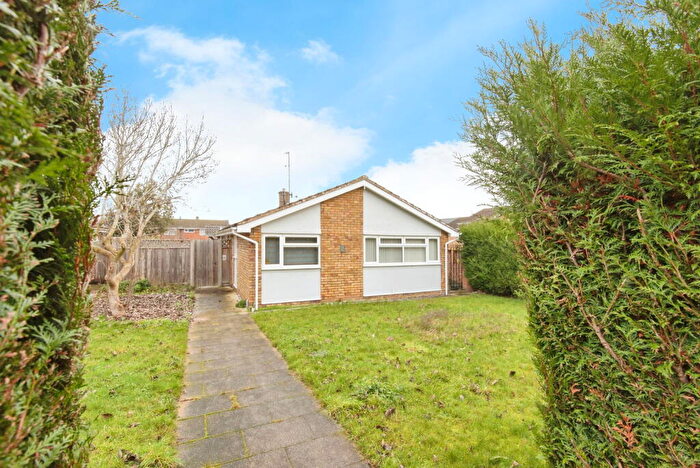
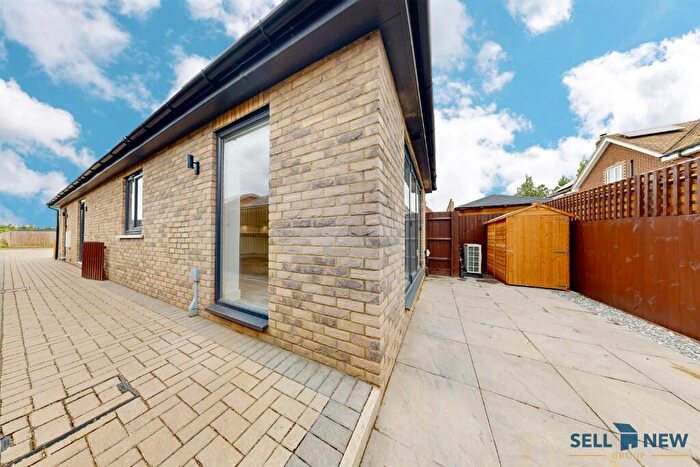
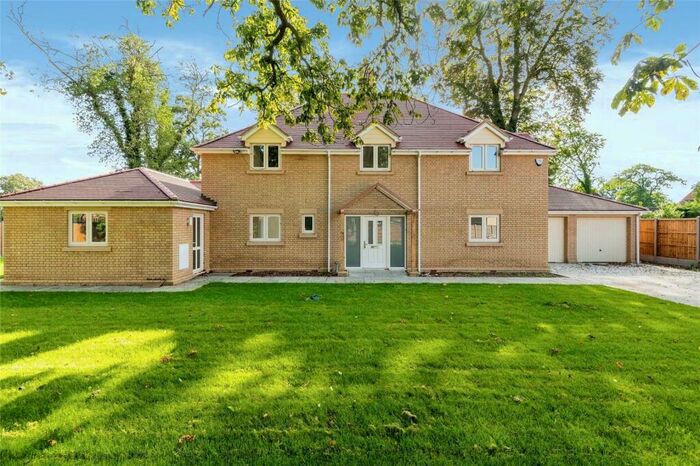
Houses for sale & to rent in Arlesey, Shefford
House Prices in Arlesey
Properties in Arlesey have an average house price of £438,484.00 and had 117 Property Transactions within the last 3 years¹.
Arlesey is an area in Shefford, Bedfordshire with 1,153 households², where the most expensive property was sold for £1,012,500.00.
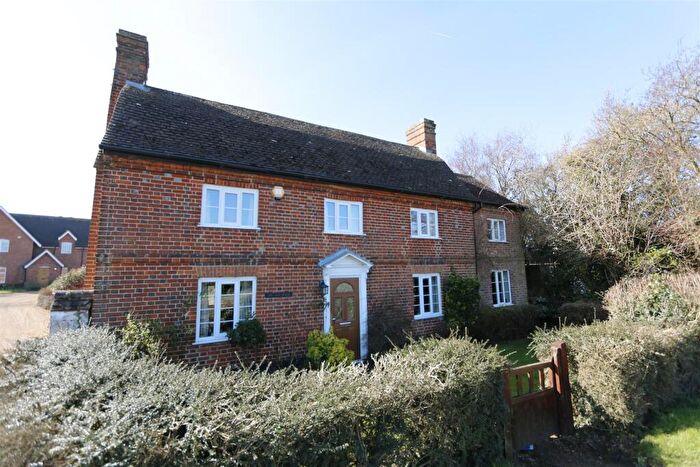
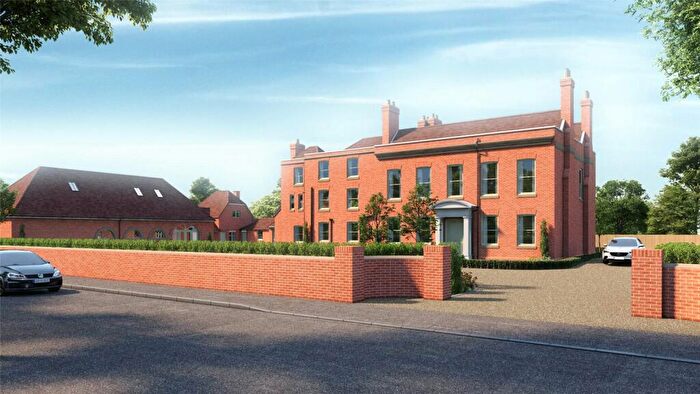
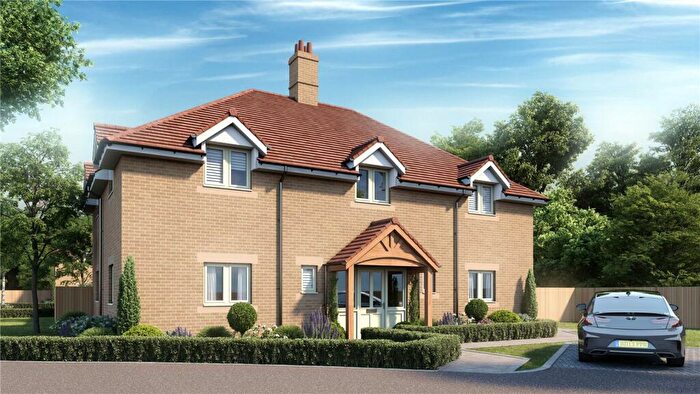
Properties for sale in Arlesey
Roads and Postcodes in Arlesey
Navigate through our locations to find the location of your next house in Arlesey, Shefford for sale or to rent.
| Streets | Postcodes |
|---|---|
| Alexander Close | SG17 5RB |
| Ashington Court | SG17 5RN |
| Bath Place | SG17 5HE |
| Bilberry Road | SG17 5HB SG17 5HD |
| Bilberry Terrace | SG17 5HZ |
| Birch Close | SG17 5QY |
| Brickle Place | SG17 5HL SG17 5HX |
| Broad Street | SG17 5RJ SG17 5RL SG17 5RP |
| Broad Walk | SG17 5HP |
| Bunyan Close | SG17 5RD |
| Burrows Close | SG17 5EG |
| Chapel Close | SG17 5YG |
| Church Street | SG17 5ES SG17 5ET SG17 5EX SG17 5EY |
| Clifton Fields | SG17 5QA |
| Clifton House Close | SG17 5EQ |
| Clifton House Gardens | SG17 5FR |
| Clifton Park | SG17 5PT SG17 5SJ |
| Elm Farm Close | SG17 5HF |
| Fairfax Close | SG17 5RH |
| Fairground Way | SG17 5JN |
| Godfreys Lane | SG17 5FW |
| Grange Street | SG17 5EW |
| Grays Close | SG17 5PY |
| Herberts Meadow | SG17 5FU |
| Hitchin Lane | SG17 5RS |
| Jubilee Close | SG17 5JW |
| Knolls Way | SG17 5QU SG17 5QZ |
| Legate Place | SG17 5GU |
| Lime Tree Road | SG17 5EP |
| Linkway | SG17 5ER |
| Lychmead | SG17 5EZ |
| Manor Close | SG17 5EJ |
| Maple Close | SG17 5QX |
| Meeks Croft | SG17 5GW |
| Miles Drive | SG17 5HS |
| New Road | SG17 5JH SG17 5JL SG17 5JJ |
| Newis Crescent | SG17 5HT SG17 5HU |
| Old School Court | SG17 5PW |
| Olivier Way | SG17 5HR |
| Pedley Farm Close | SG17 5FZ |
| Pedley Lane | SG17 5EH SG17 5EN SG17 5QT |
| Rectory Close | SG17 5EL |
| Rookery Walk | SG17 5HW |
| Sears Close | SG17 5HG |
| Shefford Road | SG17 5QS SG17 5RF SG17 5RG SG17 5RQ |
| Spring Road | SG17 5RE |
| Stanford Lane | SG17 5EU |
| Stockbridge Close | SG17 5FG |
| Stockbridge Road | SG17 5HA SG17 5HH |
| The Joint | SG17 5RR |
| West Close | SG17 5GT |
| Whiston Crescent | SG17 5HJ SG17 5HY |
| Yew Tree Walk | SG17 5HN |
Transport near Arlesey
-
Arlesey Station
-
Biggleswade Station
-
Letchworth Station
-
Baldock Station
-
Hitchin Station
-
Sandy Station
-
Ashwell and Morden Station
-
Flitwick Station
-
Kempston Hardwick Station
-
Bedford St.Johns Station
- FAQ
- Price Paid By Year
- Property Type Price
Frequently asked questions about Arlesey
What is the average price for a property for sale in Arlesey?
The average price for a property for sale in Arlesey is £438,484. This amount is 10% higher than the average price in Shefford. There are 255 property listings for sale in Arlesey.
What streets have the most expensive properties for sale in Arlesey?
The streets with the most expensive properties for sale in Arlesey are Pedley Lane at an average of £787,500, Fairfax Close at an average of £760,000 and Chapel Close at an average of £663,750.
What streets have the most affordable properties for sale in Arlesey?
The streets with the most affordable properties for sale in Arlesey are Legate Place at an average of £126,000, Bilberry Road at an average of £128,333 and West Close at an average of £252,500.
Which train stations are available in or near Arlesey?
Some of the train stations available in or near Arlesey are Arlesey, Biggleswade and Letchworth.
Property Price Paid in Arlesey by Year
The average sold property price by year was:
| Year | Average Sold Price | Price Change |
Sold Properties
|
|---|---|---|---|
| 2025 | £382,018 | -24% |
38 Properties |
| 2024 | £472,663 | 4% |
49 Properties |
| 2023 | £454,183 | 6% |
30 Properties |
| 2022 | £426,727 | -0,5% |
55 Properties |
| 2021 | £428,741 | 4% |
62 Properties |
| 2020 | £411,029 | 2% |
51 Properties |
| 2019 | £402,370 | -4% |
51 Properties |
| 2018 | £417,582 | 18% |
41 Properties |
| 2017 | £341,896 | -2% |
52 Properties |
| 2016 | £349,874 | -14% |
67 Properties |
| 2015 | £398,379 | 22% |
63 Properties |
| 2014 | £311,898 | 30% |
55 Properties |
| 2013 | £218,693 | -30% |
59 Properties |
| 2012 | £284,570 | 11% |
38 Properties |
| 2011 | £251,954 | -11% |
34 Properties |
| 2010 | £279,863 | 22% |
34 Properties |
| 2009 | £217,222 | -23% |
37 Properties |
| 2008 | £267,279 | 6% |
25 Properties |
| 2007 | £250,962 | 4% |
55 Properties |
| 2006 | £240,364 | 3% |
72 Properties |
| 2005 | £233,654 | 11% |
80 Properties |
| 2004 | £207,057 | -1% |
45 Properties |
| 2003 | £208,917 | 0,3% |
55 Properties |
| 2002 | £208,369 | 30% |
65 Properties |
| 2001 | £146,760 | 6% |
55 Properties |
| 2000 | £137,473 | 13% |
38 Properties |
| 1999 | £120,243 | 19% |
44 Properties |
| 1998 | £97,256 | 7% |
50 Properties |
| 1997 | £90,681 | 19% |
40 Properties |
| 1996 | £73,515 | 7% |
56 Properties |
| 1995 | £68,519 | - |
47 Properties |
Property Price per Property Type in Arlesey
Here you can find historic sold price data in order to help with your property search.
The average Property Paid Price for specific property types in the last three years are:
| Property Type | Average Sold Price | Sold Properties |
|---|---|---|
| Semi Detached House | £395,964.00 | 42 Semi Detached Houses |
| Detached House | £579,000.00 | 42 Detached Houses |
| Terraced House | £332,306.00 | 30 Terraced Houses |
| Flat | £128,333.00 | 3 Flats |

