
Houses for sale & to rent in Wyboston, St Neots
House Prices in Wyboston
Properties in Wyboston have an average house price of £355k and had 14 Property Transactions within the last 3 years¹.
Wyboston is an area in St Neots, Bedfordshire with 111 households², where the most expensive property was sold for £550k.
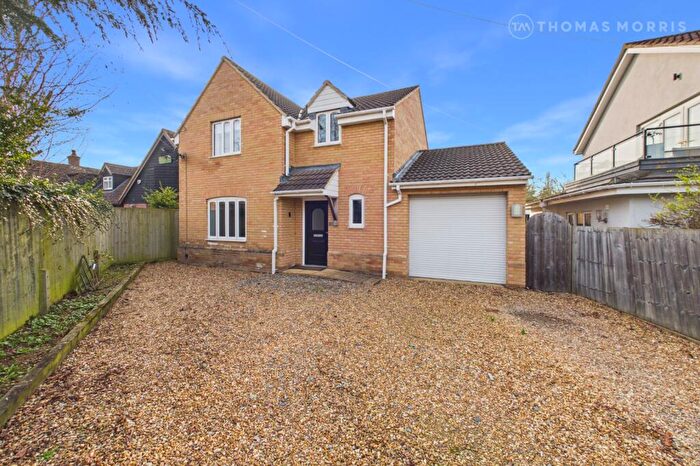
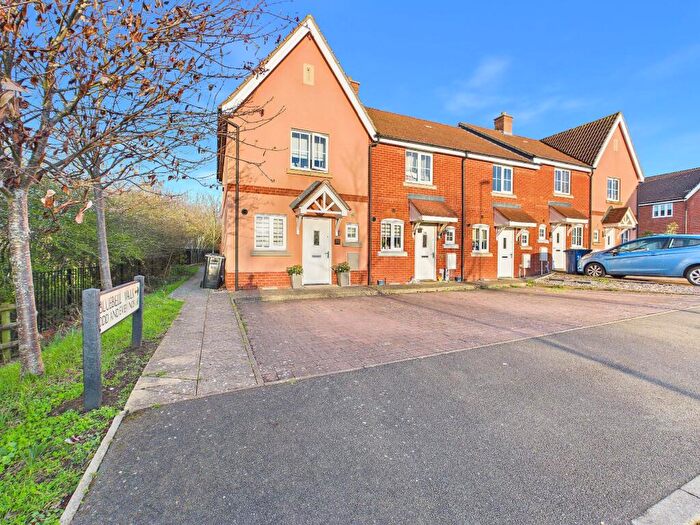
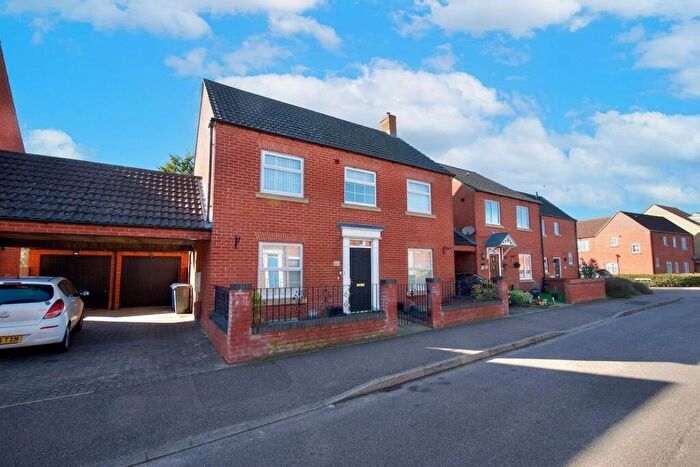
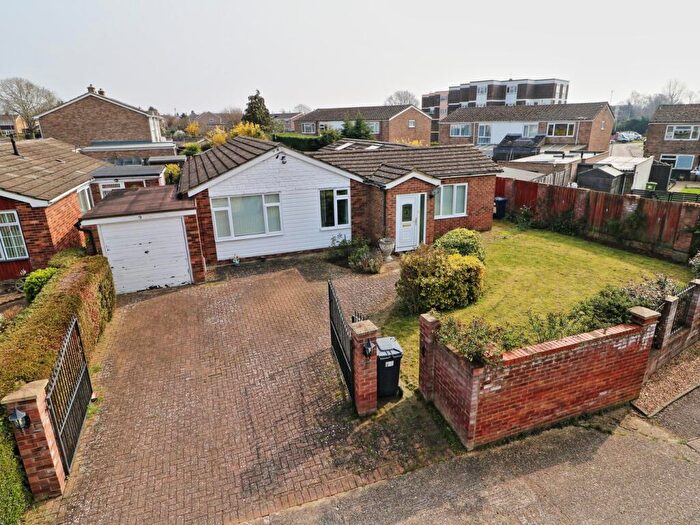
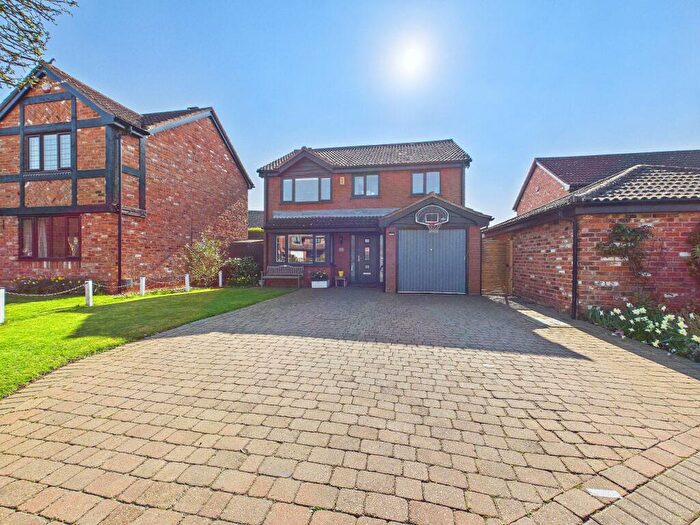
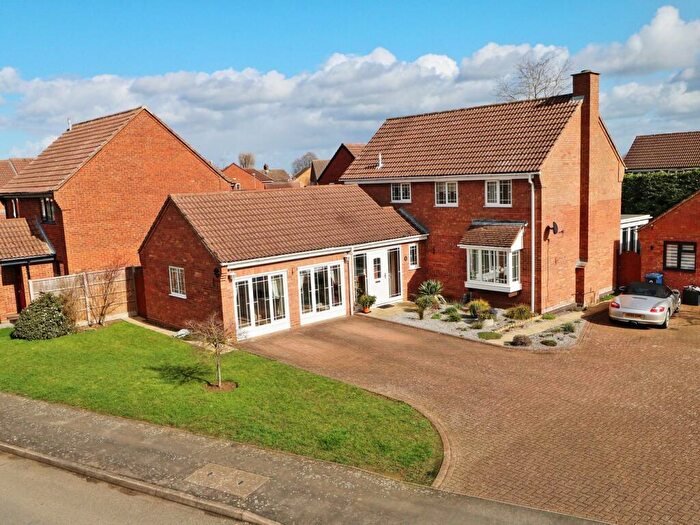
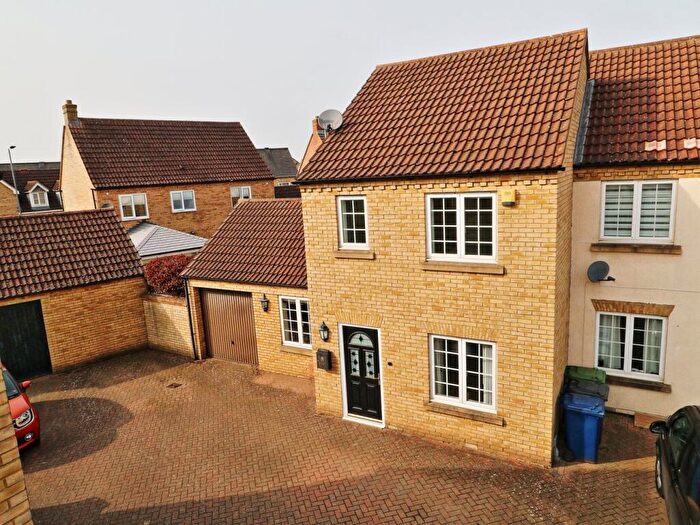
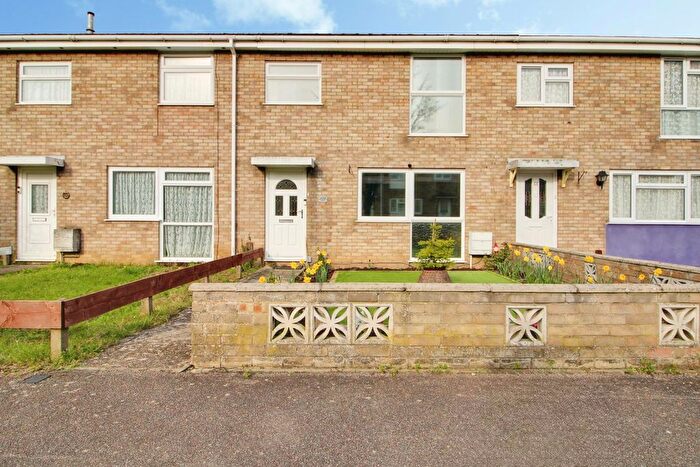
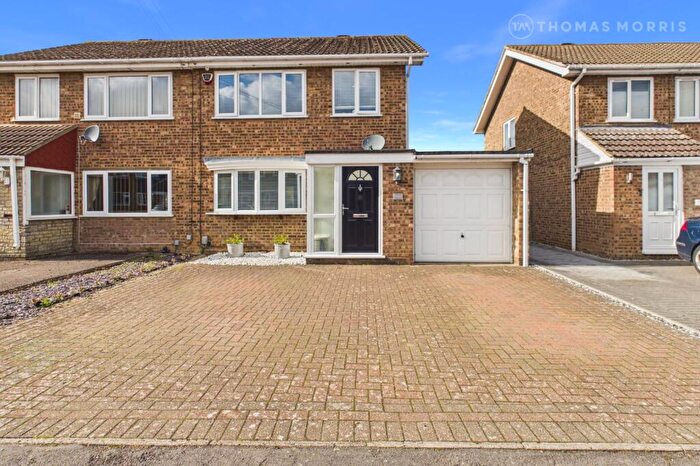
Properties for sale in Wyboston
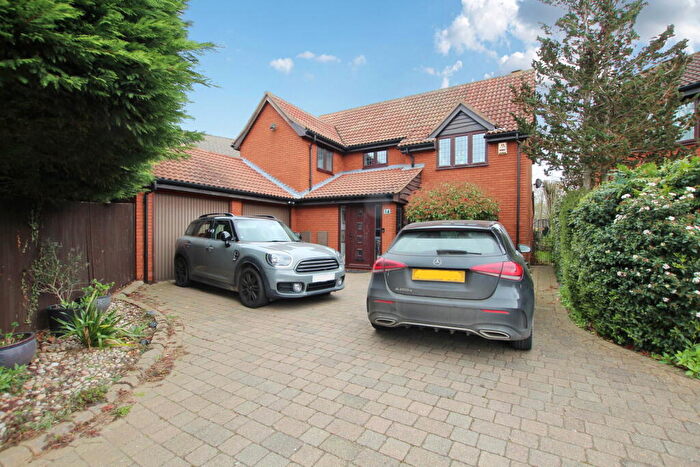
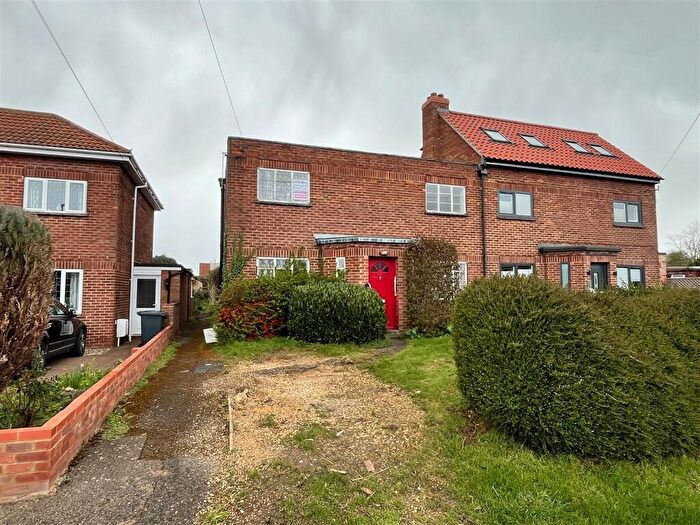
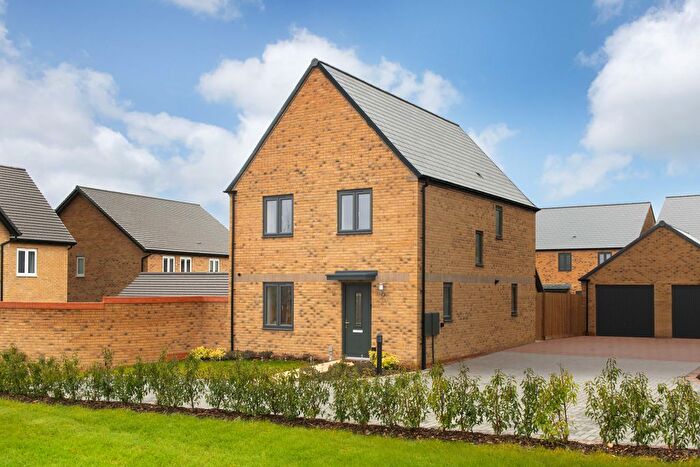

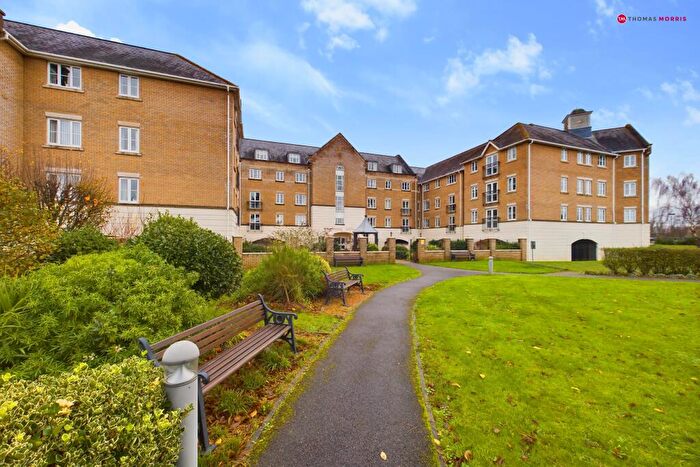
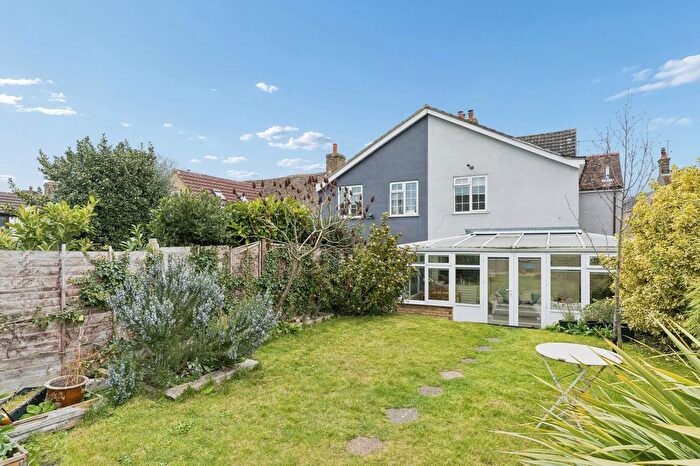
![]()
If you are looking to sell your house, let it out, or receive a property valuation, an expert can help you.
Click the button below to get started.


Roads and Postcodes in Wyboston
Navigate through our locations to find the location of your next house in Wyboston, St Neots for sale or to rent.
| Streets | Postcodes |
|---|---|
| Alington Road | PE19 6RE PE19 6WG PE19 6WL PE19 6YH |
| Barford Road | PE19 6WB |
| Bushmead Road | PE19 8JD PE19 8JG |
| Fenice Court | PE19 8EW |
| Generation Business Park | PE19 6YQ |
| Kimbolton Road | PE19 5JX |
| Oakpark Business Centre | PE19 6WA |
| Phoenix Park | PE19 8EP |
| Top Lane | PE19 6UH |
| Woodhouse Lane | PE19 5HR |
| PE19 5HP PE19 5JA PE19 5JB PE19 5JD PE19 5JF PE19 6YE PE19 5HQ PE19 5HT PE19 5JE PE19 6YD PE19 6YT |
Transport near Wyboston
-
 St.Neots Station
 -
Sandy Station
-
Huntingdon Station
-
Biggleswade Station
-
Bedford St.Johns Station
-
Bedford Midland Station
- FAQ
- Price Paid By Year
- Property Type Price
Frequently asked questions about Wyboston
What is the average price for a property for sale in Wyboston?
The average price for a property for sale in Wyboston is £354,982. This amount is 5% lower than the average price in St Neots. There are 3,211 property listings for sale in Wyboston.
Which train stations are available in or near Wyboston?
Some of the train stations available in or near Wyboston are St.Neots, Sandy and Huntingdon.
Property Price Paid in Wyboston by Year
The average sold property price by year was:
| Year | Average Sold Price | Price Change |
Sold Properties
|
|---|---|---|---|
| 2025 | £346,208 | 5% |
6 Properties |
| 2024 | £330,500 | -25% |
5 Properties |
| 2023 | £413,333 | 2% |
3 Properties |
| 2022 | £407,125 | 25% |
4 Properties |
| 2021 | £304,083 | -58% |
6 Properties |
| 2020 | £480,000 | 36% |
2 Properties |
| 2019 | £307,000 | 17% |
1 Property |
| 2018 | £254,800 | -15% |
5 Properties |
| 2017 | £293,166 | -43% |
6 Properties |
| 2015 | £420,000 | 39% |
2 Properties |
| 2014 | £255,000 | -57% |
2 Properties |
| 2013 | £399,333 | 26% |
3 Properties |
| 2012 | £295,000 | -74% |
1 Property |
| 2011 | £512,750 | 32% |
4 Properties |
| 2010 | £349,995 | 45% |
1 Property |
| 2009 | £193,500 | -74% |
4 Properties |
| 2008 | £337,498 | 45% |
4 Properties |
| 2007 | £184,500 | -24% |
3 Properties |
| 2006 | £229,333 | 25% |
3 Properties |
| 2005 | £173,000 | -30% |
1 Property |
| 2004 | £225,000 | -78% |
1 Property |
| 2003 | £401,525 | 29% |
4 Properties |
| 2002 | £285,000 | 35% |
3 Properties |
| 2001 | £185,118 | -33% |
8 Properties |
| 2000 | £247,083 | 59% |
6 Properties |
| 1999 | £100,875 | -10% |
4 Properties |
| 1998 | £110,498 | 36% |
5 Properties |
| 1997 | £70,549 | -3% |
5 Properties |
| 1996 | £73,000 | 2% |
7 Properties |
| 1995 | £71,666 | - |
6 Properties |
Property Price per Property Type in Wyboston
Here you can find historic sold price data in order to help with your property search.
The average Property Paid Price for specific property types in the last three years are:
| Property Type | Average Sold Price | Sold Properties |
|---|---|---|
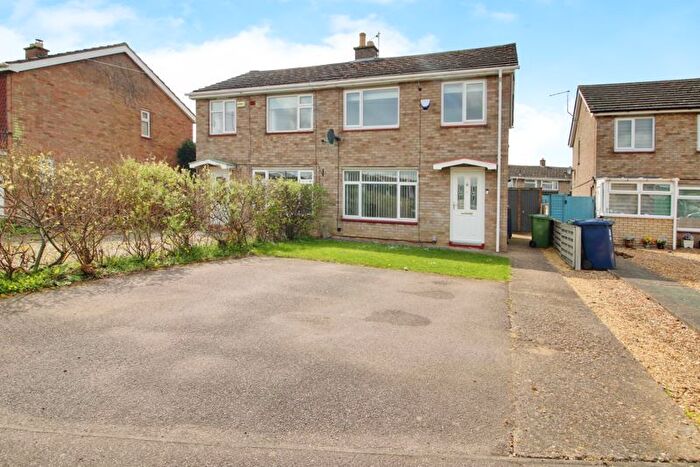
| Semi Detached House | £346,968.00 | 8 Semi Detached Houses |
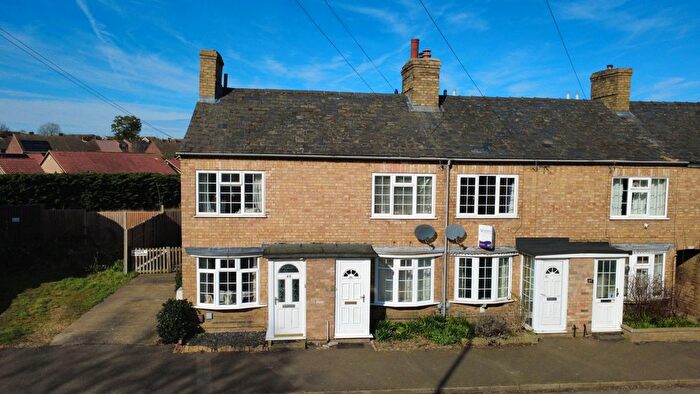
| Terraced House | £248,000.00 | 1 Terraced House |
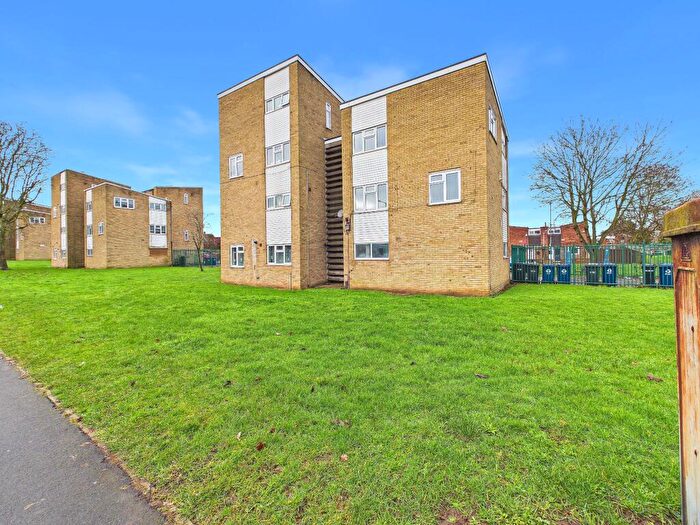
| Detached House | £445,000.00 | 4 Detached Houses |
| Flat | £166,000.00 | 1 Flat |