
Houses for sale in Sidcup, Bexley London Borough
House Prices in Sidcup
Properties in this part of Sidcup within the Bexley London Borough have an average house price of £447k and had 2,249 Property Transactions within the last 3 years.¹ This area has 21,058 households² , where the most expensive property was sold for £1.5M.
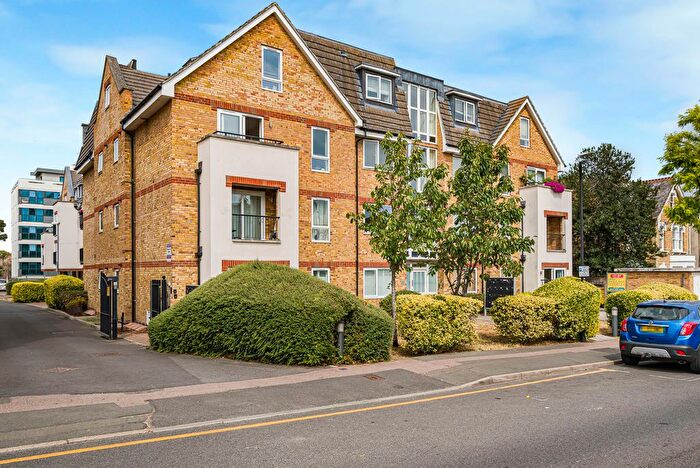
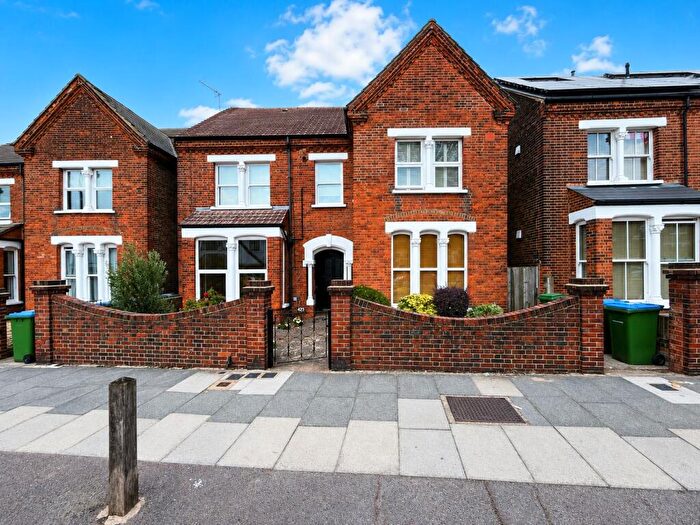
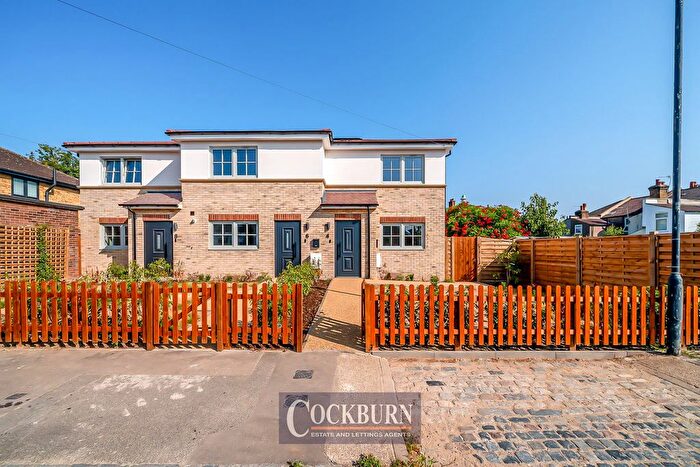
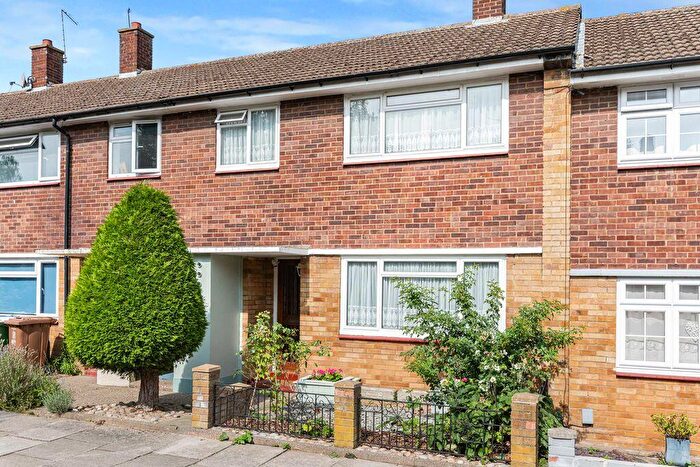
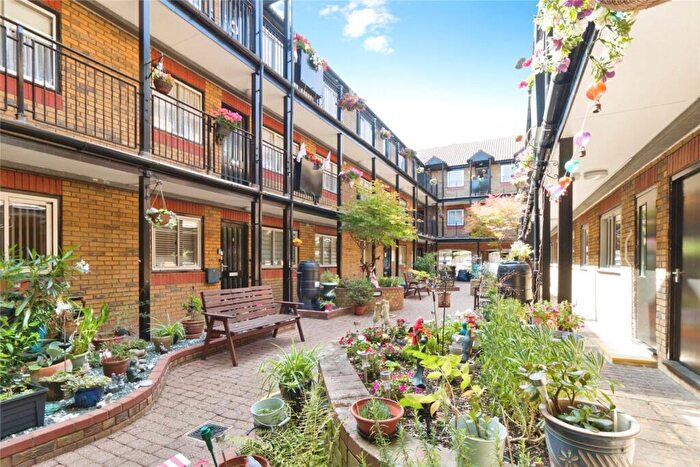
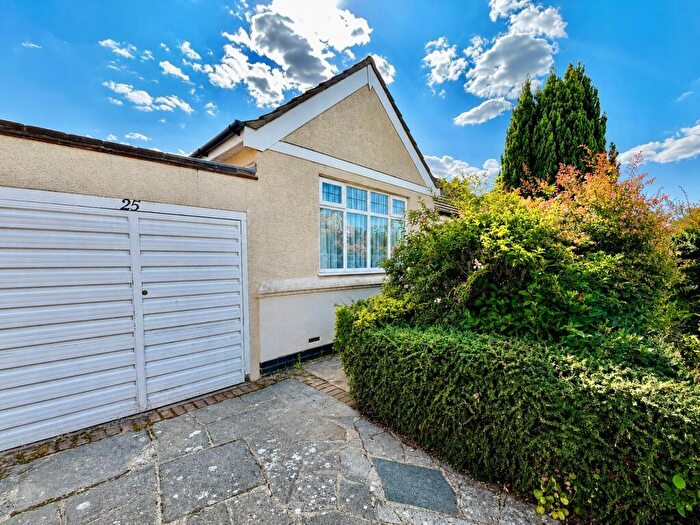
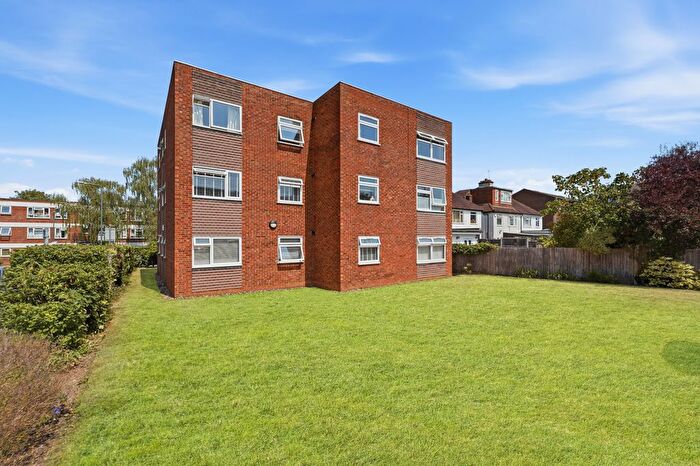
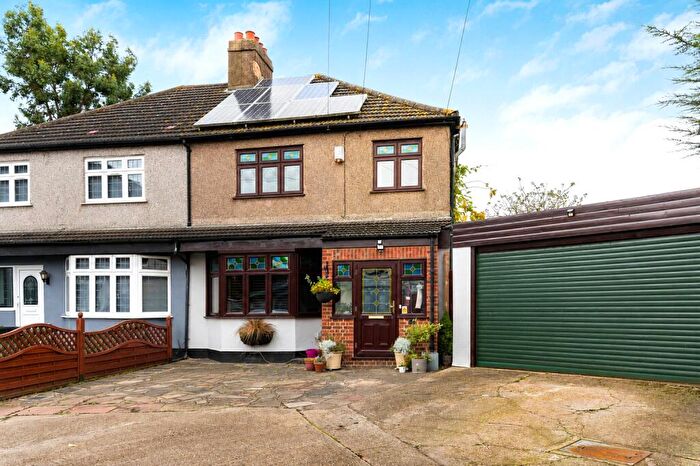
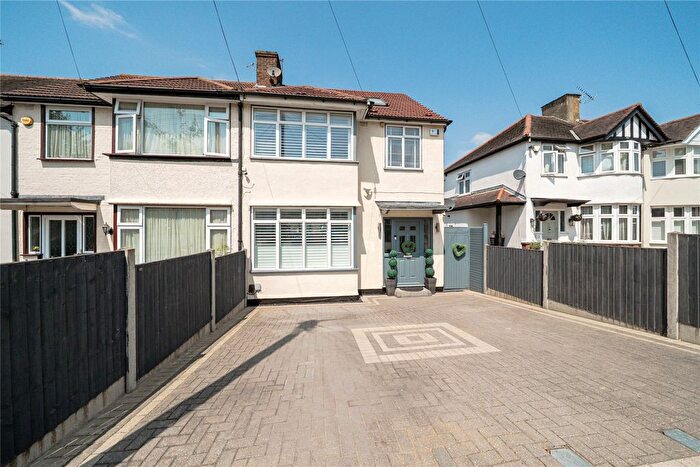
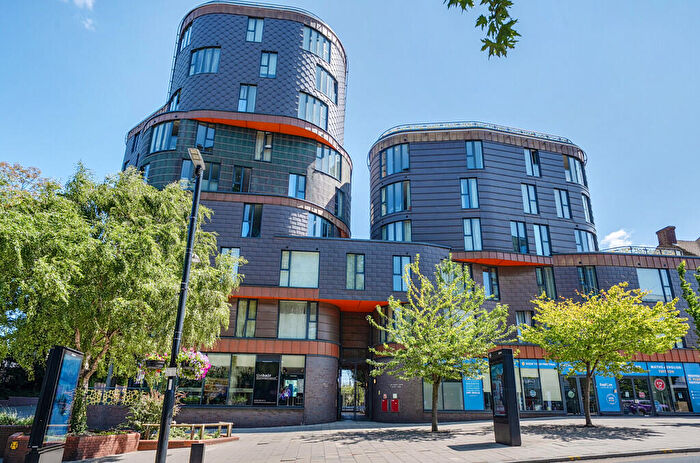
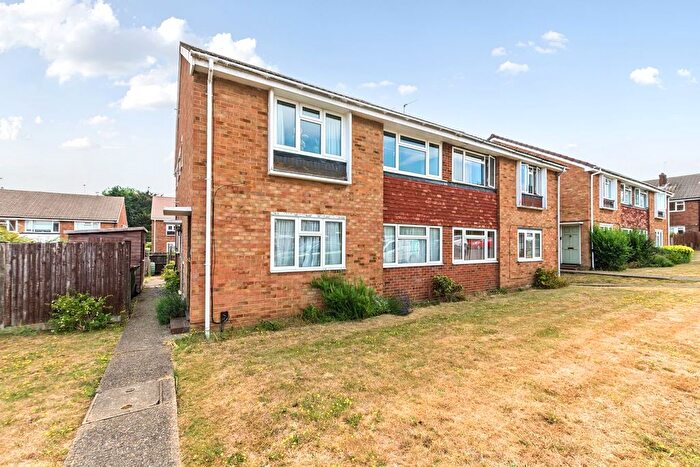
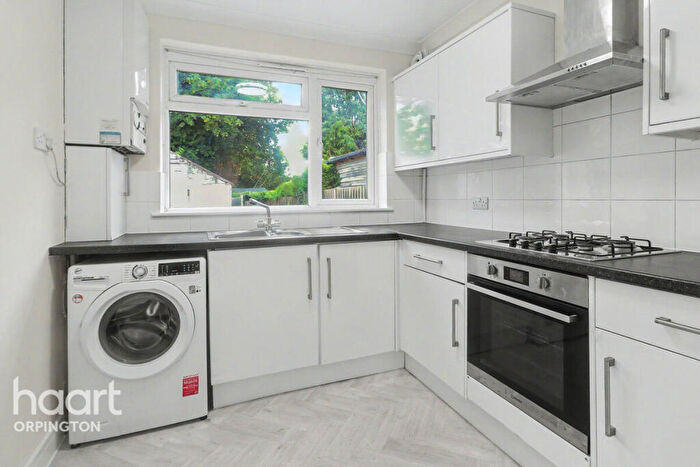
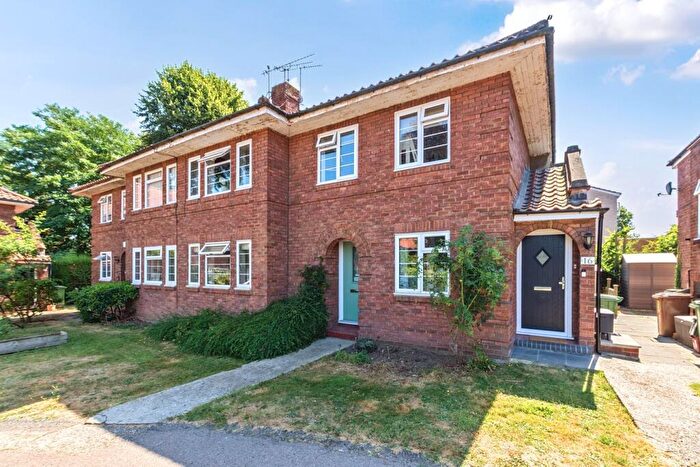
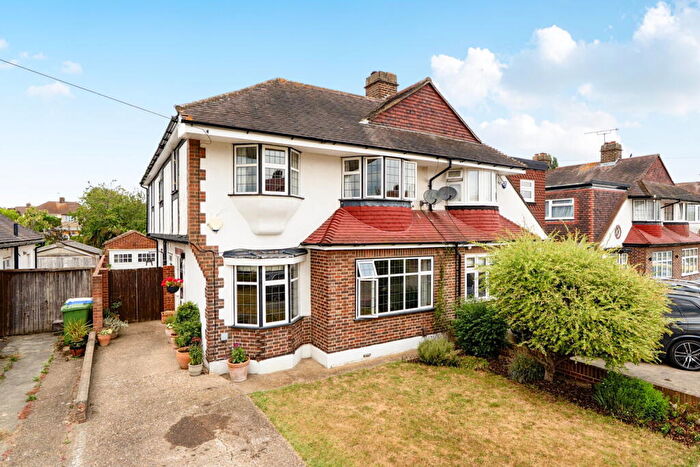
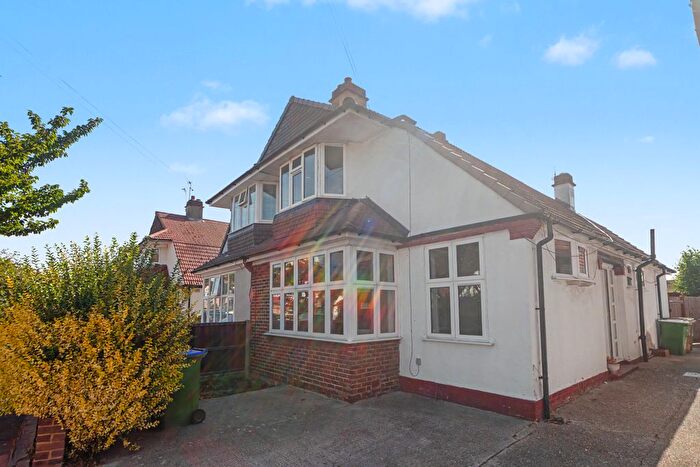
Properties for sale in Sidcup
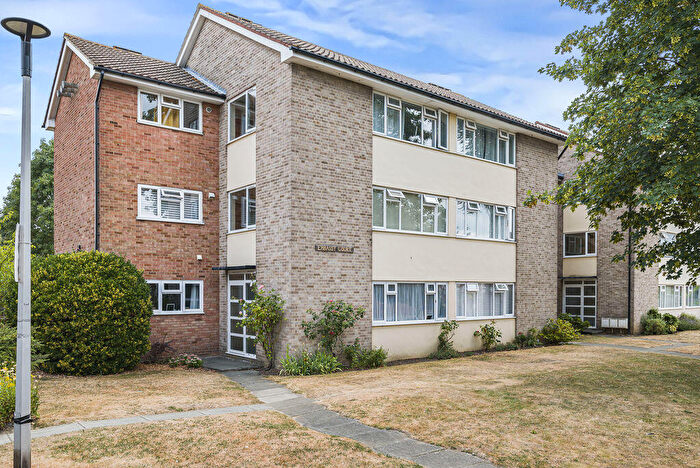
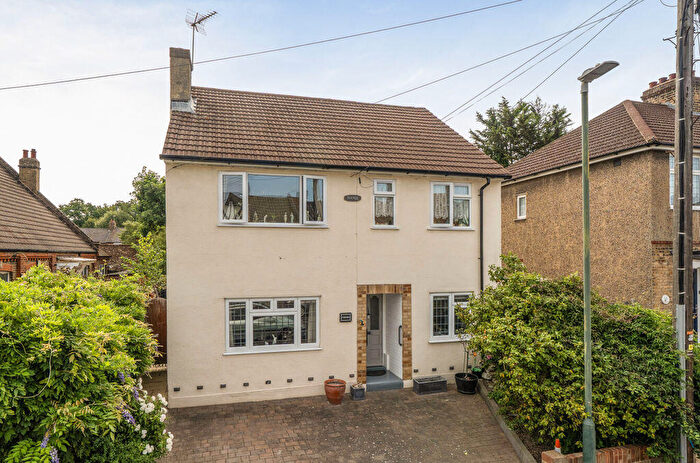
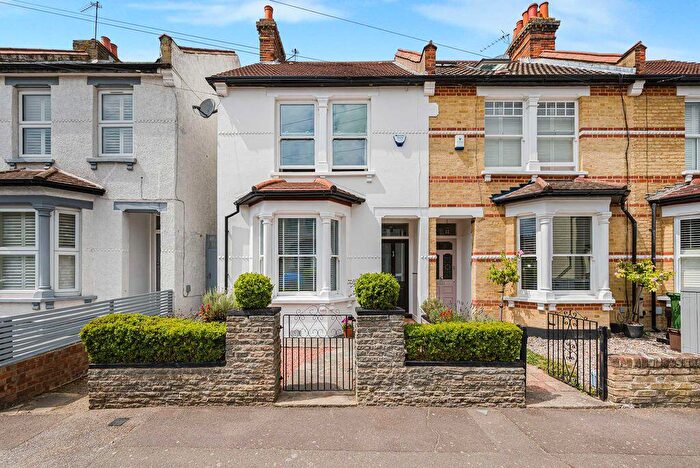
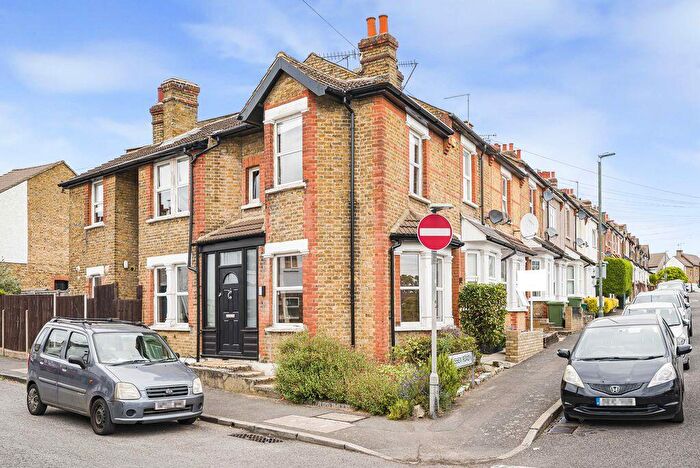
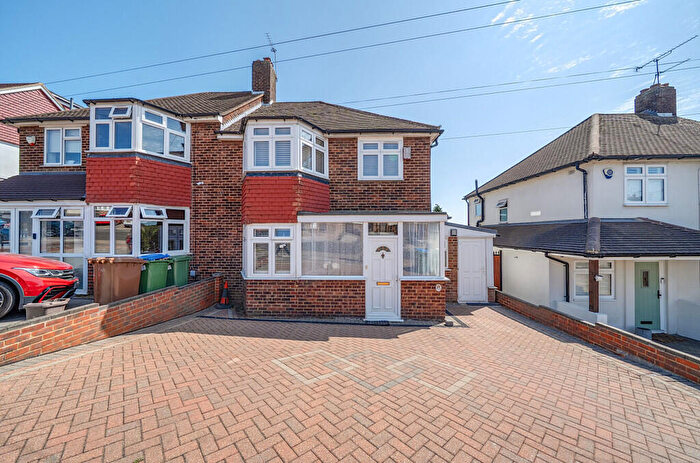
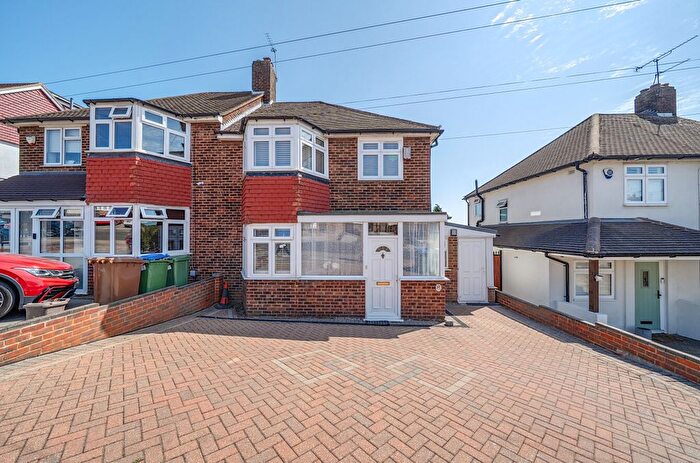
![]()
If you are looking to sell your house, let it out, or receive a property valuation, an expert can help you.
Click the button below to get started.
Neighbourhoods in Sidcup
Navigate through our locations to find the location of your next house in Sidcup, Bexley London Borough for sale or to rent.
Property price trends in Sidcup
According to the latest Land Registry data, the average home in Sidcup sold for £417,980 in 2026. That figure comes from a substantial record of 28,459 sales logged over the past 31 years.
Prices have softened over the last three years. Compared with 2023, when the typical sale came in around £437,650, that's a fall of roughly 4.5%.
Looking back five years, average prices are down about 2.7% since 2021, a drop of around £11,598 in cash terms.
Zoom out to the past decade for the fuller picture. Back in 2016, homes here averaged £361,280, so the typical sold price has climbed about 15.7% since then, roughly 1.5% a year. Stretch the view to fifteen years and that annual pace edges up closer to 3.5%.
Frequently asked questions about Sidcup
What is the average price for a property for sale in Sidcup?
The average price for a property for sale in Sidcup is £446,980. This amount is 5% higher than the average price in Bexley London Borough. There are more than 10,000 property listings for sale in Sidcup.
What locations have the most expensive properties for sale in Sidcup?
The locations with the most expensive properties for sale in Sidcup are Blackfen And Lamorbey at an average of £473,099, Longlands at an average of £458,230 and St Marys at an average of £456,900.
What locations have the most affordable properties for sale in Sidcup?
The locations with the most affordable properties for sale in Sidcup are St Mary's & St James at an average of £347,000, Falconwood And Welling at an average of £389,710 and Danson Park at an average of £403,100.
Which train stations are available in or near Sidcup?
Some of the train stations available in or near Sidcup are Sidcup, Albany Park and New Eltham.
Property Price Paid in Sidcup by Year
The average sold property price by year was:
| Year | Average Sold Price | Price Change |
Sold Properties
|
|---|---|---|---|
| 2026 | £417,980 | -9% |
39 Properties |
| 2025 | £457,478 | 2% |
744 Properties |
| 2024 | £446,432 | 2% |
797 Properties |
| 2023 | £437,650 | -3% |
669 Properties |
| 2022 | £452,552 | 5% |
818 Properties |
| 2021 | £429,578 | 5% |
1,091 Properties |
| 2020 | £408,988 | 4% |
738 Properties |
| 2019 | £391,454 | 2% |
825 Properties |
| 2018 | £385,506 | 2% |
784 Properties |
| 2017 | £375,951 | 4% |
834 Properties |
Property Price per Property Type in Sidcup
Here you can find historic sold price data in order to help with your property search.
The average Property Paid Price for specific property types in the last three years are:
| Property Type | Average Sold Price | Sold Properties |
|---|---|---|
| Semi Detached House | £557,518.00 | 702 Semi Detached Houses |
| Detached House | £794,353.00 | 138 Detached Houses |
| Terraced House | £439,613.00 | 703 Terraced Houses |
| Flat | £276,505.00 | 706 Flats |
Transport in Sidcup
Please see below transportation links in this area:
