
Houses for sale in Sidcup, Sidcup
House Prices in Sidcup
Properties in this part of Sidcup within Sidcup have an average house price of £438k and had 621 Property Transactions within the last 3 years¹. This area has 5,254 households² , where the most expensive property was sold for £1.5M.
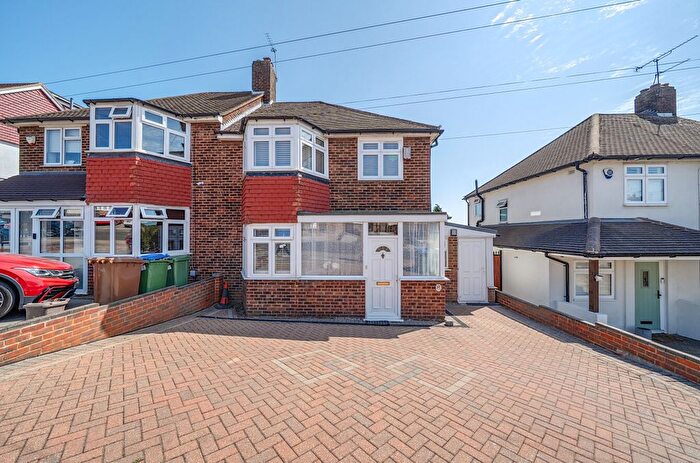
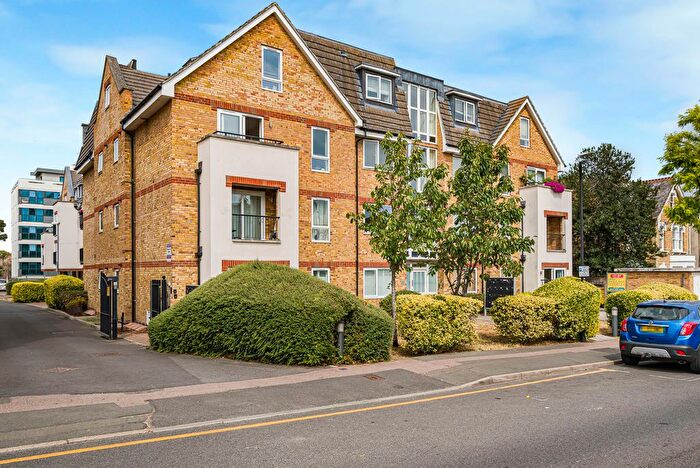
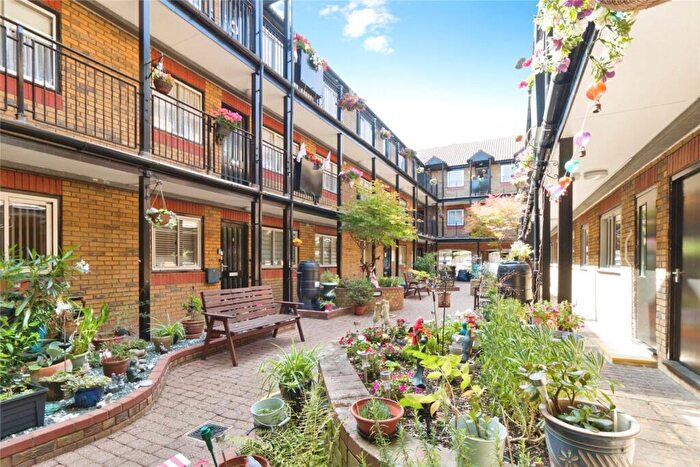
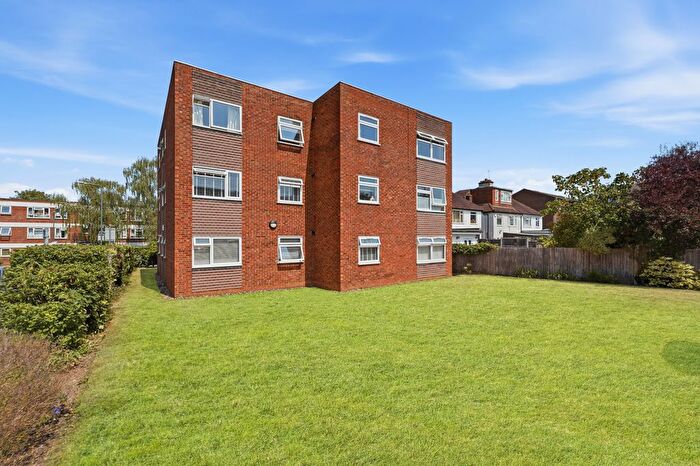
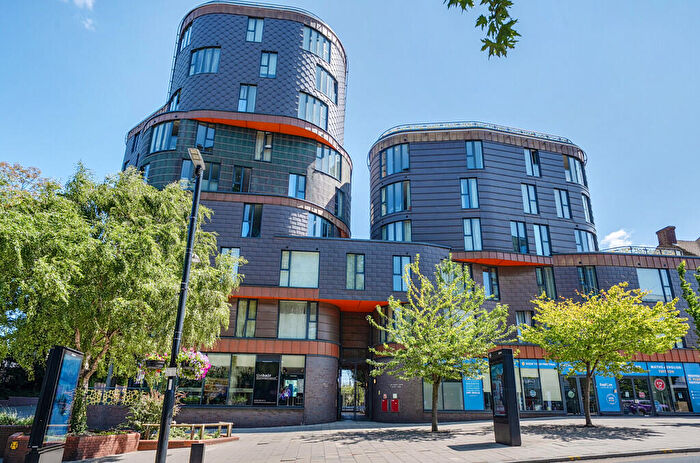
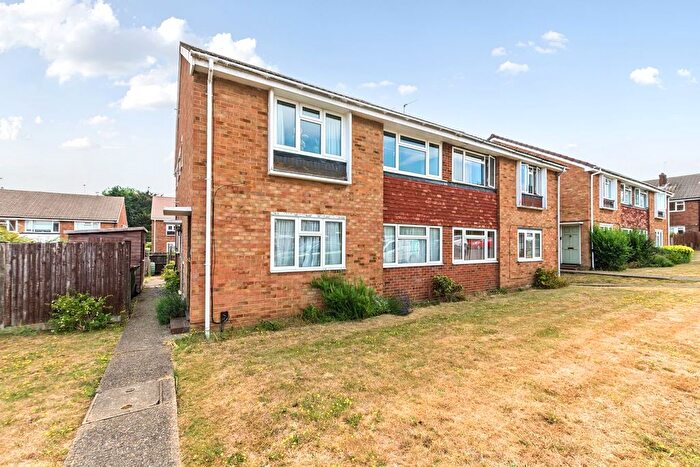
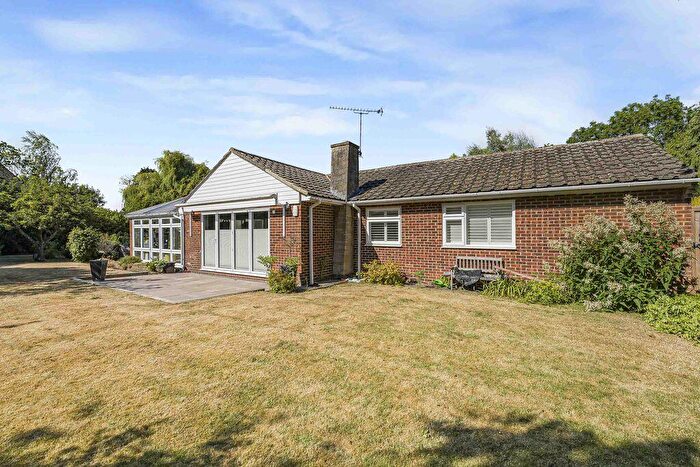
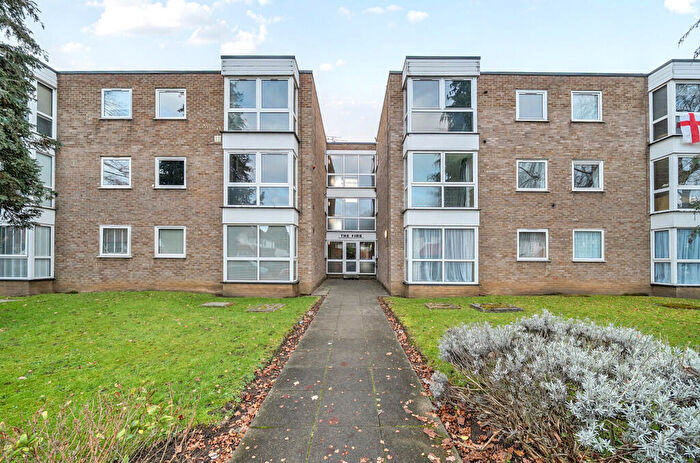
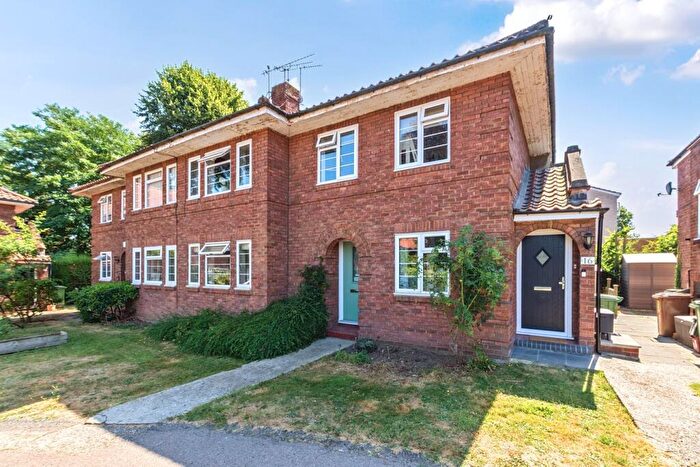
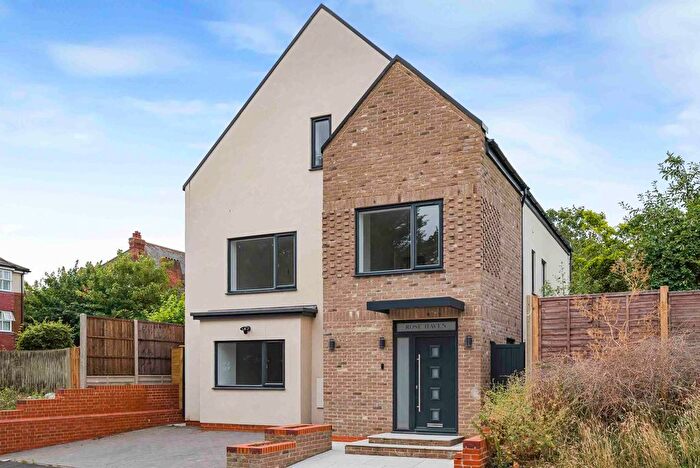
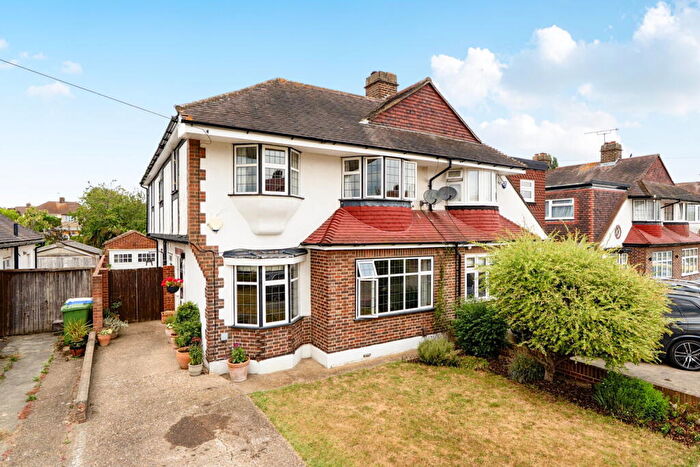
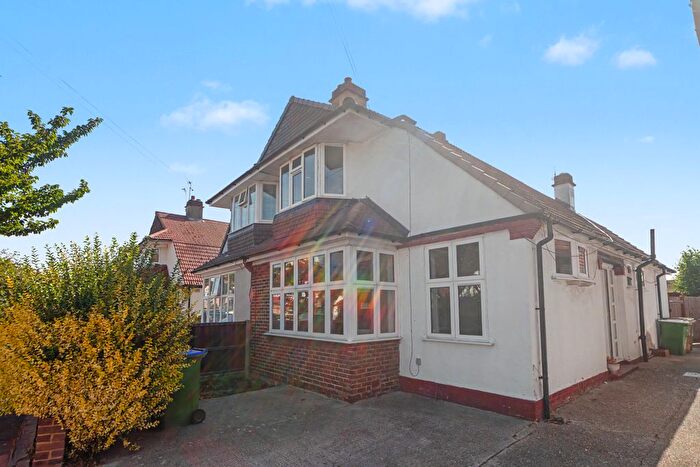
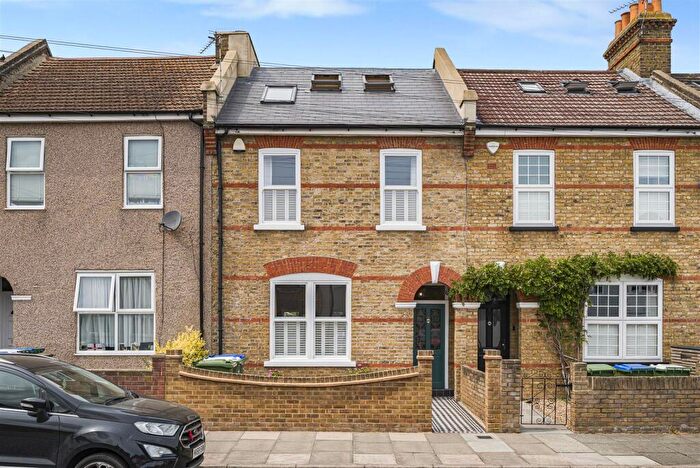
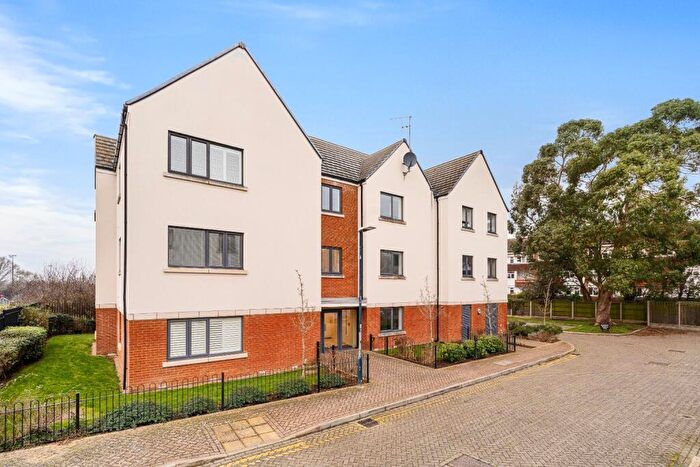
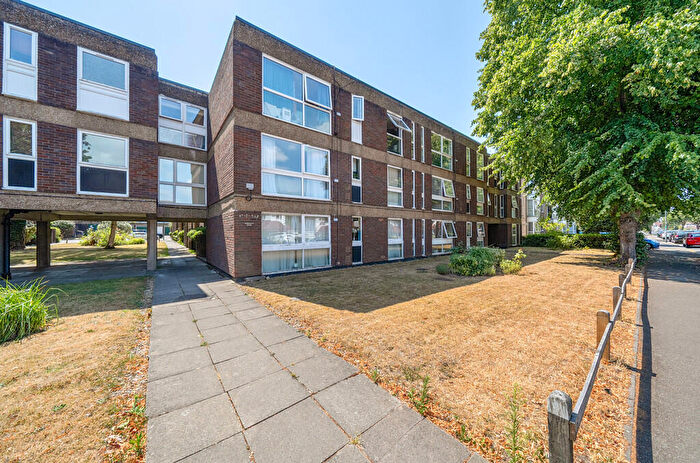
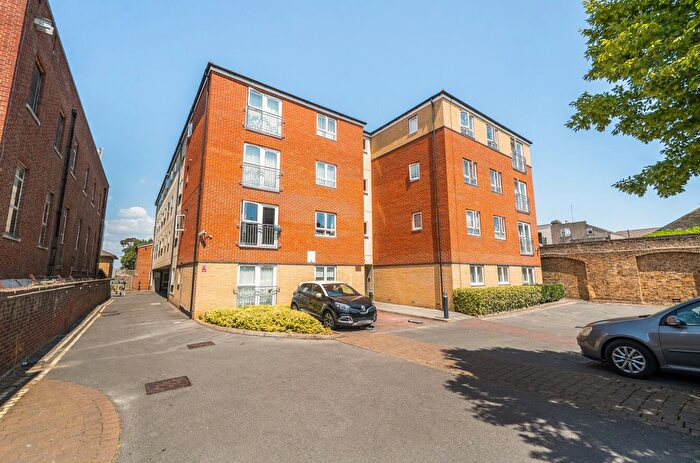
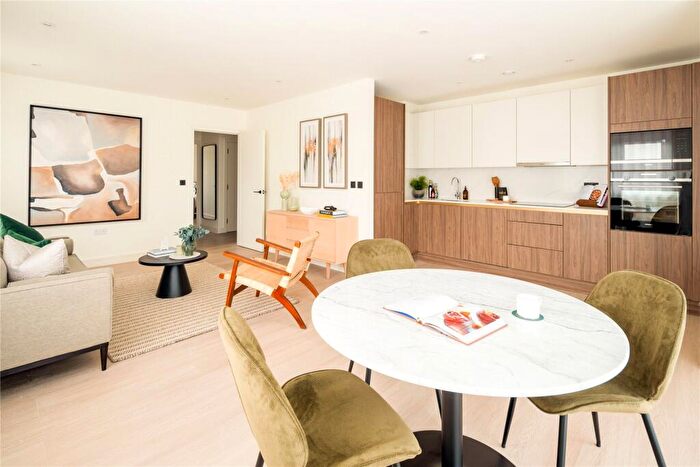
Properties for sale in Sidcup
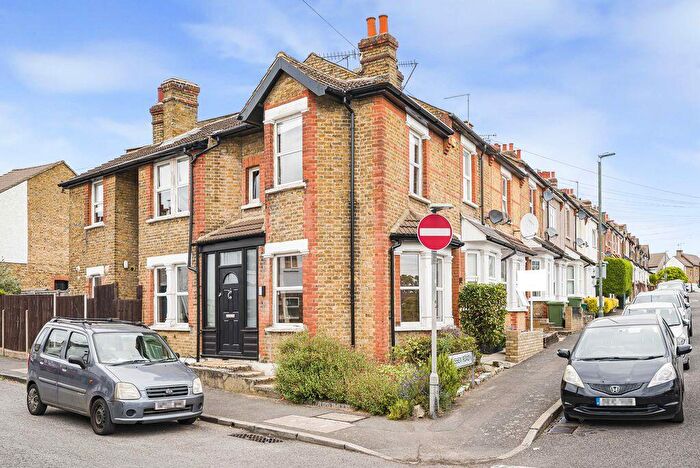
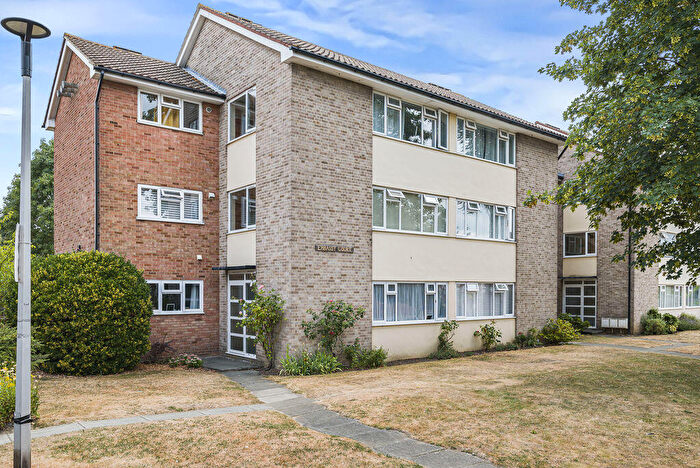
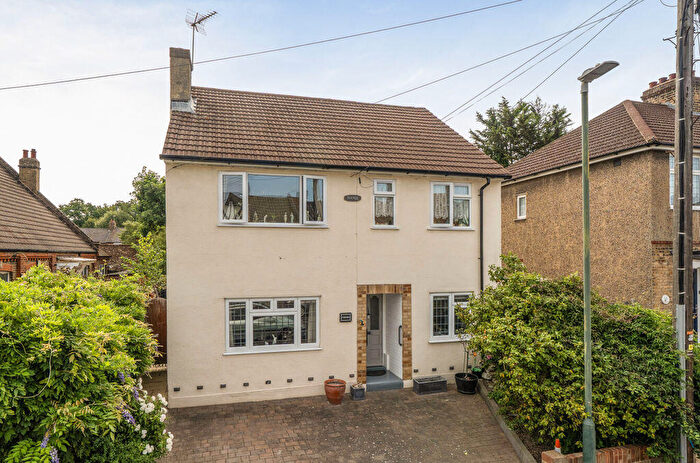
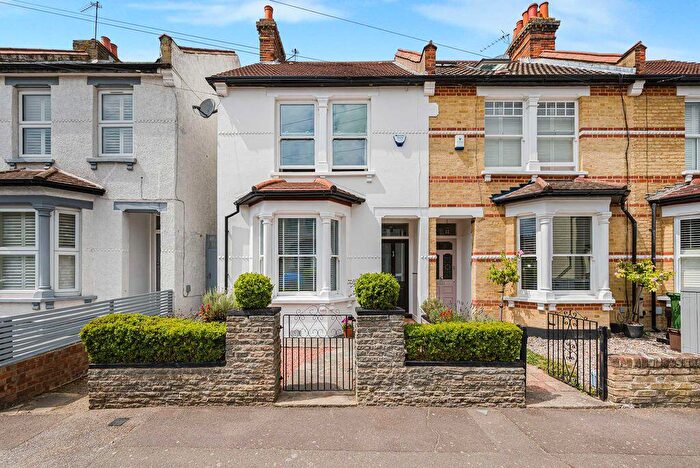
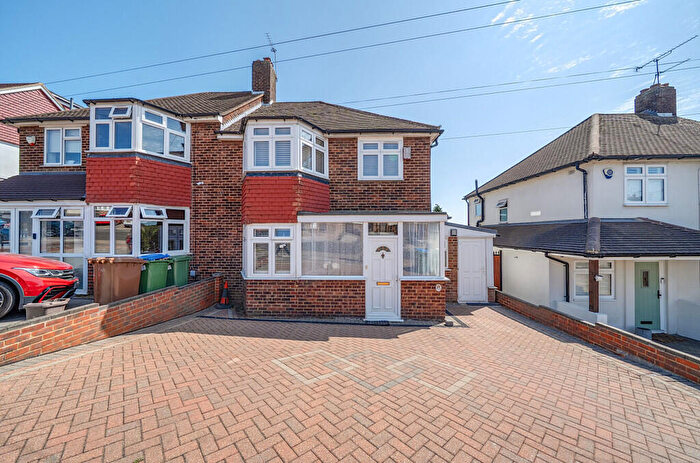
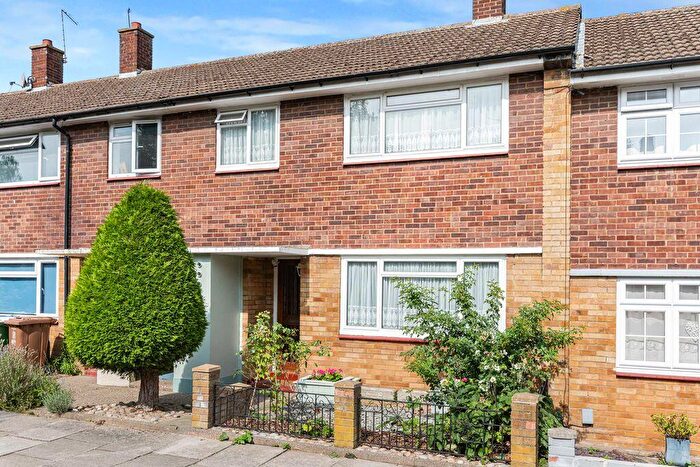
![]()
If you are looking to sell your house, let it out, or receive a property valuation, an expert can help you.
Click the button below to get started.

Roads and Postcodes in Sidcup
Navigate through our locations to find the location of your next house in Sidcup, Sidcup for sale or to rent.
Property price trends in Sidcup
According to the latest Land Registry data, the average home in Sidcup sold for £399,652 in 2026. That figure comes from a substantial record of 6,910 sales logged over the past 31 years.
Prices have fallen back over the last three years. Compared with 2023, when the typical sale came in around £440,659, that's a fall of roughly 9.3%.
Looking back five years, average prices are down about 8.3% since 2021, a drop of around £36,190 in cash terms.
Zoom out to the past decade for the fuller picture. Back in 2016, homes here averaged £380,362, so the typical sold price has climbed about 5.1% since then, roughly 0.5% a year. Stretch the view to fifteen years and that annual pace edges up closer to 2.8%.
Frequently asked questions about Sidcup
What is the average price for a property for sale in Sidcup?
The average price for a property for sale in Sidcup is £438,236. This amount is 2% lower than the average price in Sidcup. There are 7,630 property listings for sale in Sidcup.
What streets have the most expensive properties for sale in Sidcup?
The streets with the most expensive properties for sale in Sidcup are Church Avenue at an average of £1,110,000, White Oak Gardens at an average of £1,048,500 and Marrabon Close at an average of £1,040,000.
What streets have the most affordable properties for sale in Sidcup?
The streets with the most affordable properties for sale in Sidcup are Foots Cray High Street at an average of £118,666, Frognal Place at an average of £163,375 and Hatherley Crescent at an average of £206,760.
Which train stations are available in or near Sidcup?
Some of the train stations available in or near Sidcup are Sidcup, Albany Park and New Eltham.
Property Price Paid in Sidcup by Year
The average sold property price by year was:
| Year | Average Sold Price | Price Change |
Sold Properties
|
|---|---|---|---|
| 2026 | £399,652 | -15% |
18 Properties |
| 2025 | £461,083 | 9% |
194 Properties |
| 2024 | £420,956 | -5% |
240 Properties |
| 2023 | £440,659 | 0,1% |
169 Properties |
| 2022 | £440,309 | 1% |
240 Properties |
| 2021 | £435,842 | 2% |
271 Properties |
| 2020 | £426,333 | 2% |
181 Properties |
| 2019 | £417,792 | 7% |
228 Properties |
| 2018 | £387,373 | 7% |
204 Properties |
| 2017 | £360,014 | -6% |
254 Properties |
Property Price per Property Type in Sidcup
Here you can find historic sold price data in order to help with your property search.
The average Property Paid Price for specific property types in the last three years are:
| Property Type | Average Sold Price | Sold Properties |
|---|---|---|
| Flat | £276,488.00 | 331 Flats |
| Semi Detached House | £655,315.00 | 107 Semi Detached Houses |
| Detached House | £864,385.00 | 60 Detached Houses |
| Terraced House | £476,792.00 | 123 Terraced Houses |
