Houses for sale & to rent in Audley, Blackburn
House Prices in Audley
Properties in Audley have an average house price of £112,924.00 and had 91 Property Transactions within the last 3 years¹.
Audley is an area in Blackburn, Blackburn with Darwen with 2,454 households², where the most expensive property was sold for £300,000.00.
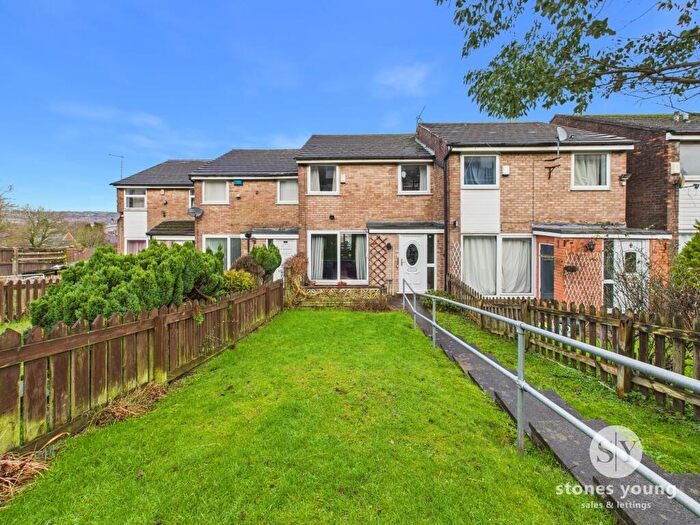
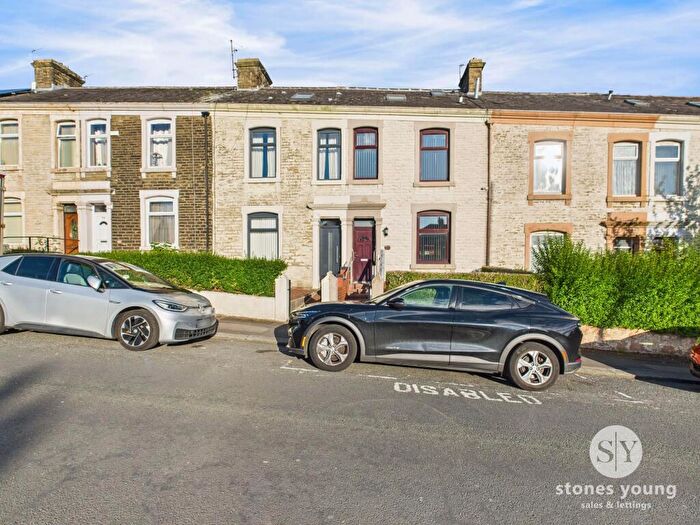
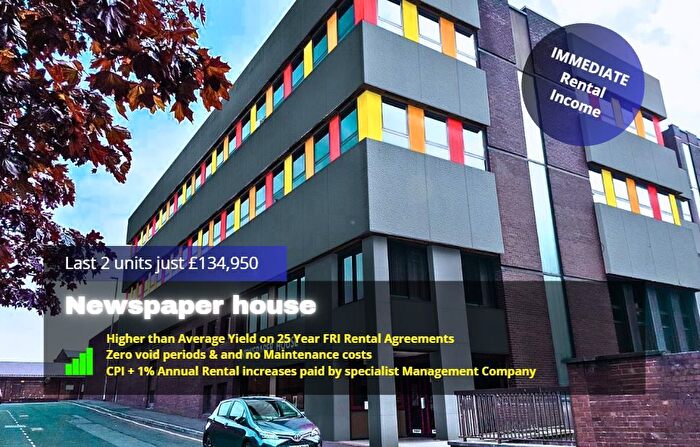
Properties for sale in Audley
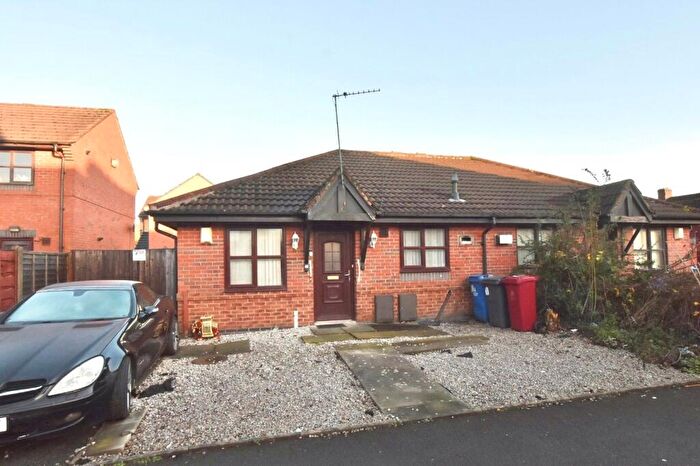
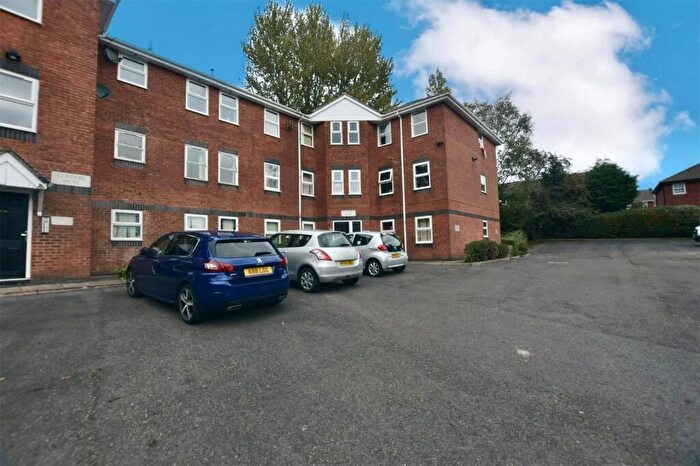
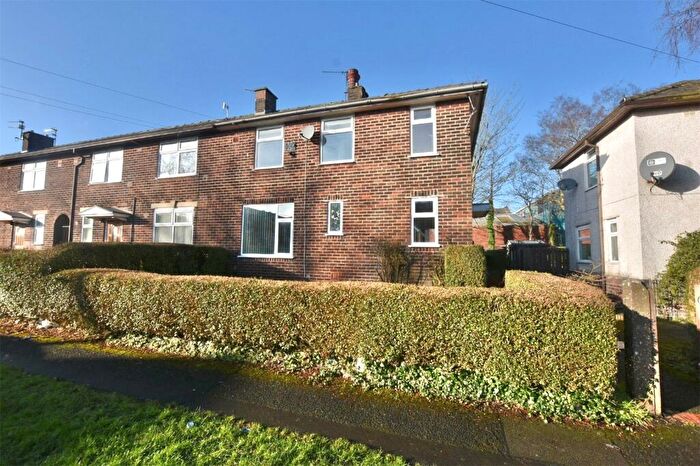
Previously listed properties in Audley
Roads and Postcodes in Audley
Navigate through our locations to find the location of your next house in Audley, Blackburn for sale or to rent.
| Streets | Postcodes |
|---|---|
| Aberdeen Drive | BB1 1LS |
| Acacia Walk | BB1 1XE |
| Accrington Road | BB1 2AA BB1 2AE BB1 2AF |
| Acorn Street | BB1 1PA |
| Ambleside Close | BB1 5HD BB1 5HE BB1 5HF |
| Audley Lane | BB1 1LT |
| Audley Range | BB1 1TG BB1 1TH BB1 1UA BB1 1UB BB1 1UD |
| Baker Street | BB1 1NZ |
| Beechwood Road | BB1 5JL |
| Belper Street | BB1 5HA |
| Bentley Street | BB1 3JT |
| Billinge Street | BB1 1LE |
| Birch Walk | BB1 1UJ |
| Bottomgate | BB1 3AD |
| Bowness Close | BB1 5LJ |
| Briar Hill Close | BB1 1YL |
| Bristol Close | BB1 1BA |
| Brunel Drive | BB1 1BD |
| Brunel Walk | BB1 1HN |
| Burnley Close | BB1 3HL |
| Buttermere Close | BB1 5LL |
| Cambridge Close | BB1 1DY |
| Cambridge Street | BB1 1ES |
| Cherry Close | BB1 1NP |
| Cherry Street | BB1 1NR BB1 1NT |
| Chester Street | BB1 1BQ BB1 1DR BB1 1LP |
| Chestnut Walk | BB1 1UP |
| Cloverfields | BB1 5HJ |
| Copy Nook | BB1 3AN |
| Crabtree Street | BB1 3HD |
| Cranwell Close | BB1 1DT |
| Croston Close | BB1 1UW |
| Cumberland Street | BB1 1JP |
| Daisy Street | BB1 5EW |
| Dartford Close | BB1 1DU |
| Derby Street | BB1 5HR |
| Didsbury Street | BB1 3JL |
| Dundee Drive | BB1 1LR |
| Durham Close | BB1 1DQ |
| Eastwood Street | BB1 5JN |
| Eden Street | BB1 3AR |
| Emily Street | BB1 5HX |
| Ferndale | BB1 5HH |
| Florence Street | BB1 5JP |
| Frederick Row | BB1 1NS |
| Gate Street | BB1 3AQ |
| Higher Audley Street | BB1 1DH BB1 1JB |
| Higher Barn Street | BB1 1JA |
| Higher Eanam | BB1 3AZ |
| Hozier Street | BB1 3JP BB1 3JW |
| July Street | BB1 1SR |
| June Street | BB1 1SS |
| Keele Walk | BB1 1EH |
| Kenyon Street | BB1 3EY |
| Lambeth Street | BB1 1SL BB1 1SN |
| Leeds Close | BB1 1EJ |
| Lincoln Close | BB1 1NY |
| Lincoln Road | BB1 1TP |
| Longton Close | BB1 1UN |
| Longton Street | BB1 1UF |
| May Street | BB1 1ST |
| Mossbank | BB1 5HL |
| Mossdale | BB1 5HN |
| Mulberry Street | BB1 1UQ |
| Mulberry Walk | BB1 1UH |
| Newton Street | BB1 1NE |
| North Road | BB1 1PR |
| Nottingham Street | BB1 1SP |
| Ordnance Street | BB1 3AE |
| Oxford Close | BB1 1DL |
| Pelham Street | BB1 5LA |
| Peter Street | BB1 5HQ |
| Poole Street | BB1 3JS |
| Pringle Street | BB1 1SF |
| Queens Park Road | BB1 1RF |
| Reading Close | BB1 1EL |
| Ripon Street | BB1 1SW BB1 1TW |
| Rose Hill Avenue | BB1 1YF BB1 1YW |
| Shakeshaft Street | BB1 1JT |
| St Clement Close | BB1 1NX |
| St Clement Street | BB1 1NW |
| St Thomas Street | BB1 1PB |
| Stirling Drive | BB1 1DN |
| Strathclyde Road | BB1 1HP BB1 1HS |
| Sussex Drive | BB1 1BJ BB1 1EN |
| Sussex Walk | BB1 1DZ |
| Temple Drive | BB1 1NL |
| Thirlmere Close | BB1 5LS |
| Thorn Hill Close | BB1 1YG |
| Ullswater Close | BB1 5LT |
| Walter Street | BB1 1SU BB1 1TJ |
| Westwood Court | BB1 5JA |
| Windermere Close | BB1 5LR |
| Winmarleigh Street | BB1 1UG |
| Winmarleigh Walk | BB1 1UL |
| Woodlands Close | BB1 1RA |
Transport near Audley
-
Blackburn Station
-
Mill Hill (Lancashire) Station
-
Rishton Station
-
Ramsgreave and Wilpshire Station
-
Cherry Tree Station
- FAQ
- Price Paid By Year
- Property Type Price
Frequently asked questions about Audley
What is the average price for a property for sale in Audley?
The average price for a property for sale in Audley is £112,924. This amount is 31% lower than the average price in Blackburn. There are 466 property listings for sale in Audley.
What streets have the most expensive properties for sale in Audley?
The streets with the most expensive properties for sale in Audley are Cambridge Close at an average of £300,000, Beechwood Road at an average of £200,000 and Winmarleigh Walk at an average of £170,000.
What streets have the most affordable properties for sale in Audley?
The streets with the most affordable properties for sale in Audley are Brunel Drive at an average of £60,000, Hozier Street at an average of £70,000 and Ambleside Close at an average of £85,000.
Which train stations are available in or near Audley?
Some of the train stations available in or near Audley are Blackburn, Mill Hill (Lancashire) and Rishton.
Property Price Paid in Audley by Year
The average sold property price by year was:
| Year | Average Sold Price | Price Change |
Sold Properties
|
|---|---|---|---|
| 2025 | £119,739 | 5% |
23 Properties |
| 2024 | £113,615 | 6% |
39 Properties |
| 2023 | £106,591 | -5% |
29 Properties |
| 2022 | £111,816 | 15% |
40 Properties |
| 2021 | £94,750 | 5% |
38 Properties |
| 2020 | £89,744 | 3% |
32 Properties |
| 2019 | £87,445 | 4% |
46 Properties |
| 2018 | £84,373 | 6% |
42 Properties |
| 2017 | £78,961 | 6% |
34 Properties |
| 2016 | £74,603 | -3% |
37 Properties |
| 2015 | £77,122 | 12% |
36 Properties |
| 2014 | £67,842 | -19% |
38 Properties |
| 2013 | £80,916 | 6% |
39 Properties |
| 2012 | £75,887 | -9% |
29 Properties |
| 2011 | £82,661 | 4% |
39 Properties |
| 2010 | £79,683 | -2% |
58 Properties |
| 2009 | £81,177 | -16% |
45 Properties |
| 2008 | £94,306 | 9% |
56 Properties |
| 2007 | £86,267 | 6% |
87 Properties |
| 2006 | £81,149 | 15% |
110 Properties |
| 2005 | £68,935 | 28% |
87 Properties |
| 2004 | £49,891 | 29% |
92 Properties |
| 2003 | £35,200 | 24% |
103 Properties |
| 2002 | £26,708 | 11% |
101 Properties |
| 2001 | £23,655 | -9% |
81 Properties |
| 2000 | £25,775 | -2% |
83 Properties |
| 1999 | £26,283 | 18% |
80 Properties |
| 1998 | £21,567 | -10% |
98 Properties |
| 1997 | £23,688 | 0,3% |
75 Properties |
| 1996 | £23,617 | -1% |
69 Properties |
| 1995 | £23,788 | - |
80 Properties |
Property Price per Property Type in Audley
Here you can find historic sold price data in order to help with your property search.
The average Property Paid Price for specific property types in the last three years are:
| Property Type | Average Sold Price | Sold Properties |
|---|---|---|
| Semi Detached House | £129,941.00 | 17 Semi Detached Houses |
| Terraced House | £111,087.00 | 70 Terraced Houses |
| Flat | £72,750.00 | 4 Flats |

