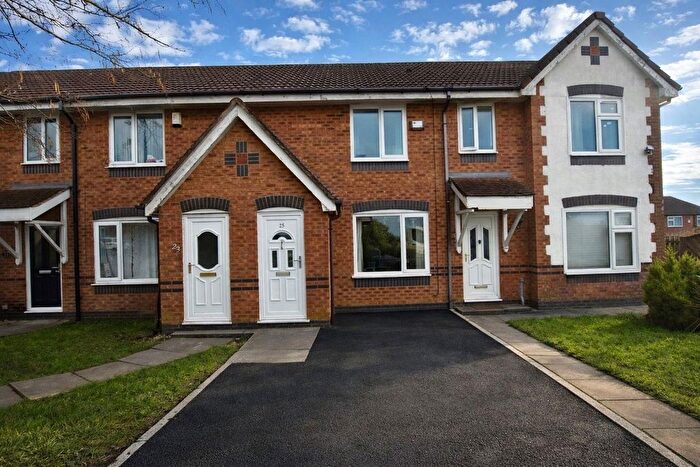
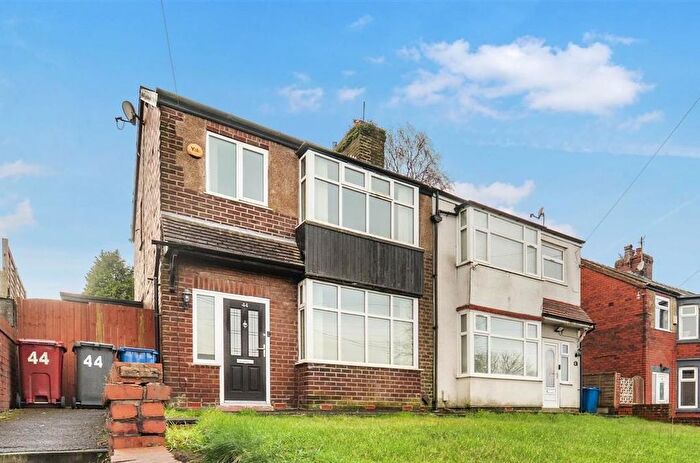
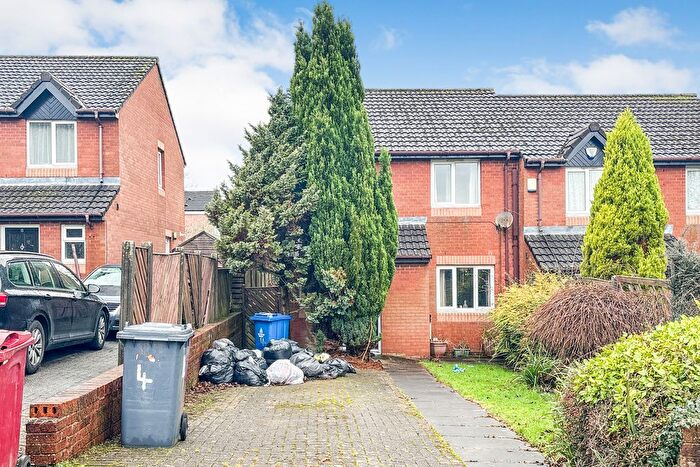
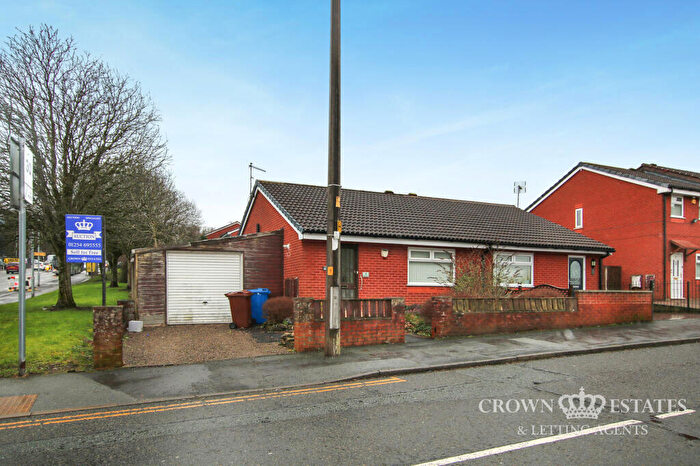
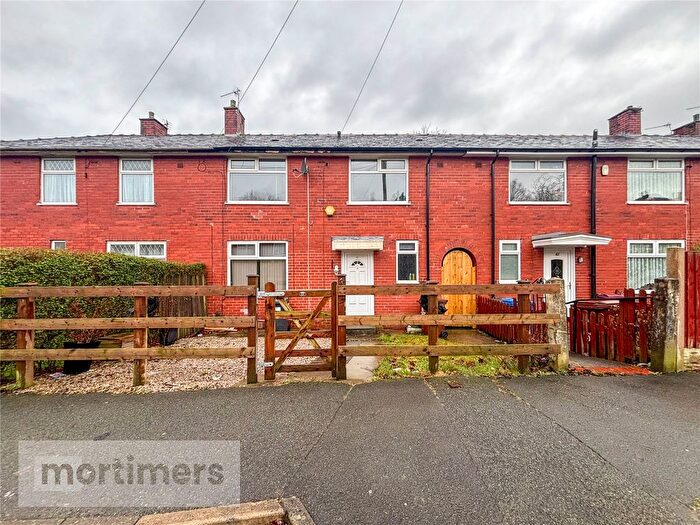
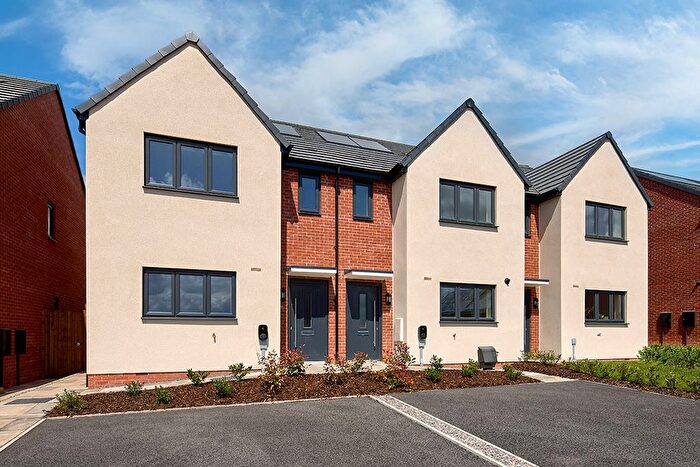
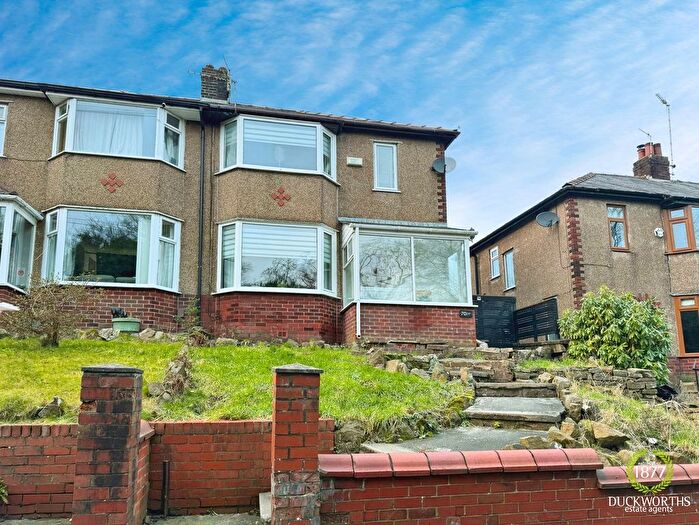
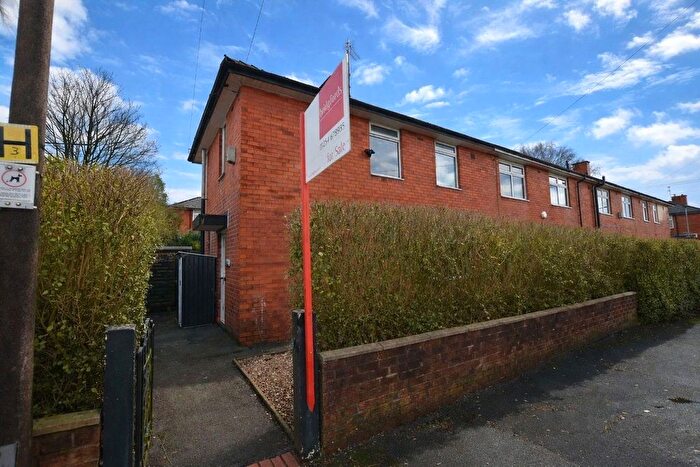
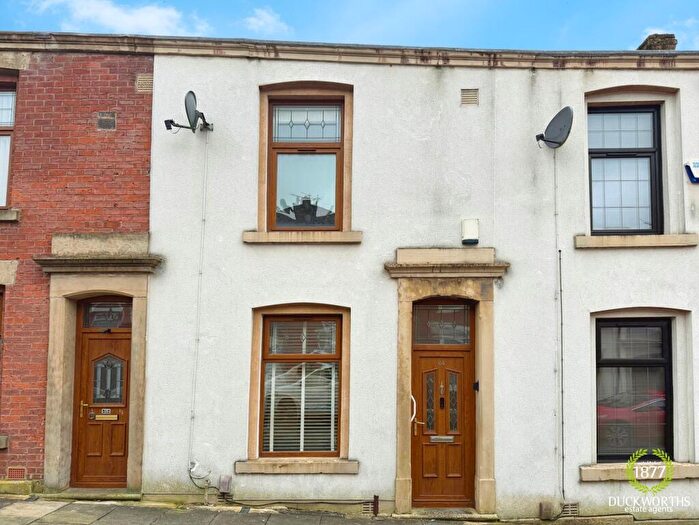
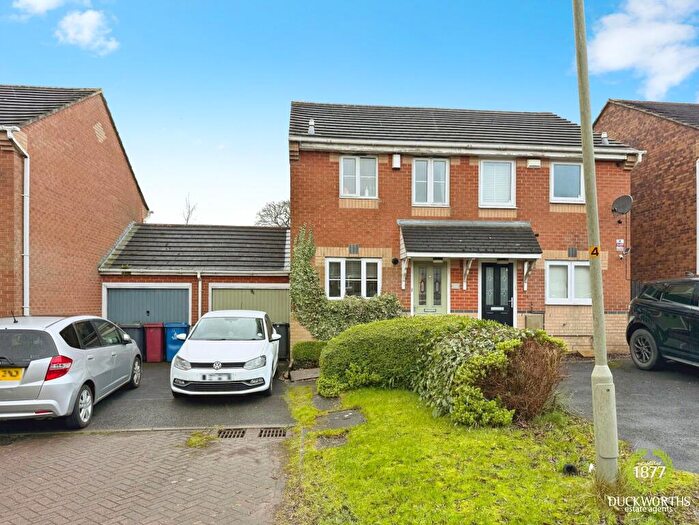
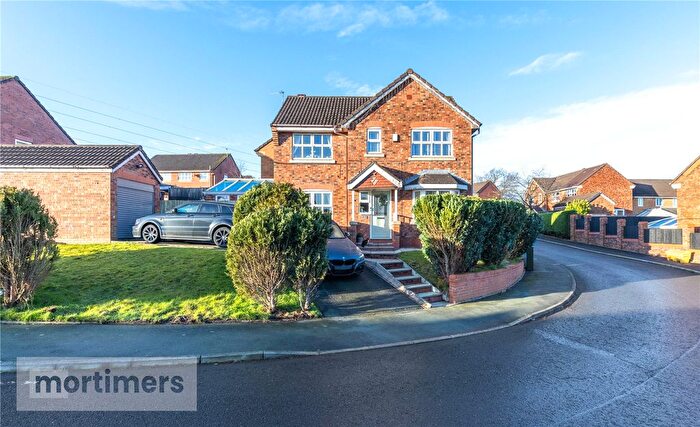
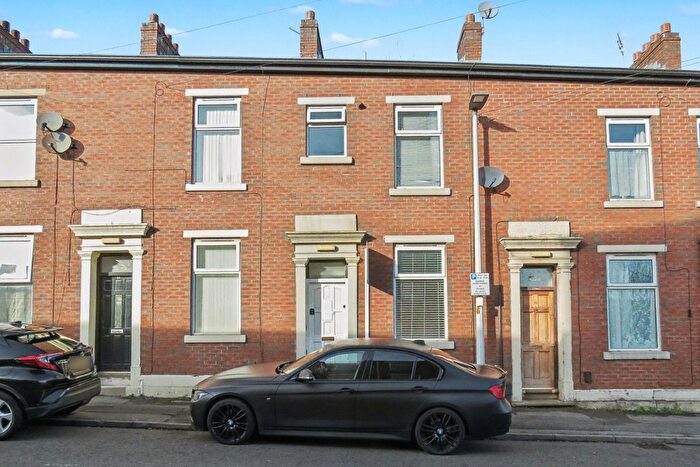
Houses for sale & to rent in Queens Park, Blackburn
House Prices in Queens Park
Properties in Queens Park have an average house price of £131,186.00 and had 126 Property Transactions within the last 3 years¹.
Queens Park is an area in Blackburn, Blackburn with Darwen with 2,054 households², where the most expensive property was sold for £338,350.00.
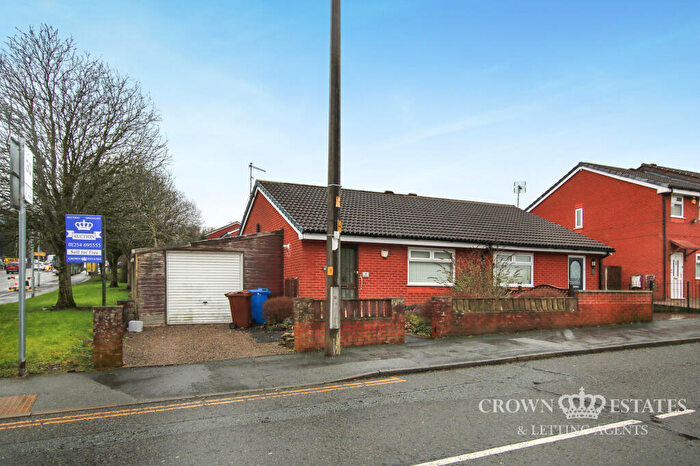
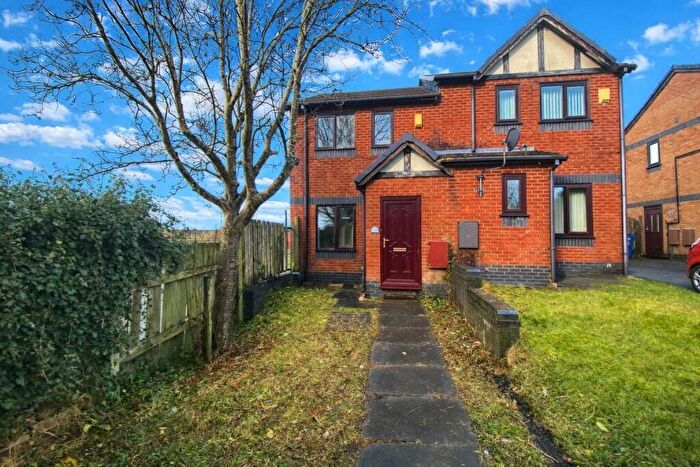
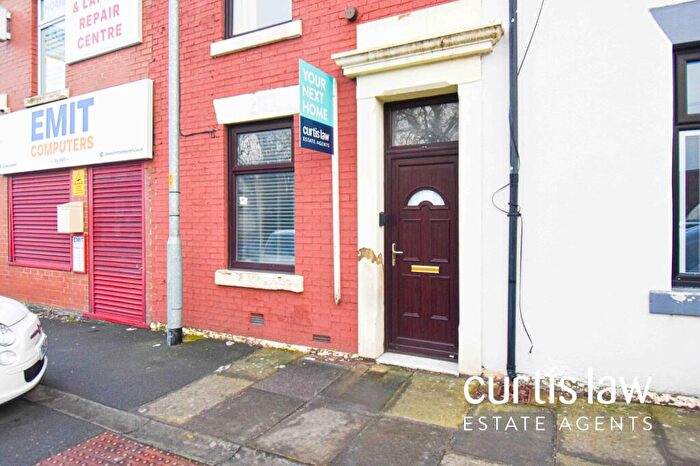
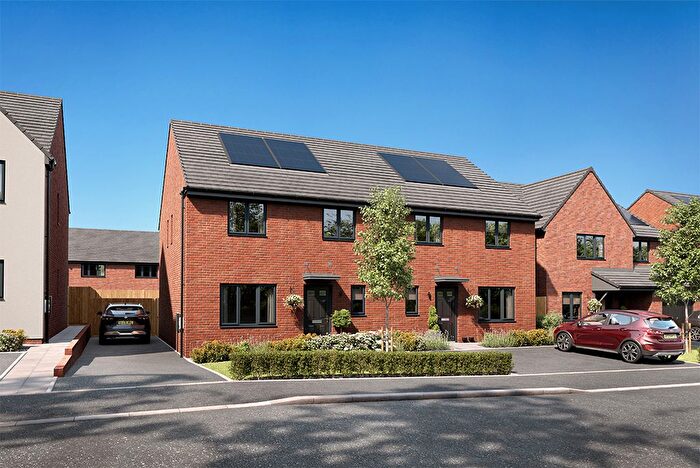
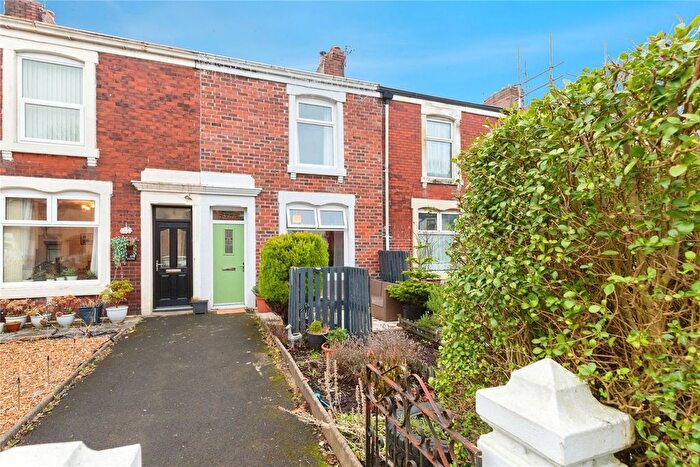
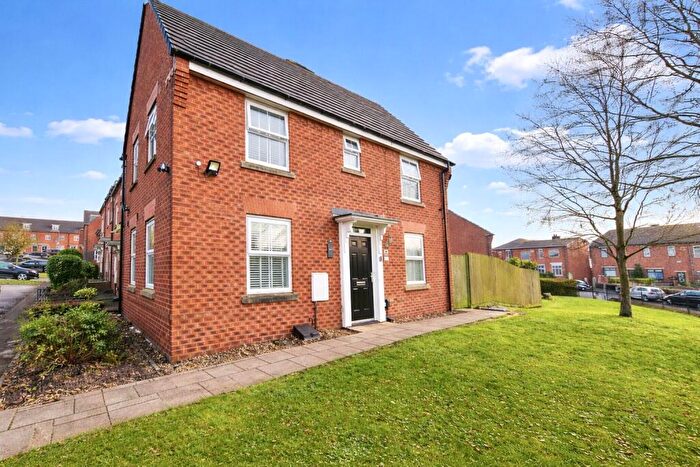
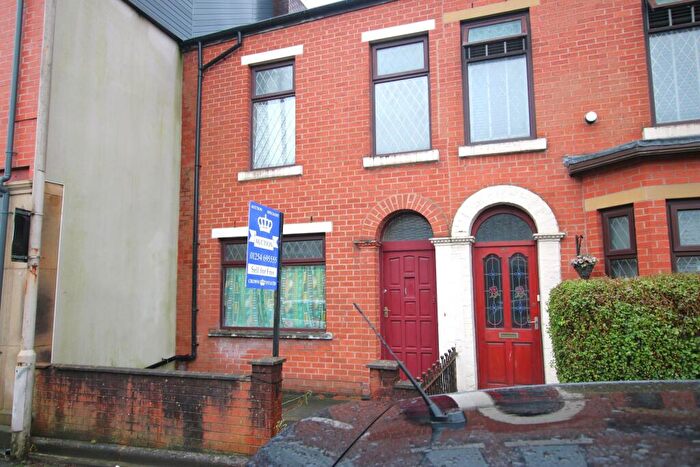
Properties for sale in Queens Park
Roads and Postcodes in Queens Park
Navigate through our locations to find the location of your next house in Queens Park, Blackburn for sale or to rent.
| Streets | Postcodes |
|---|---|
| Anchor House | BB1 1BZ |
| Audley Range | BB1 1TD BB1 1TF |
| Balmoral Close | BB2 3AP |
| Bargee Close | BB1 1BW |
| Barn Gill Close | BB2 3HU |
| Beale Close | BB1 2RD |
| Bennington Street | BB2 3HP |
| Besant Close | BB1 2RG |
| Blackamoor Road | BB1 2LL |
| Bolton Road | BB2 3PZ BB2 3QJ |
| Canalside | BB1 1BH BB1 1BX |
| Cavell Close | BB1 2RF |
| Chester Close | BB1 1RE |
| Clippers Quay | BB1 1EB |
| Copperfield Street | BB1 1RB |
| Copster Hill Close | BB1 2JX |
| Croasdale Square | BB1 1SY |
| Cromwell Street | BB1 1RL |
| Crossfield Street | BB2 3AL |
| Derham Street | BB2 3SZ |
| Dickens Street | BB1 1RN |
| Dorchester Close | BB1 1SJ |
| Edith Street | BB1 1RQ |
| Frederick Street | BB2 3BE |
| Grimshaw Park | BB2 3AG |
| Hareclough Close | BB2 3HT |
| Hareden Brook Close | BB2 3HX |
| Harrow Drive | BB1 1SQ |
| Haslingden Road | BB1 2ND BB1 2NF BB1 2NG BB2 3HJ BB2 3HQ BB2 3HW |
| Highfield Gardens | BB2 3SN |
| Highfield Road | BB2 3AX BB2 3SL |
| Hurstwood Court | BB1 2QU |
| Kent Street | BB1 1DE |
| Lambeth Street | BB1 1SG |
| Langden Brook Square | BB1 1TA |
| Lincoln Road | BB1 1TS |
| Merchants Landing | BB1 1BU |
| Merchants Quay | BB1 1BS BB1 1ED BB1 1EQ |
| Mosley Street | BB2 3ST |
| Navigation Way | BB1 1EF BB1 1ER |
| Nightingale Close | BB1 2RE |
| Pankhurst Close | BB1 2RB |
| Pendle Drive | BB2 3DT |
| Pringle Street | BB1 1SA BB1 1SB BB1 1SD BB1 1TR |
| Procter Street | BB2 3BG |
| Queens Park Road | BB1 1SE |
| Queens Road | BB1 1QF BB1 1QG BB1 1QR |
| Randolph Street | BB1 1RH |
| Rimington Close | BB2 3DR |
| Robert Street | BB2 3BB |
| Rockcliffe Street | BB2 3AR |
| Rose Street | BB2 3SS |
| School Lane | BB1 2LW |
| Seacole Close | BB1 2RA |
| Sherwood Road | BB1 1TU |
| Skelshaw Close | BB1 1SZ |
| Spinning Avenue | BB1 2QF |
| St Annes Close | BB2 3AQ |
| St Frances Close | BB1 1TB |
| St Marys Wharfe | BB2 3AF |
| Swan Street | BB2 3SR |
| Walter Street | BB1 1RD BB1 1SX |
| Waterfront | BB1 1EE |
| Watersedge | BB1 1BT |
| Whitendale Crescent | BB1 1RU BB1 1RX BB1 1RY BB1 1RZ |
| Winchester Street | BB1 1RG |
| Windsor Close | BB1 1SH |
| Woodlea Road | BB1 1TT |
| York Street | BB2 3BD |
Transport near Queens Park
-
Blackburn Station
-
Mill Hill (Lancashire) Station
-
Cherry Tree Station
-
Rishton Station
-
Ramsgreave and Wilpshire Station
-
Darwen Station
- FAQ
- Price Paid By Year
- Property Type Price
Frequently asked questions about Queens Park
What is the average price for a property for sale in Queens Park?
The average price for a property for sale in Queens Park is £131,186. This amount is 20% lower than the average price in Blackburn. There are 2,519 property listings for sale in Queens Park.
What streets have the most expensive properties for sale in Queens Park?
The streets with the most expensive properties for sale in Queens Park are Watersedge at an average of £225,000, Spinning Avenue at an average of £219,250 and Copster Hill Close at an average of £207,666.
What streets have the most affordable properties for sale in Queens Park?
The streets with the most affordable properties for sale in Queens Park are Merchants Quay at an average of £61,000, Walter Street at an average of £66,000 and Waterfront at an average of £70,000.
Which train stations are available in or near Queens Park?
Some of the train stations available in or near Queens Park are Blackburn, Mill Hill (Lancashire) and Cherry Tree.
Property Price Paid in Queens Park by Year
The average sold property price by year was:
| Year | Average Sold Price | Price Change |
Sold Properties
|
|---|---|---|---|
| 2025 | £122,623 | -7% |
30 Properties |
| 2024 | £131,750 | -3% |
47 Properties |
| 2023 | £135,888 | 5% |
49 Properties |
| 2022 | £129,502 | 2% |
51 Properties |
| 2021 | £127,076 | 8% |
74 Properties |
| 2020 | £117,269 | 6% |
39 Properties |
| 2019 | £110,743 | -6% |
75 Properties |
| 2018 | £117,410 | 19% |
51 Properties |
| 2017 | £94,987 | 3% |
65 Properties |
| 2016 | £91,866 | -6% |
50 Properties |
| 2015 | £97,362 | 5% |
41 Properties |
| 2014 | £92,819 | 3% |
46 Properties |
| 2013 | £90,209 | 0,2% |
47 Properties |
| 2012 | £90,067 | -10% |
37 Properties |
| 2011 | £98,982 | -6% |
47 Properties |
| 2010 | £104,429 | -6% |
70 Properties |
| 2009 | £110,926 | 16% |
62 Properties |
| 2008 | £93,081 | -13% |
55 Properties |
| 2007 | £104,729 | 12% |
118 Properties |
| 2006 | £92,625 | 7% |
137 Properties |
| 2005 | £85,977 | -5% |
120 Properties |
| 2004 | £90,311 | 20% |
149 Properties |
| 2003 | £72,531 | 29% |
153 Properties |
| 2002 | £51,443 | 19% |
121 Properties |
| 2001 | £41,845 | 20% |
114 Properties |
| 2000 | £33,359 | 18% |
104 Properties |
| 1999 | £27,437 | -4% |
70 Properties |
| 1998 | £28,499 | -30% |
77 Properties |
| 1997 | £37,149 | 21% |
104 Properties |
| 1996 | £29,248 | -8% |
107 Properties |
| 1995 | £31,445 | - |
98 Properties |
Property Price per Property Type in Queens Park
Here you can find historic sold price data in order to help with your property search.
The average Property Paid Price for specific property types in the last three years are:
| Property Type | Average Sold Price | Sold Properties |
|---|---|---|
| Semi Detached House | £140,684.00 | 23 Semi Detached Houses |
| Detached House | £224,050.00 | 17 Detached Houses |
| Terraced House | £117,778.00 | 67 Terraced Houses |
| Flat | £83,881.00 | 19 Flats |

