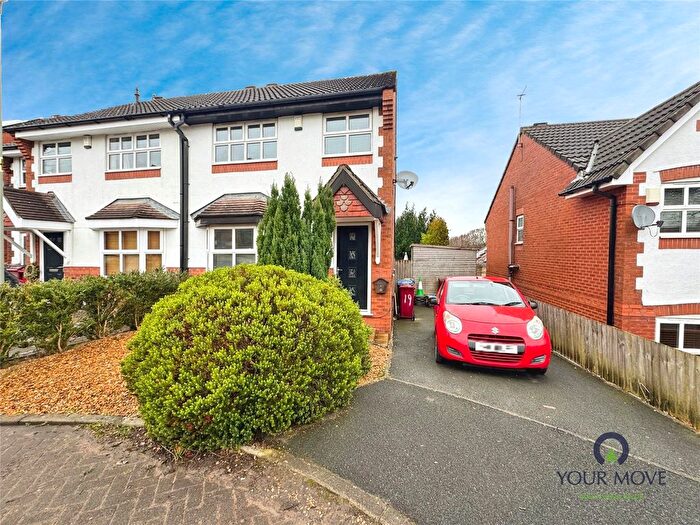
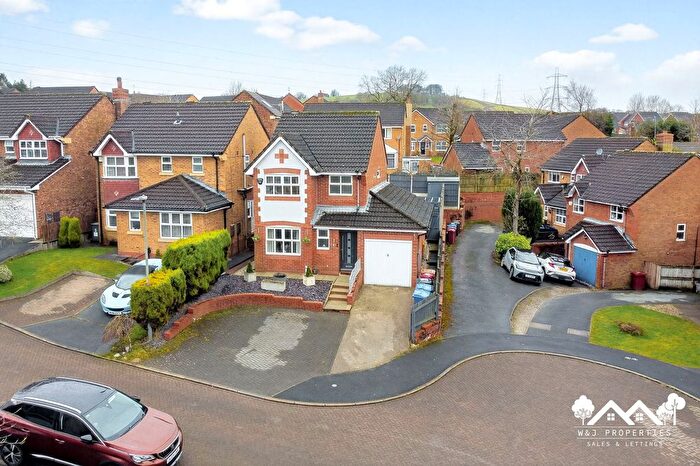
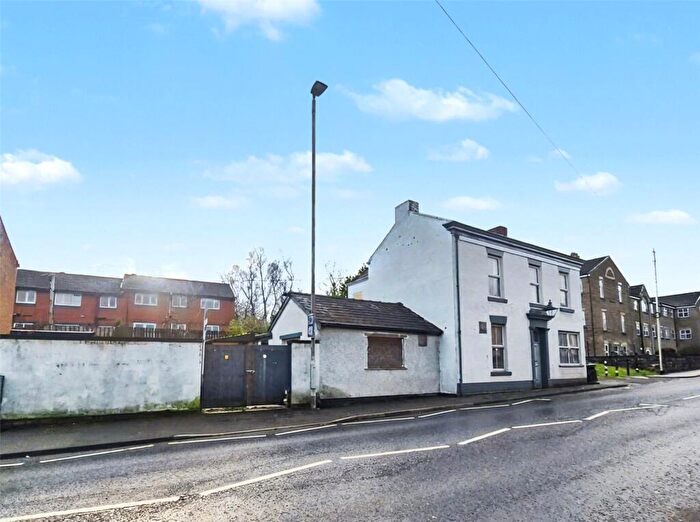
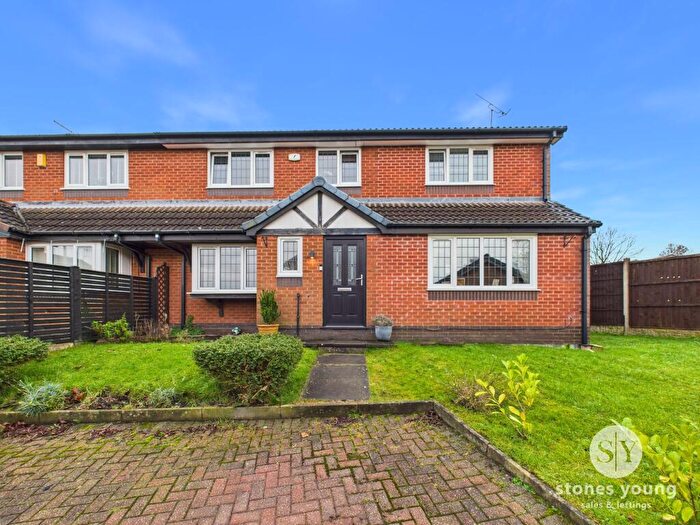
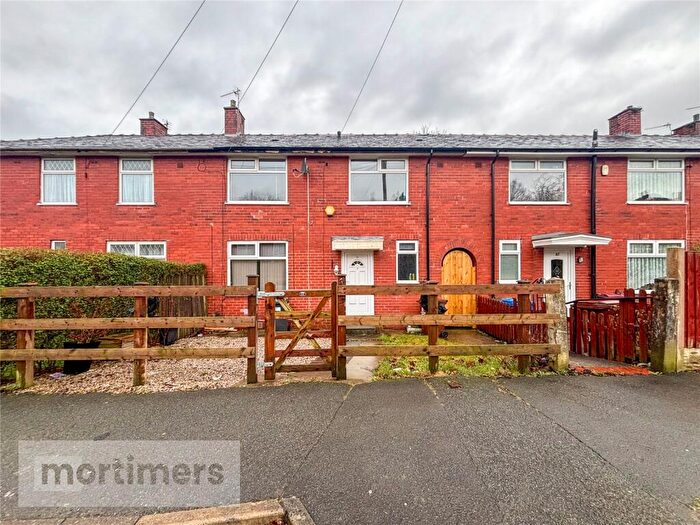
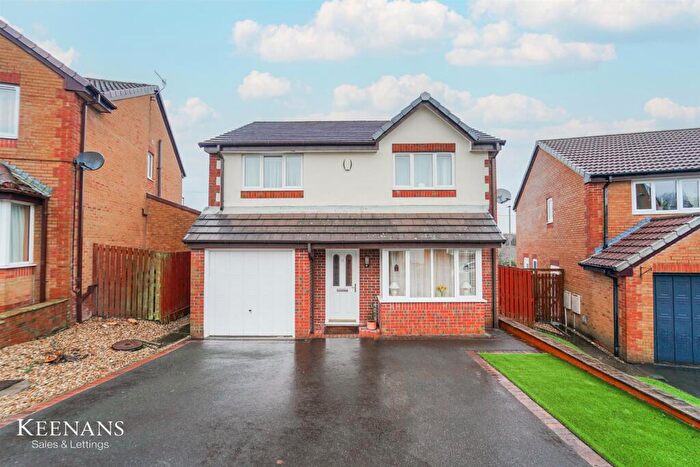
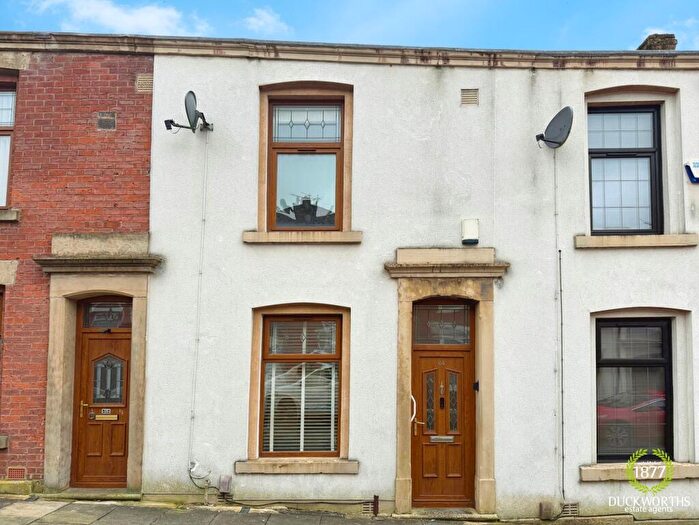
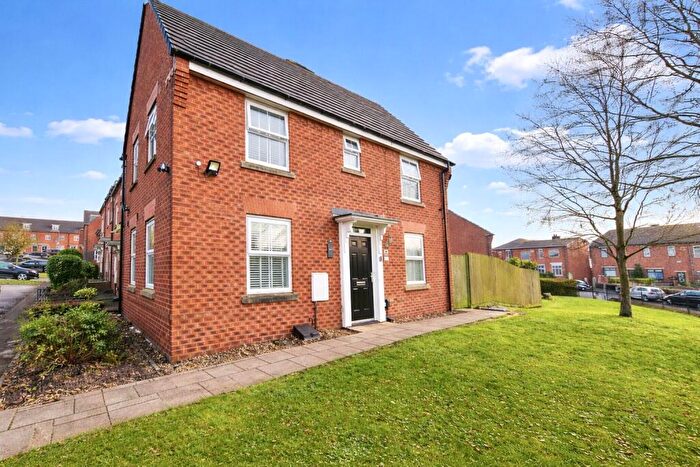
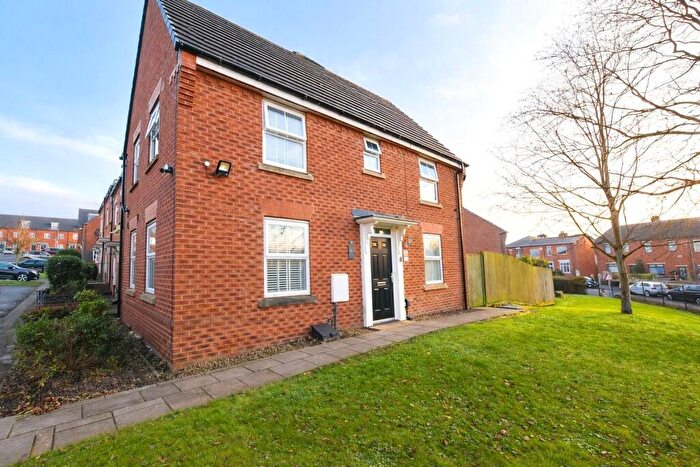
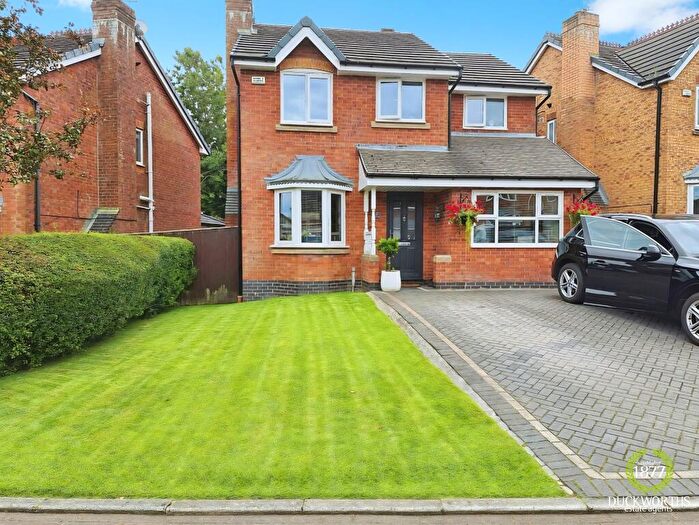
Houses for sale & to rent in Fernhurst, Blackburn
House Prices in Fernhurst
Properties in Fernhurst have an average house price of £214,768.00 and had 135 Property Transactions within the last 3 years¹.
Fernhurst is an area in Blackburn, Blackburn with Darwen with 1,217 households², where the most expensive property was sold for £465,000.00.
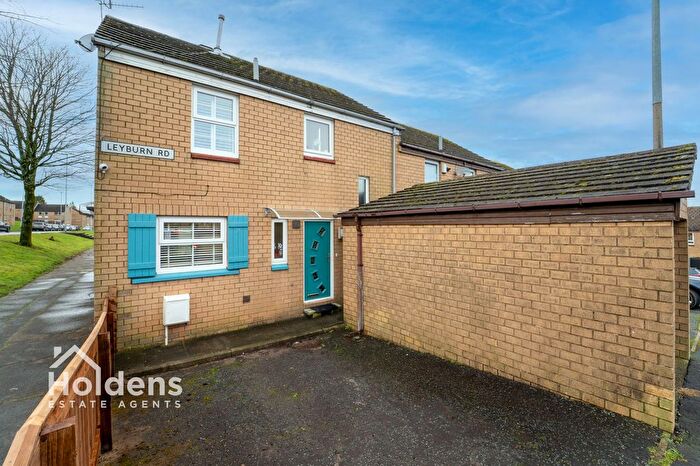
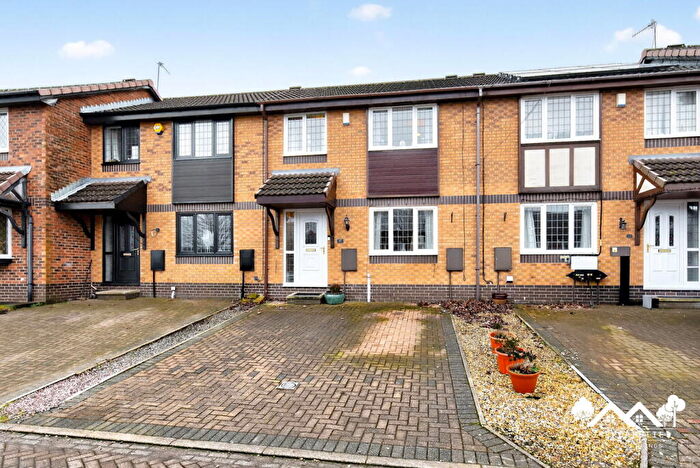
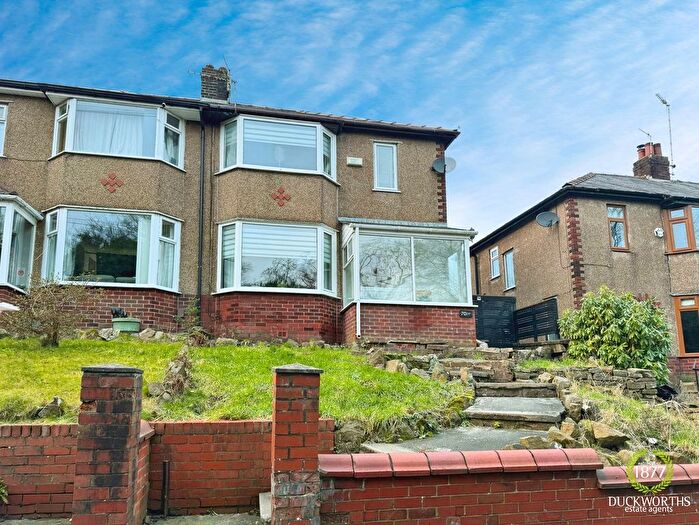
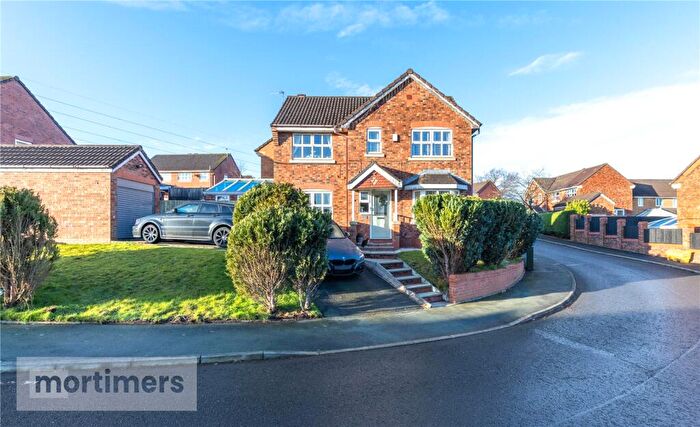
Properties for sale in Fernhurst
Roads and Postcodes in Fernhurst
Navigate through our locations to find the location of your next house in Fernhurst, Blackburn for sale or to rent.
| Streets | Postcodes |
|---|---|
| Arbour Drive | BB2 4LF |
| Ashwood Avenue | BB2 4JD |
| Bailey Close | BB2 4FT |
| Bank Hey View | BB2 4NA |
| Beamish Avenue | BB2 4FP |
| Bolton Road | BB2 4JT BB2 4LA |
| Branch Road | BB2 4JZ |
| Brotherston Drive | BB2 4FJ |
| Campbell Close | BB2 4GR |
| Clayton Way | BB2 4FZ |
| Cravens Avenue | BB2 4LB |
| Cravens Heath | BB2 4JB |
| Cravens Hollow | BB2 4LH |
| Dale View | BB2 4LE |
| Dalglish Drive | BB2 4FU |
| Douglas Close | BB2 4FF |
| Eckersley Close | BB2 4FA |
| Edmund Street | BB2 4JX |
| England Avenue | BB2 4FD |
| Fazackerley Close | BB2 4FG |
| Ferguson Street | BB2 4JY |
| Fernhurst Barn | BB2 4DU |
| Finsbury Place | BB2 4JS |
| Flowers Close | BB2 4FW |
| Forrestside | BB2 4UP |
| Garner Avenue | BB2 4FY |
| Greenfields | BB2 4UN |
| Heatherleigh Gardens | BB2 4SX |
| Hendry Lane | BB2 4FE |
| Heyworth Avenue | BB2 4SB |
| Keeley Close | BB2 4FN |
| Kendall Close | BB2 4FB |
| Langton Close | BB2 4FL |
| Lea Drive | BB2 4HQ |
| Meadow Vale | BB2 4UA |
| Meadowfields | BB2 4JH |
| Metcalfe Close | BB2 4FQ |
| Moorland Road | BB2 4SA |
| Oakfield Road | BB2 4JU |
| Oakmere Close | BB2 4TN |
| Old Farmside | BB2 4UL |
| Orchard Close | BB2 4TL |
| Parkdale Gardens | BB2 4SU |
| Parkes Way | BB2 4FH |
| Rye Gardens | BB2 4HF |
| Speedie Close | BB2 4FR |
| Taylor Avenue | BB2 4GS |
| The Dell | BB2 4SG |
| The Glade | BB2 4HH |
| The Glen | BB2 4HN |
| The Greenwood | BB2 4UR |
| The Shires | BB2 4SF |
| Thorneylea | BB2 4UQ |
| Wagstaff Close | BB2 4FS |
| Water Meadows | BB2 4UJ |
| Whelan Close | BB2 4FX |
Transport near Fernhurst
-
Mill Hill (Lancashire) Station
-
Cherry Tree Station
-
Blackburn Station
-
Darwen Station
-
Pleasington Station
- FAQ
- Price Paid By Year
- Property Type Price
Frequently asked questions about Fernhurst
What is the average price for a property for sale in Fernhurst?
The average price for a property for sale in Fernhurst is £214,768. This amount is 30% higher than the average price in Blackburn. There are 967 property listings for sale in Fernhurst.
What streets have the most expensive properties for sale in Fernhurst?
The streets with the most expensive properties for sale in Fernhurst are Eckersley Close at an average of £395,000, Fernhurst Barn at an average of £340,000 and Douglas Close at an average of £328,500.
What streets have the most affordable properties for sale in Fernhurst?
The streets with the most affordable properties for sale in Fernhurst are Edmund Street at an average of £110,500, Branch Road at an average of £111,425 and Finsbury Place at an average of £128,000.
Which train stations are available in or near Fernhurst?
Some of the train stations available in or near Fernhurst are Mill Hill (Lancashire), Cherry Tree and Blackburn.
Property Price Paid in Fernhurst by Year
The average sold property price by year was:
| Year | Average Sold Price | Price Change |
Sold Properties
|
|---|---|---|---|
| 2025 | £220,777 | 1% |
53 Properties |
| 2024 | £217,537 | 6% |
42 Properties |
| 2023 | £203,900 | 9% |
40 Properties |
| 2022 | £184,547 | -1% |
32 Properties |
| 2021 | £185,999 | 3% |
65 Properties |
| 2020 | £180,870 | 4% |
44 Properties |
| 2019 | £174,273 | 7% |
60 Properties |
| 2018 | £162,086 | -1% |
55 Properties |
| 2017 | £163,371 | 9% |
59 Properties |
| 2016 | £149,466 | -2% |
59 Properties |
| 2015 | £152,504 | -5% |
55 Properties |
| 2014 | £159,398 | 8% |
47 Properties |
| 2013 | £147,210 | -6% |
57 Properties |
| 2012 | £155,750 | 4% |
39 Properties |
| 2011 | £149,047 | -4% |
45 Properties |
| 2010 | £154,821 | -1% |
47 Properties |
| 2009 | £155,848 | -2% |
44 Properties |
| 2008 | £159,370 | -4% |
41 Properties |
| 2007 | £166,325 | -1% |
89 Properties |
| 2006 | £168,713 | 15% |
142 Properties |
| 2005 | £144,156 | 8% |
121 Properties |
| 2004 | £133,293 | 17% |
168 Properties |
| 2003 | £110,242 | 15% |
172 Properties |
| 2002 | £94,200 | 7% |
199 Properties |
| 2001 | £87,192 | 11% |
154 Properties |
| 2000 | £77,328 | 8% |
164 Properties |
| 1999 | £71,057 | -2% |
98 Properties |
| 1998 | £72,553 | 3% |
110 Properties |
| 1997 | £70,102 | 18% |
91 Properties |
| 1996 | £57,286 | 10% |
25 Properties |
| 1995 | £51,528 | - |
22 Properties |
Property Price per Property Type in Fernhurst
Here you can find historic sold price data in order to help with your property search.
The average Property Paid Price for specific property types in the last three years are:
| Property Type | Average Sold Price | Sold Properties |
|---|---|---|
| Semi Detached House | £191,568.00 | 29 Semi Detached Houses |
| Detached House | £260,136.00 | 77 Detached Houses |
| Terraced House | £117,508.00 | 29 Terraced Houses |

