
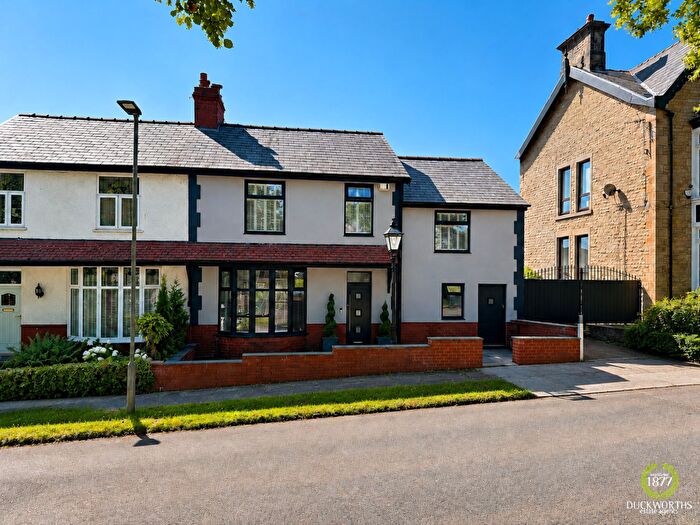
Houses for sale in Fernhurst, Darwen
House Prices in Fernhurst
Properties in Fernhurst have an average house price of £196k and had 128 Property Transactions within the last 3 years¹.
Fernhurst is an area in Darwen, Blackburn with Darwen with 956 households², where the most expensive property was sold for £560k.
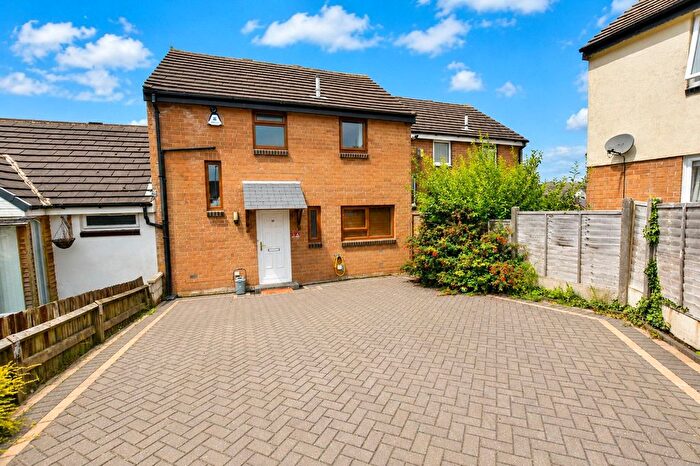
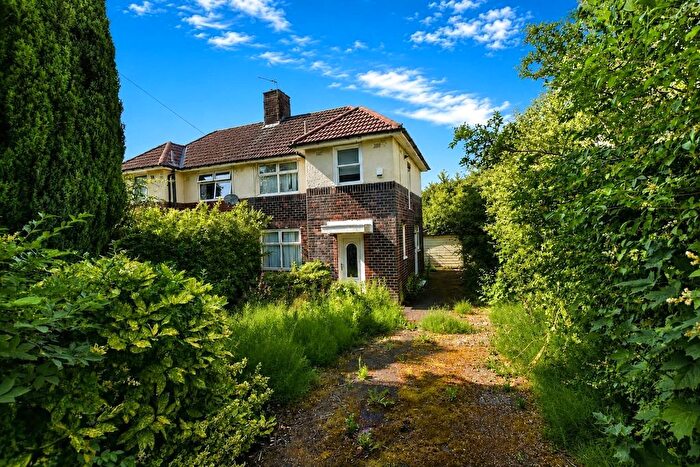
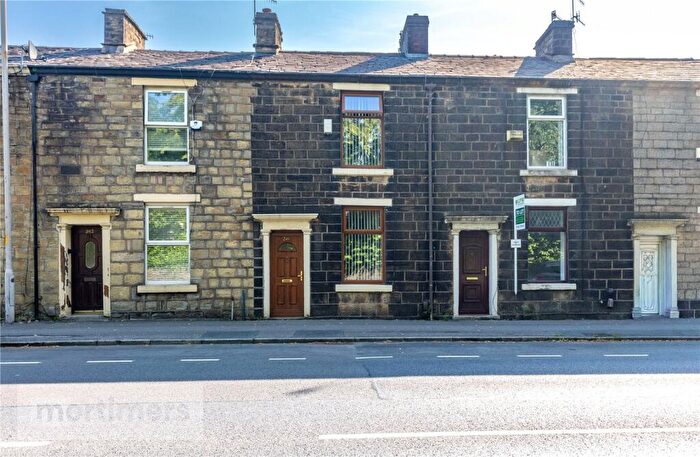
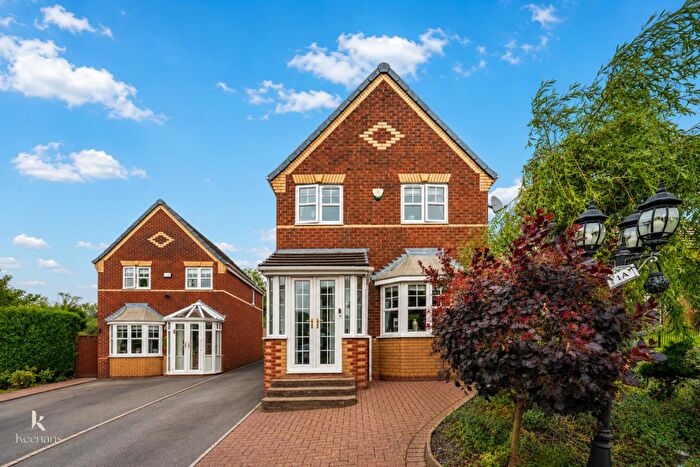
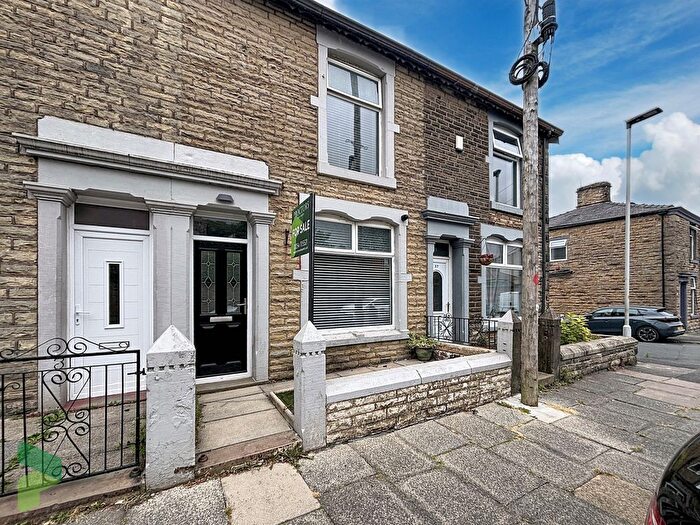
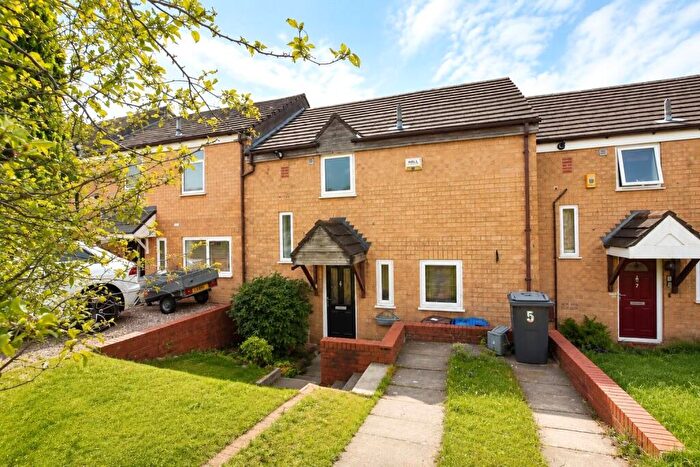
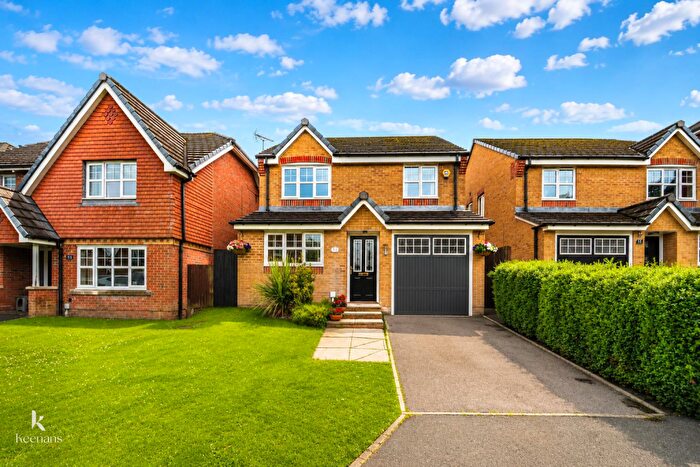
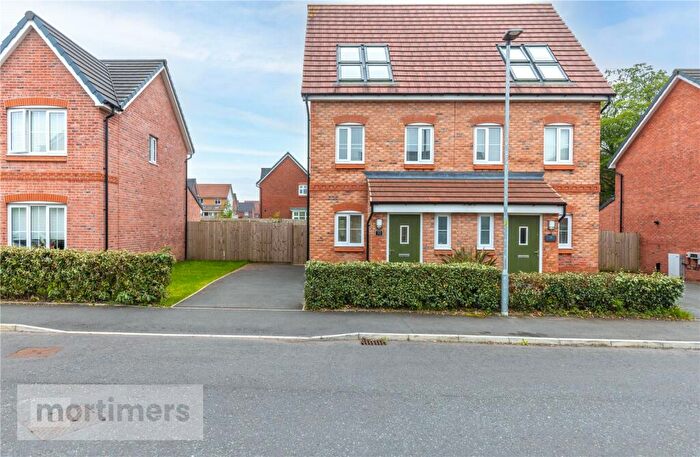
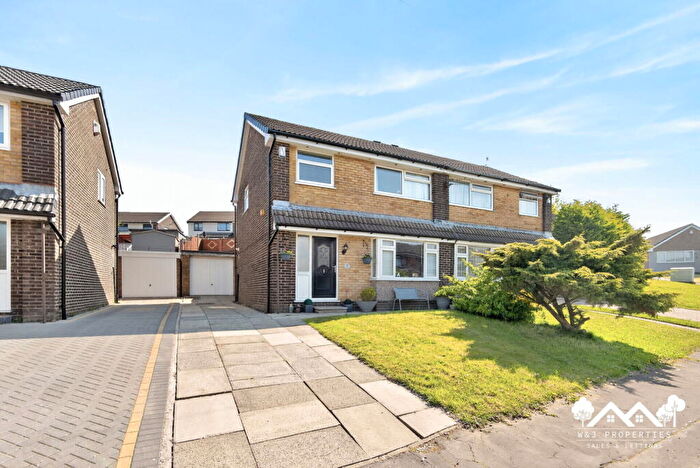
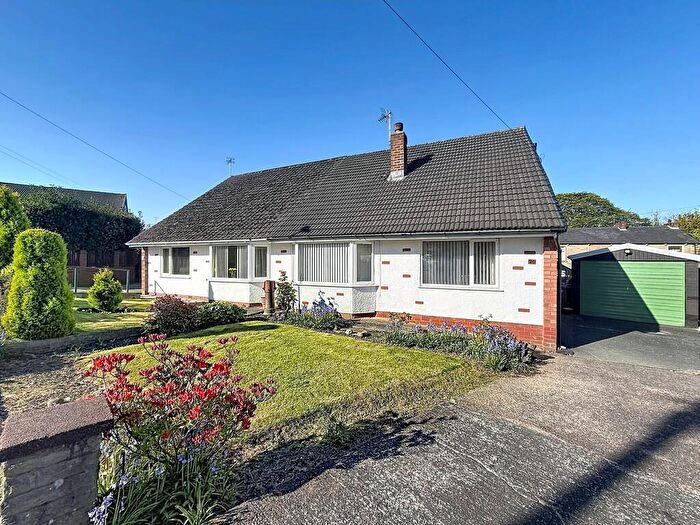
Properties for sale in Fernhurst
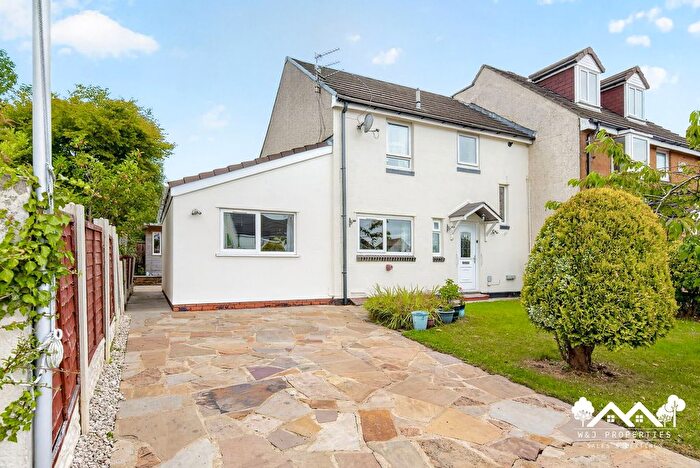
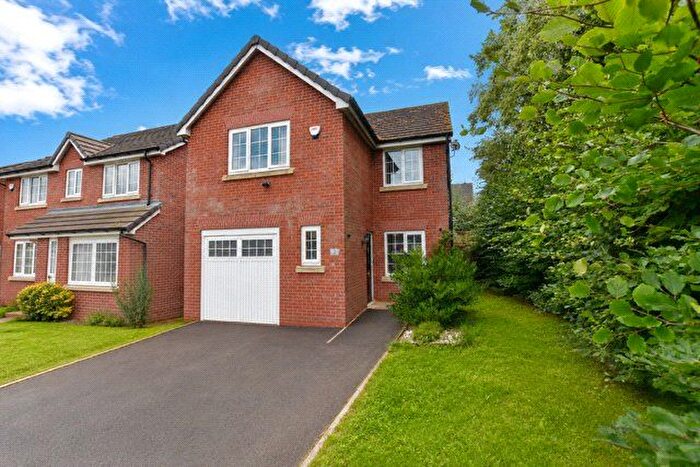
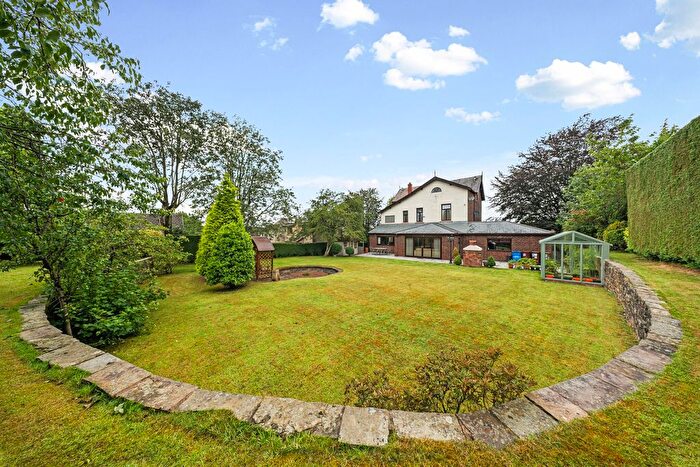

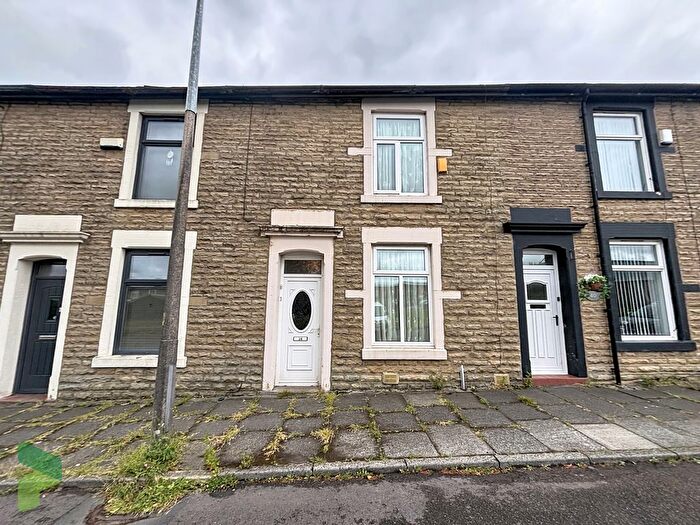
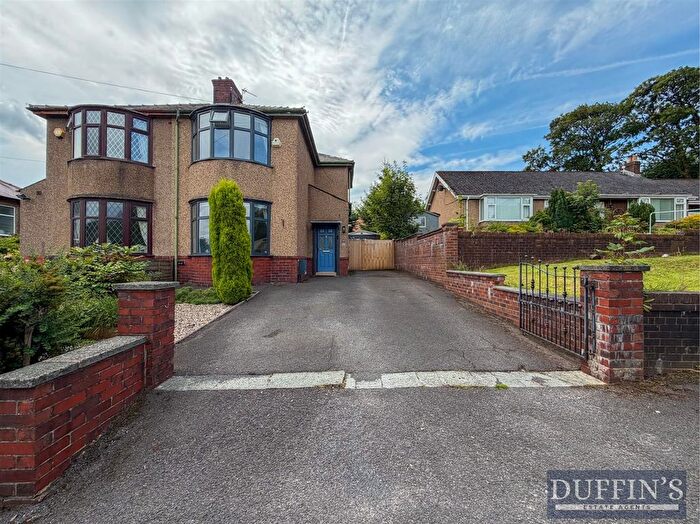
![]()
If you are looking to sell your house, let it out, or receive a property valuation, an expert can help you.
Click the button below to get started.


Roads and Postcodes in Fernhurst
Navigate through our locations to find the location of your next house in Fernhurst, Darwen for sale or to rent.
| Streets | Postcodes |
|---|---|
| Albert Place | BB3 0QE |
| Antigua Drive | BB3 0SF |
| Barons Close | BB3 0RQ |
| Barons Way | BB3 0RG |
| Beech Grove | BB3 0AP |
| Bog Height Road | BB3 0AW BB3 0LF BB3 0LG |
| Branch Road | BB3 0PQ |
| Briarcroft | BB3 0RT |
| Countess Road | BB3 0RE |
| Cross Street | BB3 0PW |
| Dominica Avenue | BB3 0SG |
| Dover Street | BB3 0QA |
| Duchess Street | BB3 0QQ |
| Empress Street | BB3 0QG |
| Farfield Drive | BB3 0RJ |
| Fore Street | BB3 0QD |
| Greenacre | BB3 0RL |
| Greenbank Terrace | BB3 0RN |
| Grenada Close | BB3 0SB |
| Kingston Place | BB3 0PP |
| Kingsway | BB3 0RF |
| Knight Crescent | BB3 0SR |
| Lady Close | BB3 0ST |
| Leacroft | BB3 0RS |
| Leeward Close | BB3 0SD |
| Lords Crescent | BB3 0SU |
| Marquis Close | BB3 0RD |
| Martinique Drive | BB3 0SA |
| Meadowcroft | BB3 0RU |
| Milking Lane | BB3 0RB |
| Millbrook Street | BB3 0PZ |
| Moorcroft | BB3 0RY |
| Sandy Lane | BB3 0PL BB3 0PN BB3 0PU |
| St Kitts Close | BB3 0SL |
| St Lucia Close | BB3 0SJ |
| St Vincents Close | BB3 0SH |
| Swan Farm Close | BB3 0QU |
| Tottenham Road | BB3 0PY |
| Viscount Avenue | BB3 0SS |
| Winward Close | BB3 0SE |
| Woodland Place | BB3 0PX |
Property price trends in Fernhurst
According to the latest Land Registry data, the average home in Fernhurst sold for £233,437 in 2026. That figure comes from 1,645 sales logged over the past 31 years.
Prices have continued to climb over the last three years. Compared with 2023, when the typical sale came in around £183,242, that's a rise of roughly 27.4%.
Looking back five years, average prices are up about 40.7% since 2021, a gain of around £67,520 in cash terms.
Zoom out to the past decade for the fuller picture. Back in 2016, homes here averaged £133,750, so the typical sold price has climbed about 74.5% since then, roughly 5.7% a year. Stretch the view to fifteen years and that annual pace eases back to about 4.5%.
Frequently asked questions about Fernhurst
What is the average price for a property for sale in Fernhurst?
The average price for a property for sale in Fernhurst is £195,737. This amount is 30% higher than the average price in Darwen. There are 974 property listings for sale in Fernhurst.
What streets have the most expensive properties for sale in Fernhurst?
The streets with the most expensive properties for sale in Fernhurst are Antigua Drive at an average of £268,686, Briarcroft at an average of £267,000 and Dominica Avenue at an average of £266,833.
What streets have the most affordable properties for sale in Fernhurst?
The streets with the most affordable properties for sale in Fernhurst are Duchess Street at an average of £73,333, Dover Street at an average of £96,000 and Cross Street at an average of £98,000.
Which train stations are available in or near Fernhurst?
Some of the train stations available in or near Fernhurst are Darwen, Mill Hill (Lancashire) and Blackburn.
Property Price Paid in Fernhurst by Year
The average sold property price by year was:
| Year | Average Sold Price | Price Change |
Sold Properties
|
|---|---|---|---|
| 2026 | £233,437 | 13% |
4 Properties |
| 2025 | £203,210 | 2% |
38 Properties |
| 2024 | £198,475 | 8% |
42 Properties |
| 2023 | £183,242 | 2% |
44 Properties |
| 2022 | £179,612 | 8% |
57 Properties |
| 2021 | £165,917 | 14% |
44 Properties |
| 2020 | £142,090 | 2% |
48 Properties |
| 2019 | £139,754 | -5% |
45 Properties |
| 2018 | £146,645 | 2% |
61 Properties |
| 2017 | £143,539 | 7% |
41 Properties |
Property Price per Property Type in Fernhurst
Here you can find historic sold price data in order to help with your property search.
The average Property Paid Price for specific property types in the last three years are:
| Property Type | Average Sold Price | Sold Properties |
|---|---|---|
| Semi Detached House | £190,328.00 | 32 Semi Detached Houses |
| Detached House | £274,041.00 | 47 Detached Houses |
| Terraced House | £124,161.00 | 49 Terraced Houses |
