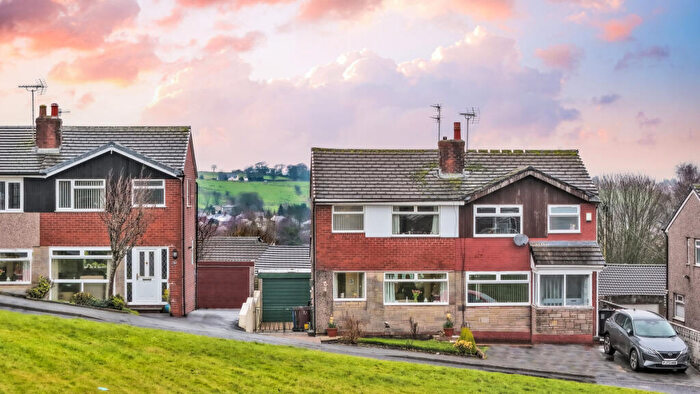
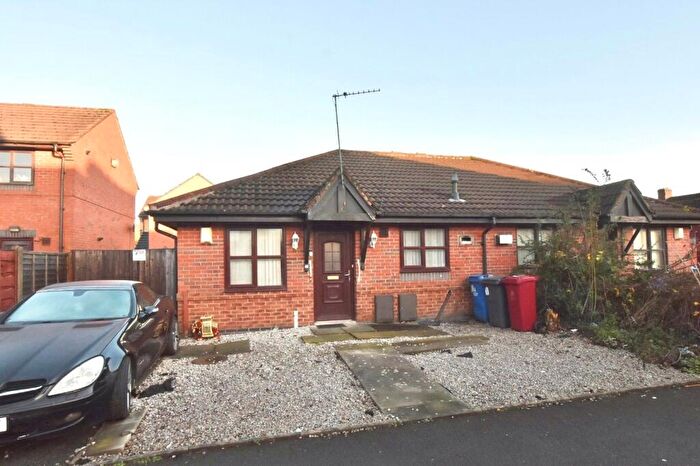
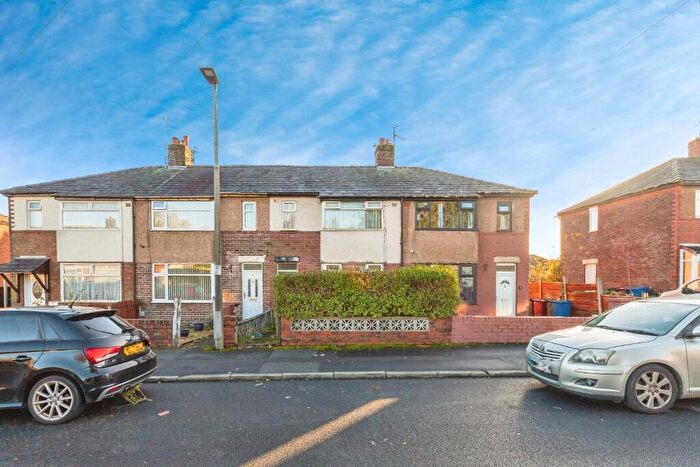
Houses for sale & to rent in Little Harwood, Blackburn
House Prices in Little Harwood
Properties in Little Harwood have an average house price of £143,515.00 and had 174 Property Transactions within the last 3 years¹.
Little Harwood is an area in Blackburn, Blackburn with Darwen with 2,250 households², where the most expensive property was sold for £360,000.00.
Properties for sale in Little Harwood
Previously listed properties in Little Harwood
Roads and Postcodes in Little Harwood
Navigate through our locations to find the location of your next house in Little Harwood, Blackburn for sale or to rent.
| Streets | Postcodes |
|---|---|
| Agate Street | BB1 9SH |
| Alder Street | BB1 5NN |
| Amber Avenue | BB1 9RS |
| Bancroft Avenue | BB1 5AP |
| Bank Hey Close | BB1 5RJ |
| Bank Hey Cottages | BB1 5QZ |
| Bank Hey Lane South | BB1 5RQ |
| Bay Street | BB1 5NJ |
| Beardsworth Street | BB1 5PL |
| Benson Street | BB1 5PP |
| Beryl Avenue | BB1 9RR |
| Bethel Road | BB1 5PJ |
| Bridgewater Drive | BB1 5AJ |
| Broadfold Avenue | BB1 5PS |
| Brooklands Terrace | BB1 5NT |
| Brownhill Drive | BB1 9RH |
| Cherry Gardens | BB1 5JD |
| Church Hill Road | BB1 5NX |
| Clarendon Road | BB1 9SS |
| Clarendon Road East | BB1 5QA |
| Clinton Street | BB1 5LB |
| Coniston Road | BB1 5NP BB1 5PU |
| Cornelian Street | BB1 9AW |
| Cunliffe Close | BB1 5QX |
| Douglas Place | BB1 9ST BB1 9SW |
| Elm Street | BB1 5NL |
| Emerald Avenue | BB1 9RP |
| Emerald Close | BB1 9AH |
| Emerald Street | BB1 9QJ |
| Fountains Avenue | BB1 5RX |
| Furness Avenue | BB1 5SE |
| Gladstone Street | BB1 3ES |
| Gladstone Way | BB1 5AN |
| Goldhey Street | BB1 5JZ |
| Gorse Street | BB1 3EU |
| Greenhead Avenue | BB1 5PR |
| Harwood Gate | BB1 5HP |
| Hazelwood Close | BB1 5QS |
| Highbank | BB1 9SX |
| Kelsall Avenue | BB1 5RU |
| Kirkland Close | BB1 5JF |
| Kirkland Court | BB1 5JE |
| Laburnum Road | BB1 5EQ BB1 5PY |
| Lilac Road | BB1 5PZ |
| Lowther Place | BB1 5SD |
| Moss Gate | BB1 5HS |
| Moss Street | BB1 5HW |
| Oakwood Avenue | BB1 5QY |
| Peridot Close | BB1 9AS |
| Plane Tree Road | BB1 5PA BB1 6LS |
| Progress Avenue | BB1 5NY |
| Providence Street | BB1 5PT |
| Railway Grove | BB1 5NW |
| Ravenscroft Close | BB1 5QW |
| Robinson Street | BB1 5PE |
| Rowan Close | BB1 5SP |
| Rydal Road | BB1 5NR |
| Sapphire Street | BB1 9SN |
| Seven Trees Avenue | BB1 5NG |
| St Stephens Avenue | BB1 5PB |
| St Stephens Road | BB1 5NS |
| Stone Hill Drive | BB1 5TR BB1 5TS |
| Sunnybower Close | BB1 5QU |
| Sunnybower Road | BB1 5QT |
| Tintern Crescent | BB1 5RT BB1 5RY |
| Tiplady Walk | BB1 5ET |
| Valli Gates | BB1 5ND |
| Victoria Close | BB1 5ES |
| Wareham Street | BB1 5PH |
| Warrington Street | BB1 5PN BB1 5PW |
| Welbeck Avenue | BB1 5SF |
| Whalley New Road | BB1 9SL BB1 9SP BB1 9SR |
| Whalley Old Road | BB1 4AA BB1 5NZ BB1 5PD BB1 5PQ BB1 5QL BB1 5RH BB1 5RS BB1 5SA BB1 5SB |
| Willow Street | BB1 5JB BB1 5NQ |
| Woodville Road | BB1 5NU |
| Zion Road | BB1 5PX |
Transport near Little Harwood
-
Blackburn Station
-
Ramsgreave and Wilpshire Station
-
Rishton Station
-
Mill Hill (Lancashire) Station
-
Cherry Tree Station
-
Langho Station
- FAQ
- Price Paid By Year
- Property Type Price
Frequently asked questions about Little Harwood
What is the average price for a property for sale in Little Harwood?
The average price for a property for sale in Little Harwood is £143,515. This amount is 13% lower than the average price in Blackburn. There are 584 property listings for sale in Little Harwood.
What streets have the most expensive properties for sale in Little Harwood?
The streets with the most expensive properties for sale in Little Harwood are Bancroft Avenue at an average of £286,000, Bridgewater Drive at an average of £278,666 and Woodville Road at an average of £262,000.
What streets have the most affordable properties for sale in Little Harwood?
The streets with the most affordable properties for sale in Little Harwood are Sapphire Street at an average of £66,250, Seven Trees Avenue at an average of £75,500 and Warrington Street at an average of £83,333.
Which train stations are available in or near Little Harwood?
Some of the train stations available in or near Little Harwood are Blackburn, Ramsgreave and Wilpshire and Rishton.
Property Price Paid in Little Harwood by Year
The average sold property price by year was:
| Year | Average Sold Price | Price Change |
Sold Properties
|
|---|---|---|---|
| 2025 | £156,676 | 8% |
51 Properties |
| 2024 | £144,157 | 8% |
57 Properties |
| 2023 | £132,791 | -0,1% |
66 Properties |
| 2022 | £132,961 | 12% |
60 Properties |
| 2021 | £116,765 | -2% |
99 Properties |
| 2020 | £118,623 | -1% |
59 Properties |
| 2019 | £119,940 | 16% |
58 Properties |
| 2018 | £100,506 | 2% |
82 Properties |
| 2017 | £98,627 | 10% |
74 Properties |
| 2016 | £88,542 | -17% |
75 Properties |
| 2015 | £103,193 | -10% |
82 Properties |
| 2014 | £113,403 | -1% |
103 Properties |
| 2013 | £114,008 | 5% |
114 Properties |
| 2012 | £108,233 | 1% |
98 Properties |
| 2011 | £107,329 | 6% |
63 Properties |
| 2010 | £100,592 | -0,4% |
70 Properties |
| 2009 | £101,011 | -5% |
65 Properties |
| 2008 | £106,194 | 5% |
68 Properties |
| 2007 | £101,216 | 8% |
116 Properties |
| 2006 | £92,814 | 15% |
109 Properties |
| 2005 | £78,906 | 12% |
88 Properties |
| 2004 | £69,455 | 36% |
126 Properties |
| 2003 | £44,724 | 24% |
118 Properties |
| 2002 | £33,940 | -6% |
99 Properties |
| 2001 | £35,992 | 8% |
155 Properties |
| 2000 | £33,257 | -5% |
97 Properties |
| 1999 | £34,939 | 5% |
87 Properties |
| 1998 | £33,025 | 9% |
100 Properties |
| 1997 | £30,067 | -2% |
109 Properties |
| 1996 | £30,626 | -3% |
104 Properties |
| 1995 | £31,587 | - |
89 Properties |
Property Price per Property Type in Little Harwood
Here you can find historic sold price data in order to help with your property search.
The average Property Paid Price for specific property types in the last three years are:
| Property Type | Average Sold Price | Sold Properties |
|---|---|---|
| Semi Detached House | £163,625.00 | 77 Semi Detached Houses |
| Detached House | £266,055.00 | 9 Detached Houses |
| Terraced House | £114,454.00 | 86 Terraced Houses |
| Flat | £67,500.00 | 2 Flats |

