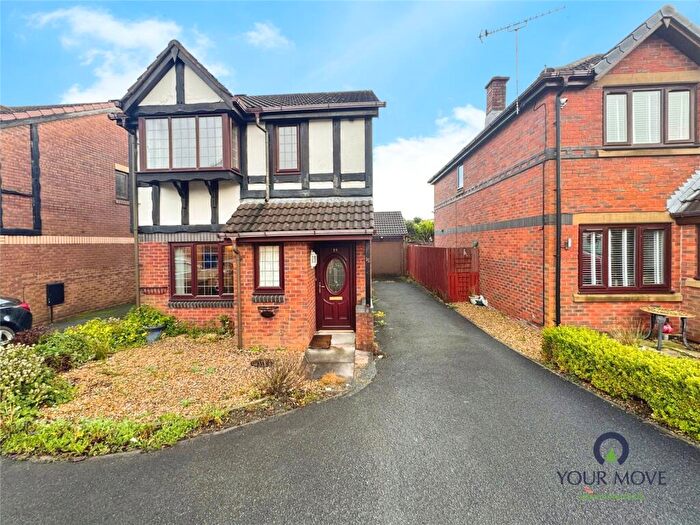
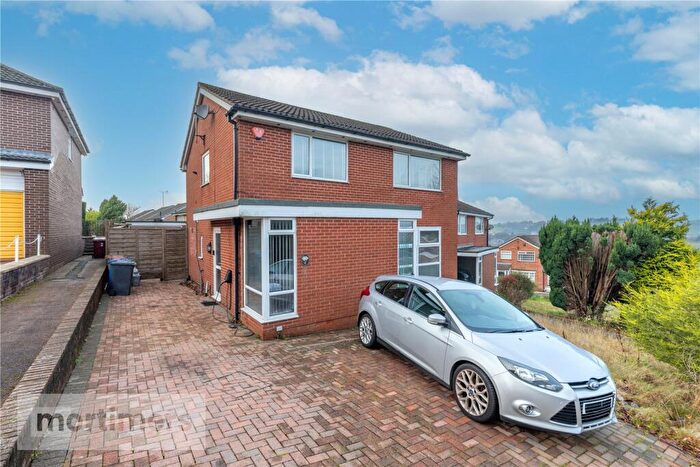
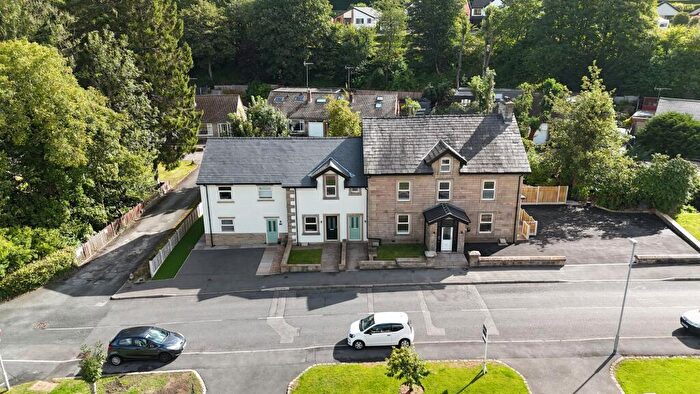
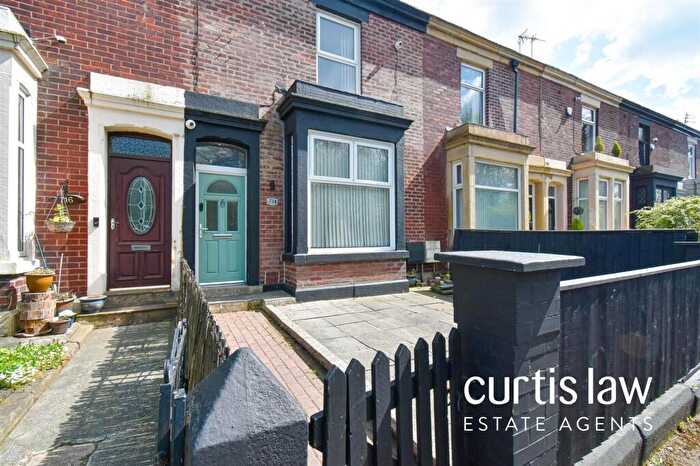
Houses for sale & to rent in Roe Lee, Blackburn
House Prices in Roe Lee
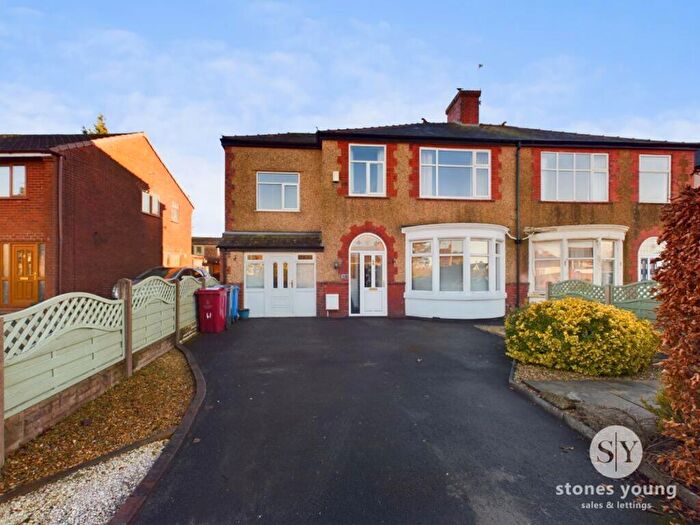
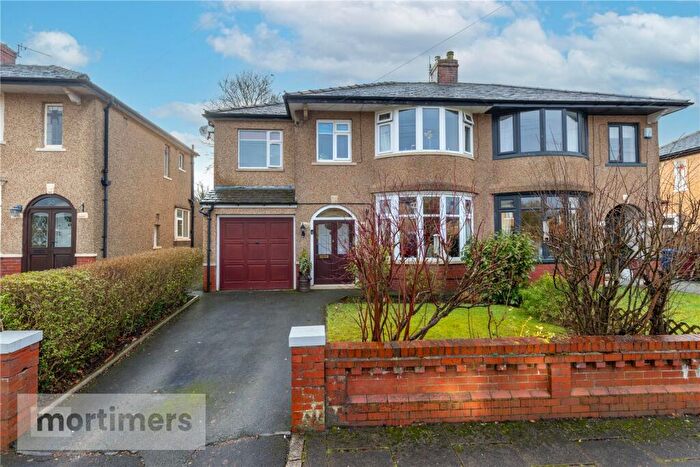
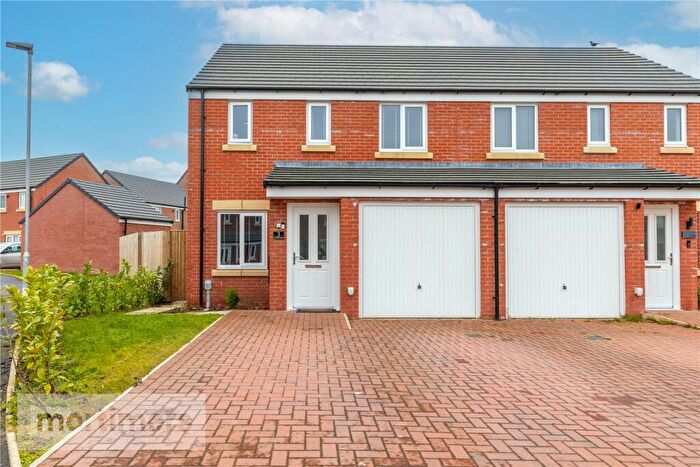
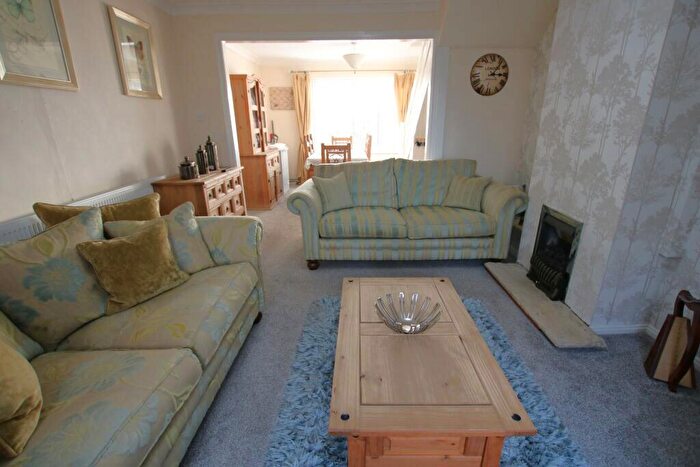
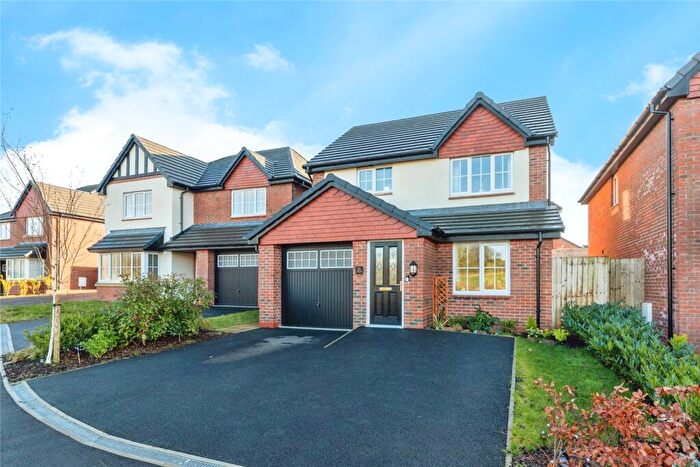
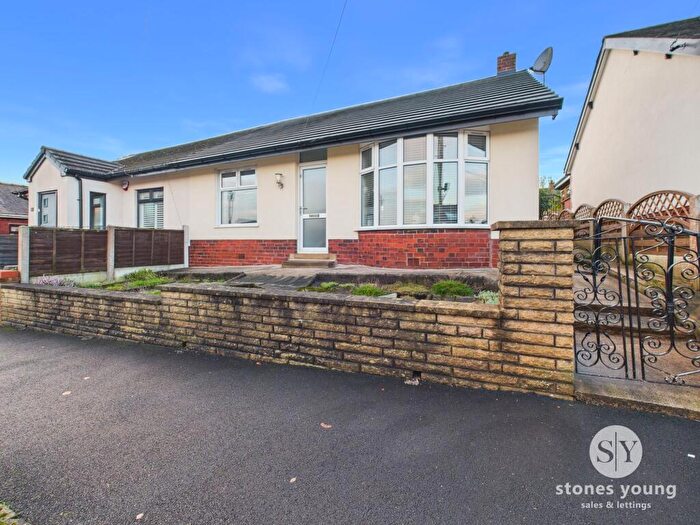
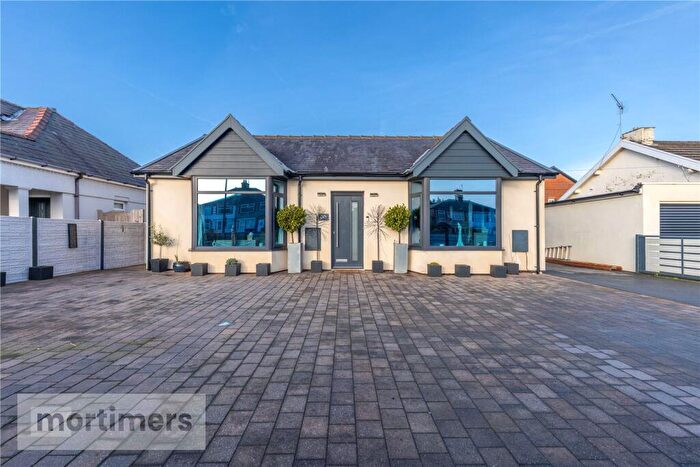
Properties in Roe Lee have an average house price of £189,760.00 and had 351 Property Transactions within the last 3 years¹.
Roe Lee is an area in Blackburn, Blackburn with Darwen with 2,618 households², where the most expensive property was sold for £625,000.00.
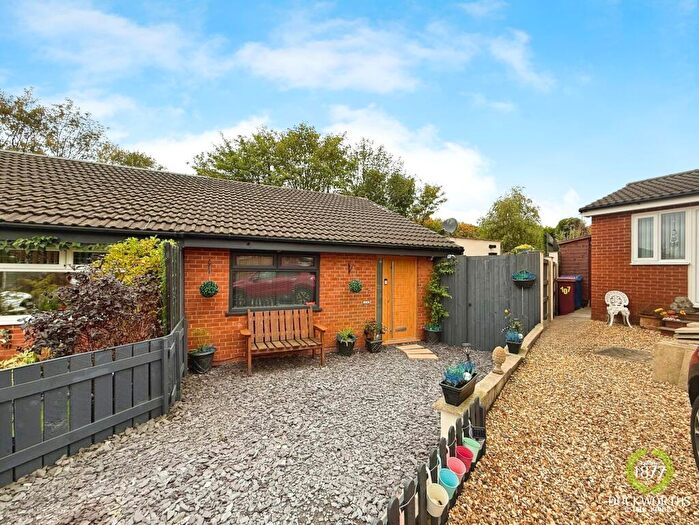
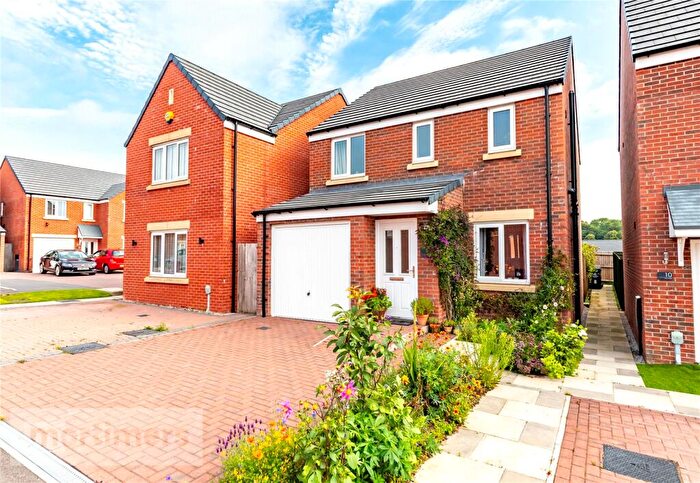
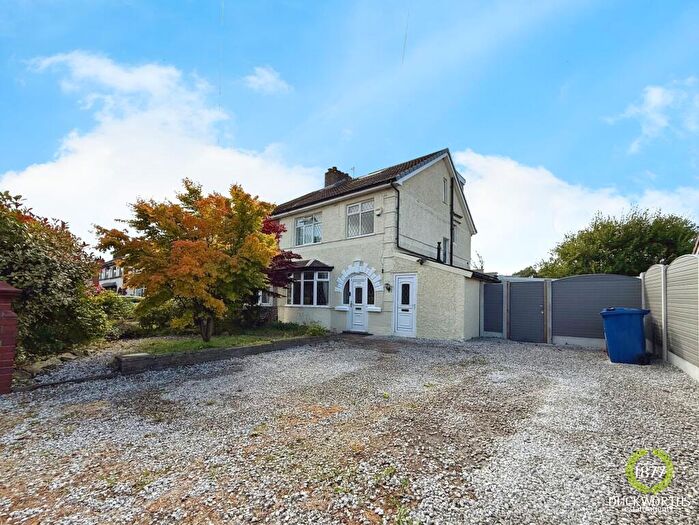
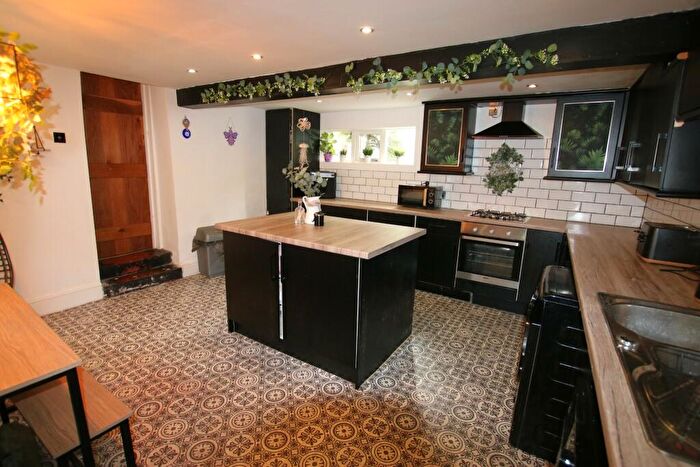
Properties for sale in Roe Lee
Roads and Postcodes in Roe Lee
Navigate through our locations to find the location of your next house in Roe Lee, Blackburn for sale or to rent.
| Streets | Postcodes |
|---|---|
| Aldwych Place | BB1 9QP |
| Amethyst Street | BB1 9QW |
| Aspinall Fold | BB1 8PD |
| Balmoral Avenue | BB1 9NR |
| Bank Hey Lane North | BB1 9QU |
| Barmouth Crescent | BB1 8PZ |
| Beech Mount | BB1 9BP |
| Belvedere Close | BB1 9NU |
| Belvedere Road | BB1 9NS |
| Blenheim Close | BB1 8QL |
| Bradshaw Close | BB1 8RL |
| Briar Road | BB1 9TF |
| Broadway | BB1 8QZ |
| Brookview Close | BB1 9NT |
| Brownhill Drive | BB1 9QR BB1 9SB |
| Brownhill Road | BB1 9QX BB1 9QY |
| Cadshaw Close | BB1 8RN |
| Cambrian Close | BB1 9RA |
| Campbell Court | BB1 9GD |
| Campbell Street | BB1 9AF |
| Carham Road | BB1 8NX |
| Chatsworth Close | BB1 8QH |
| Chestnut Avenue | BB1 8FG |
| Church Walk | BB1 9QS |
| Cornelian Street | BB1 9QL BB1 9QN |
| Cranshaw Drive | BB1 8RE |
| Curlew Close | BB1 8NT |
| East Lancashire Road | BB1 9QZ |
| Emerald Street | BB1 9JR |
| Further Wilworth | BB1 8QP |
| Goodshaw Avenue | BB1 8PF |
| Goodshaw Close | BB1 8PG |
| Green Gown | BB1 8NY |
| Gretna Road | BB1 9AN |
| Gretna Walk | BB1 9AR |
| Hardy Street | BB1 9AA |
| Haston Lee Avenue | BB1 9QT |
| Hawthorn Street | BB1 9TH |
| Haydock Street | BB1 9AE |
| Heron Close | BB1 8NU |
| Hill View | BB1 8RA |
| Kingfisher Close | BB1 8NS |
| Lower Wilworth | BB1 8QF |
| Newington Avenue | BB1 9RG |
| North Bank Avenue | BB1 8PY |
| Openshaw Drive | BB1 8RB BB1 8RF BB1 8RH |
| Ottershaw Gardens | BB1 8RG |
| Outram Lane | BB1 9AD |
| Parsonage Road | BB1 9NN BB1 9NP BB1 9PG BB1 4AQ |
| Pearl Close | BB1 9AQ |
| Pemberton Street | BB1 9AB |
| Penshaw Close | BB1 8RD |
| Pleckfarm Avenue | BB1 8PE |
| Pleckgate Fold | BB1 8QB |
| Pleckgate Road | BB1 8NN BB1 8NZ BB1 8PN BB1 8QA BB1 8QR BB1 8QW |
| Ramsgreave Avenue | BB1 8QS |
| Ramsgreave Drive | BB1 8NA BB1 8NB BB1 8ND BB1 8QT |
| Regents View | BB1 8QQ |
| Rhodes Avenue | BB1 8NP BB1 8NW |
| Roe Lee Cottages | BB1 8QE |
| Roe Lee Industrial Estate | BB1 9SU |
| Roe Lee Park | BB1 9RX BB1 9RZ BB1 9SA |
| Rosewood Avenue | BB1 9SZ BB1 9UB BB1 7SB |
| Royal Oak Avenue | BB1 8QD |
| Royshaw Avenue | BB1 8RJ |
| Royshaw Close | BB1 8RW |
| Ruby Street | BB1 9AY |
| Sandringham Close | BB1 8QJ |
| Shear Brow | BB1 8DS BB1 8DX BB1 8FR |
| St Gabriels Avenue | BB1 9RQ |
| St James's Road | BB1 8EP BB1 8ET |
| Swallowfields | BB1 8NR |
| The Limes | BB1 8FE BB1 8FD |
| The Oaks | BB1 8FA |
| Thornwood Close | BB1 9UF |
| Toddy Fold | BB1 8PW |
| Topaz Street | BB1 9RY |
| Walden Road | BB1 9PQ |
| Warrenside Close | BB1 9PE BB1 9PF |
| Whalley New Road | BB1 9AU BB1 9AZ BB1 9BA BB1 9BD BB1 9BE BB1 9DB BB1 9PH |
| Willow Mount | BB1 9DA |
| Wilworth Crescent | BB1 8QN |
| York Crescent | BB1 9NW |
| BB1 9AT |
Transport near Roe Lee
-
Ramsgreave and Wilpshire Station
-
Blackburn Station
-
Rishton Station
-
Mill Hill (Lancashire) Station
-
Langho Station
- FAQ
- Price Paid By Year
- Property Type Price
Frequently asked questions about Roe Lee
What is the average price for a property for sale in Roe Lee?
The average price for a property for sale in Roe Lee is £189,760. This amount is 15% higher than the average price in Blackburn. There are 851 property listings for sale in Roe Lee.
What streets have the most expensive properties for sale in Roe Lee?
The streets with the most expensive properties for sale in Roe Lee are Heron Close at an average of £397,833, Curlew Close at an average of £391,500 and Swallowfields at an average of £390,000.
What streets have the most affordable properties for sale in Roe Lee?
The streets with the most affordable properties for sale in Roe Lee are Outram Lane at an average of £71,050, Campbell Street at an average of £75,000 and Haydock Street at an average of £75,500.
Which train stations are available in or near Roe Lee?
Some of the train stations available in or near Roe Lee are Ramsgreave and Wilpshire, Blackburn and Rishton.
Property Price Paid in Roe Lee by Year
The average sold property price by year was:
| Year | Average Sold Price | Price Change |
Sold Properties
|
|---|---|---|---|
| 2025 | £191,847 | -4% |
120 Properties |
| 2024 | £198,919 | 11% |
122 Properties |
| 2023 | £177,211 | -4% |
109 Properties |
| 2022 | £183,992 | 11% |
133 Properties |
| 2021 | £163,529 | 7% |
156 Properties |
| 2020 | £152,391 | -4% |
118 Properties |
| 2019 | £158,350 | -1% |
123 Properties |
| 2018 | £159,145 | 5% |
156 Properties |
| 2017 | £151,815 | 5% |
138 Properties |
| 2016 | £144,265 | 15% |
138 Properties |
| 2015 | £122,373 | -5% |
130 Properties |
| 2014 | £128,492 | 4% |
101 Properties |
| 2013 | £123,778 | 3% |
94 Properties |
| 2012 | £119,643 | -10% |
73 Properties |
| 2011 | £131,642 | 3% |
76 Properties |
| 2010 | £127,120 | 2% |
73 Properties |
| 2009 | £125,159 | -13% |
84 Properties |
| 2008 | £141,031 | 0,4% |
78 Properties |
| 2007 | £140,473 | 3% |
150 Properties |
| 2006 | £135,889 | 15% |
172 Properties |
| 2005 | £114,875 | 7% |
143 Properties |
| 2004 | £106,572 | 20% |
165 Properties |
| 2003 | £85,287 | 19% |
162 Properties |
| 2002 | £69,132 | 16% |
144 Properties |
| 2001 | £58,272 | -2% |
161 Properties |
| 2000 | £59,382 | 4% |
155 Properties |
| 1999 | £57,120 | 15% |
120 Properties |
| 1998 | £48,536 | -5% |
124 Properties |
| 1997 | £50,983 | -2% |
167 Properties |
| 1996 | £52,094 | -4% |
118 Properties |
| 1995 | £54,270 | - |
116 Properties |
Property Price per Property Type in Roe Lee
Here you can find historic sold price data in order to help with your property search.
The average Property Paid Price for specific property types in the last three years are:
| Property Type | Average Sold Price | Sold Properties |
|---|---|---|
| Semi Detached House | £190,414.00 | 167 Semi Detached Houses |
| Detached House | £274,391.00 | 78 Detached Houses |
| Terraced House | £133,434.00 | 81 Terraced Houses |
| Flat | £103,840.00 | 25 Flats |

