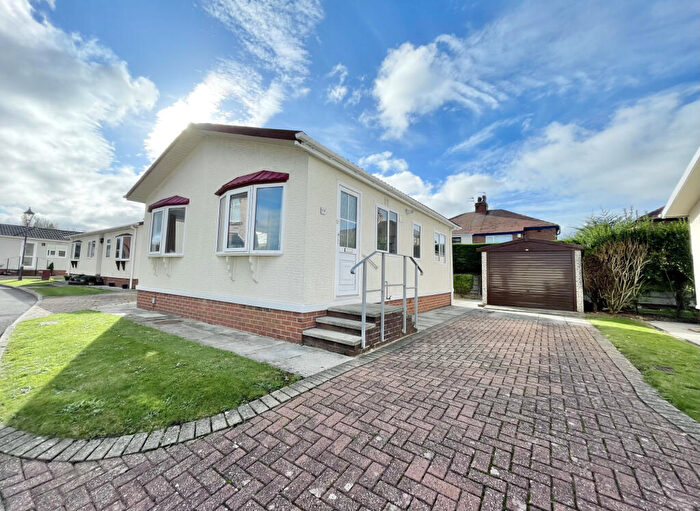
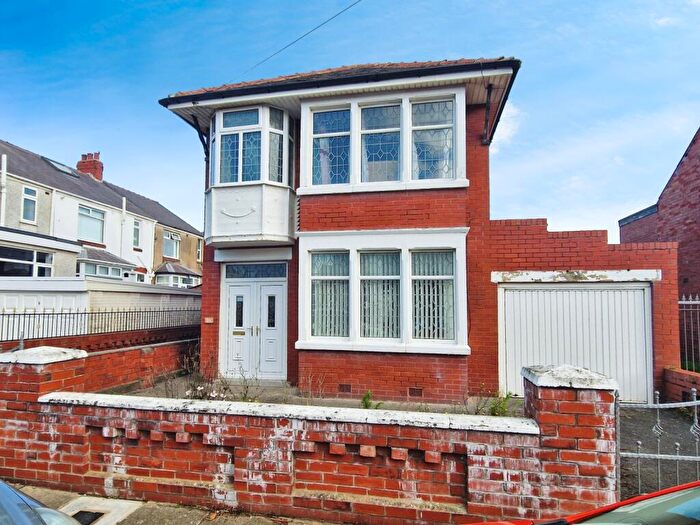
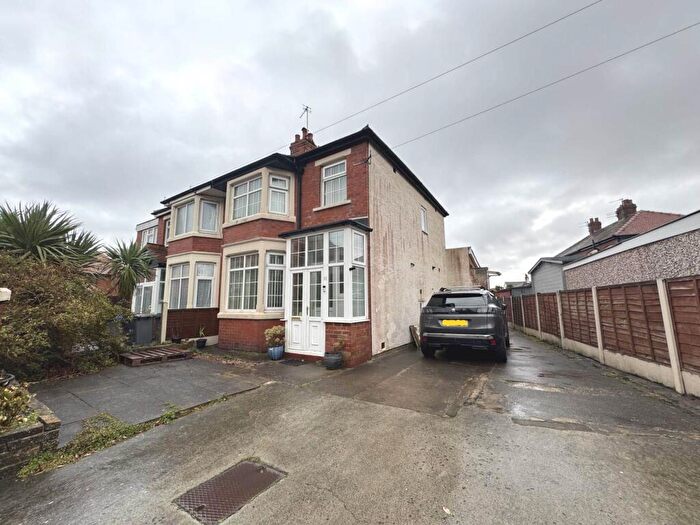
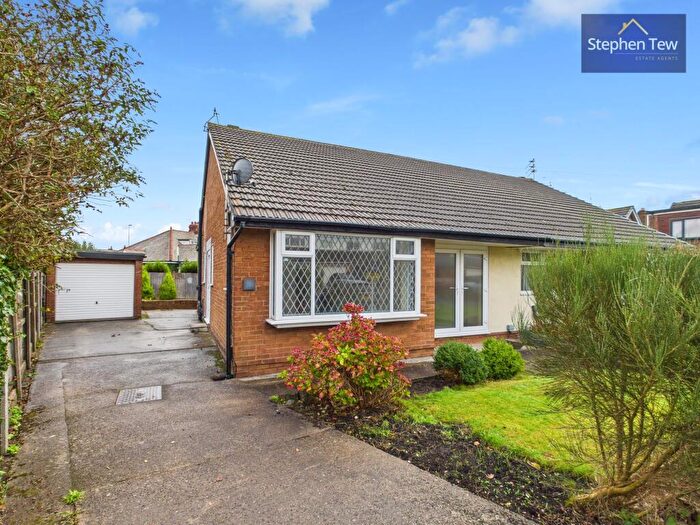
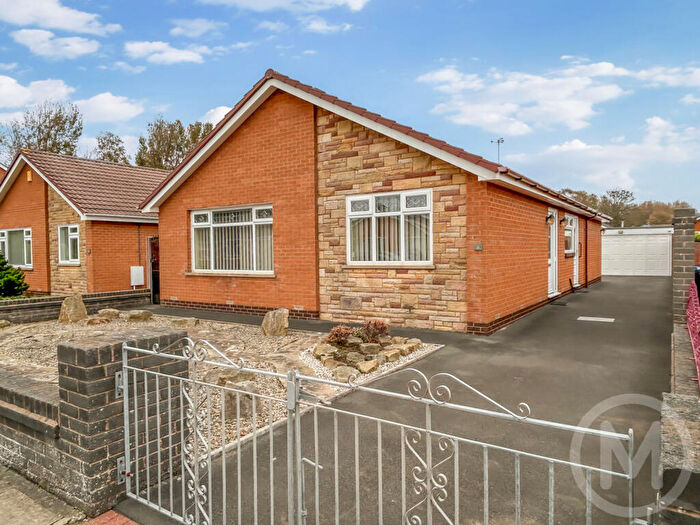
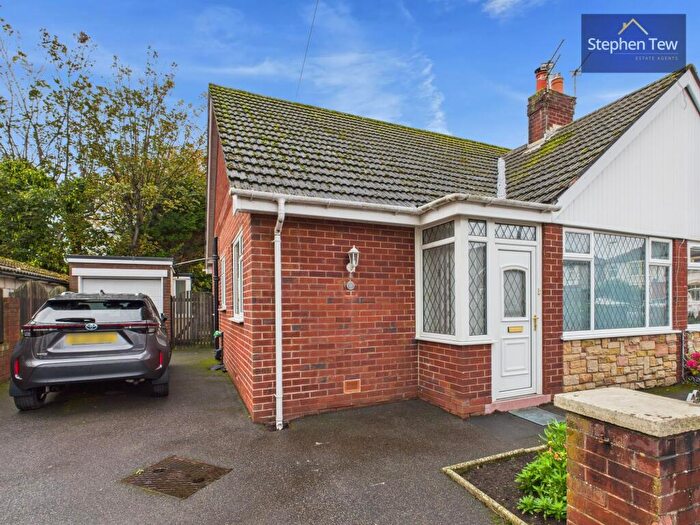
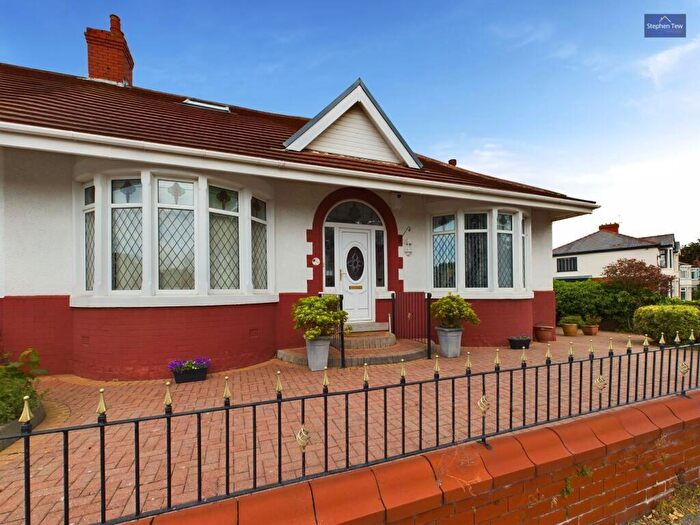
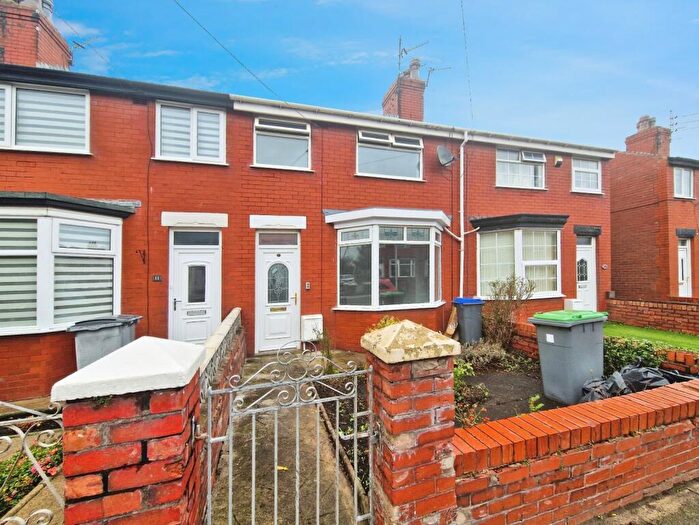
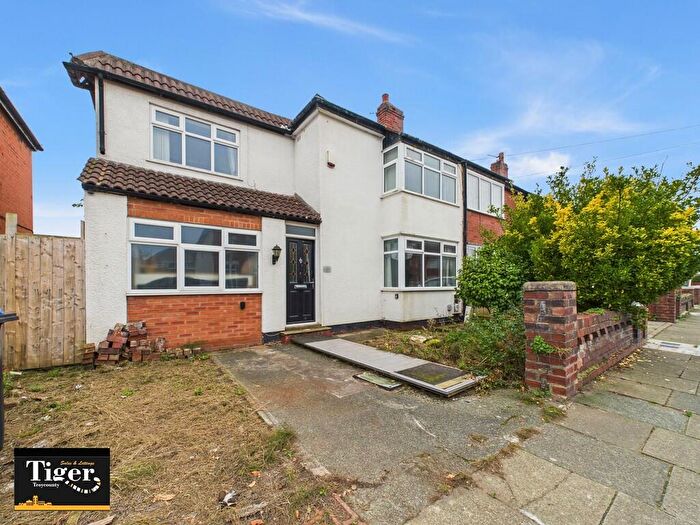
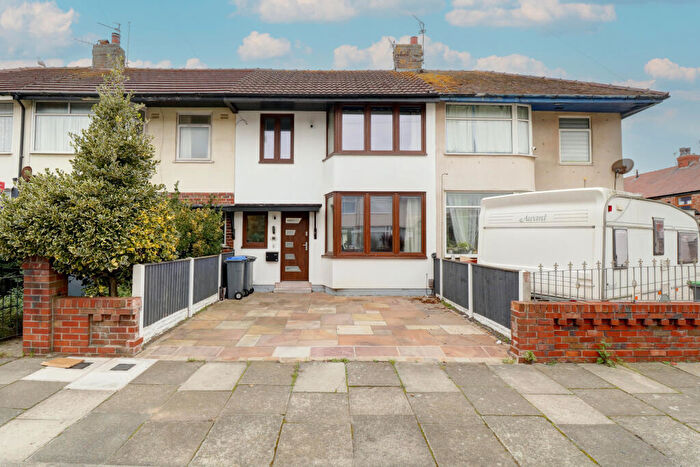
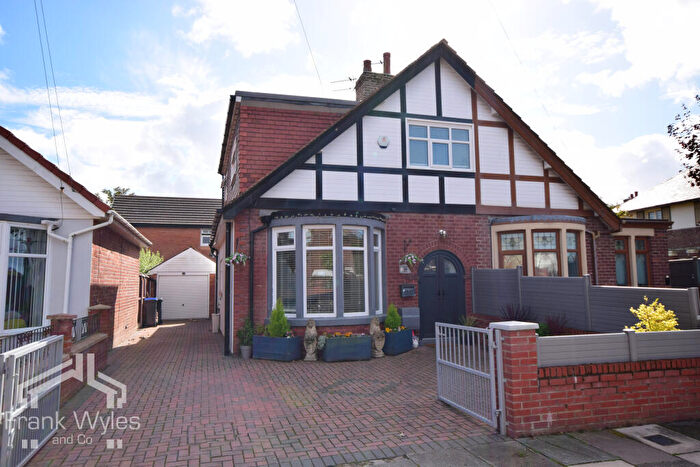
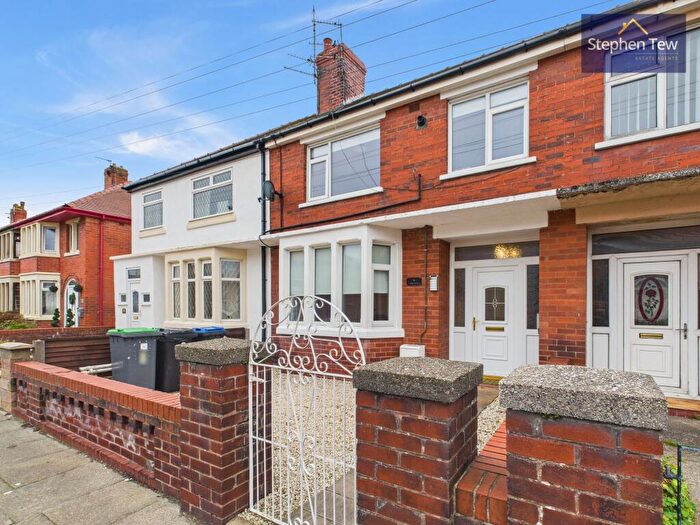
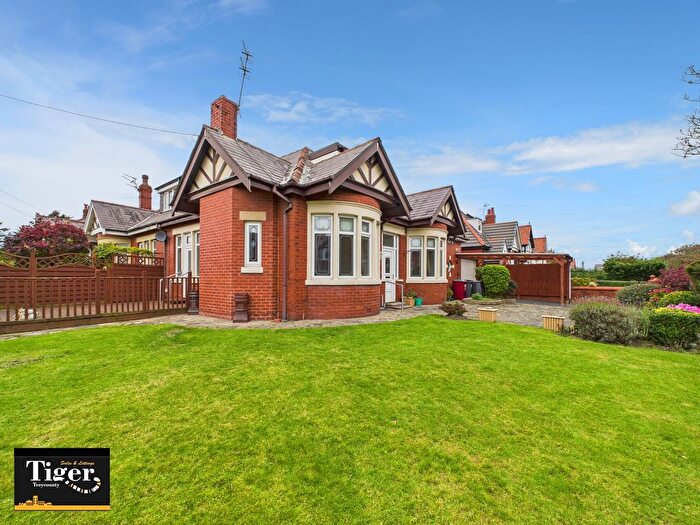
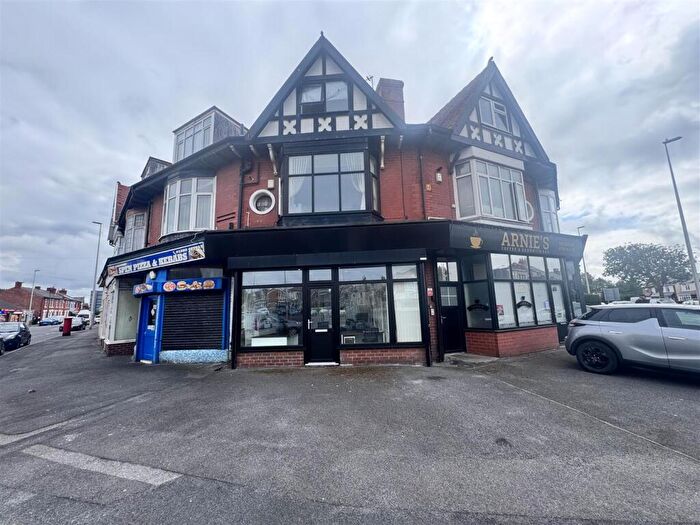
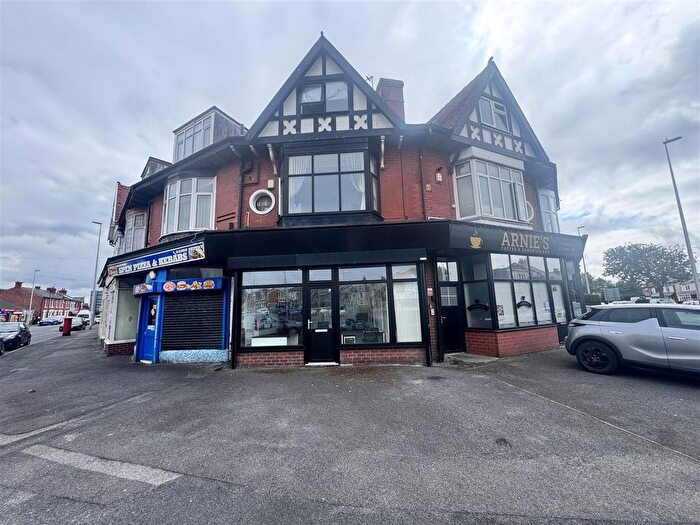
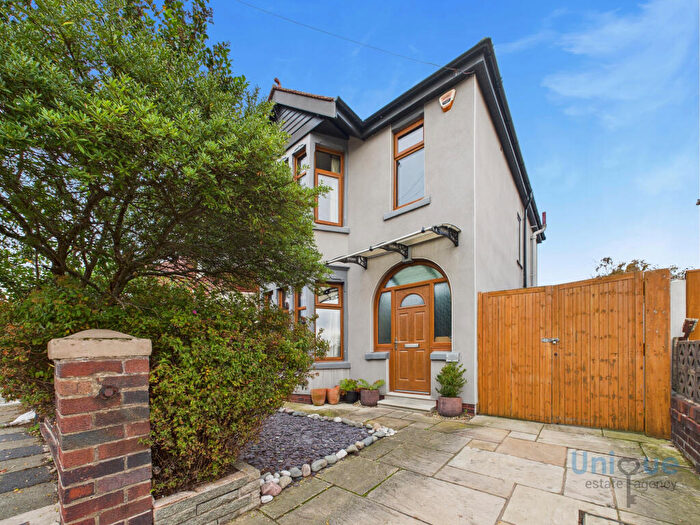
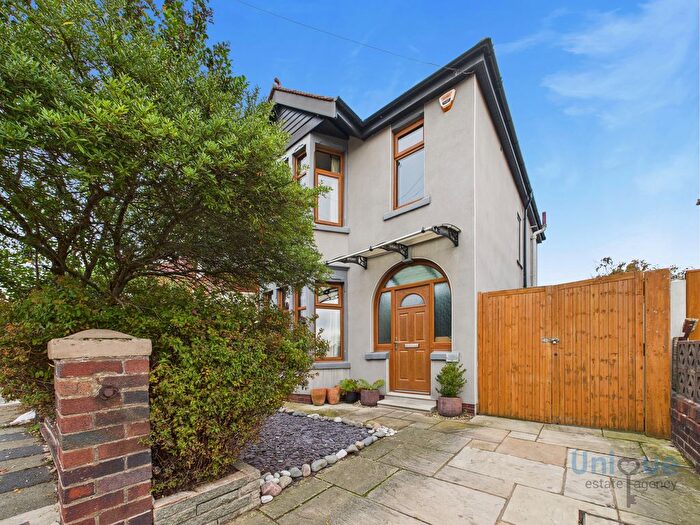
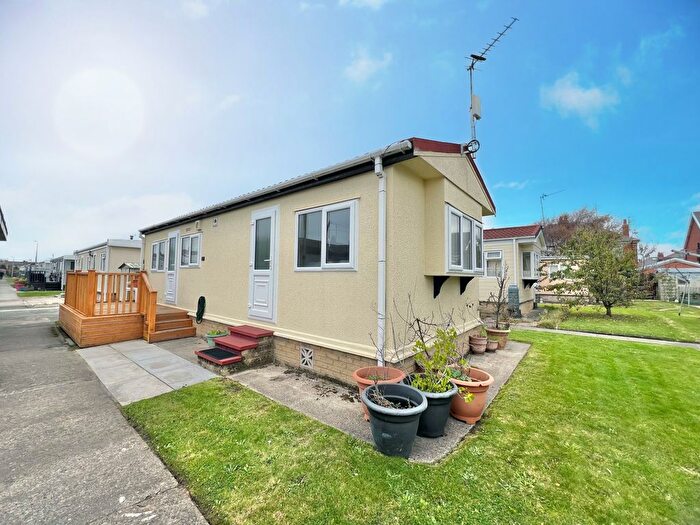
Houses for sale & to rent in Highfield, Blackpool
House Prices in Highfield
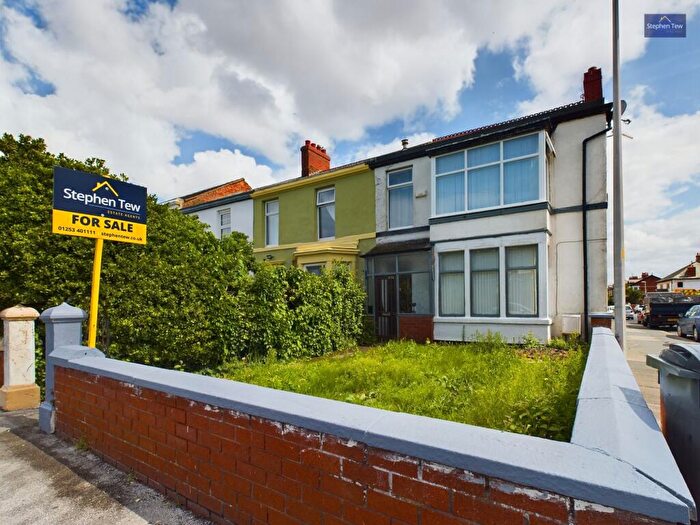
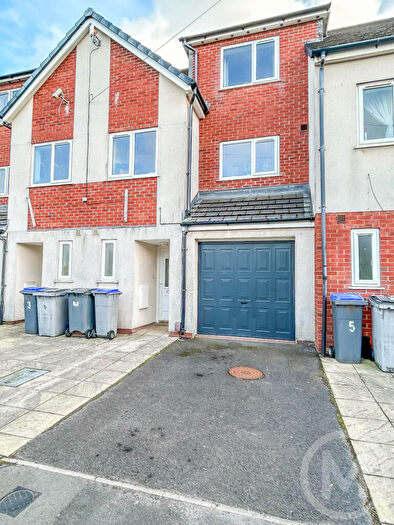
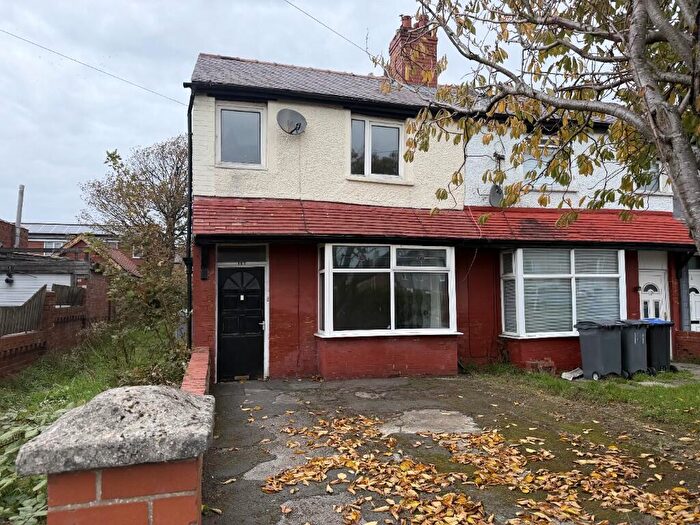
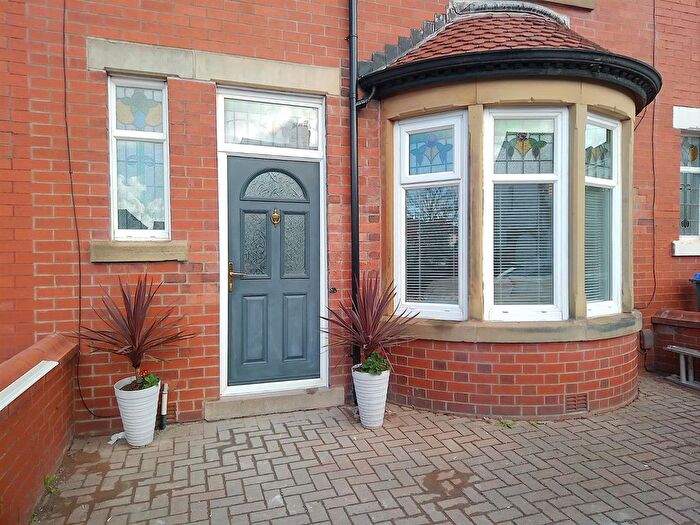
Properties in Highfield have an average house price of £148,474.00 and had 403 Property Transactions within the last 3 years¹.
Highfield is an area in Blackpool, Blackpool with 2,905 households², where the most expensive property was sold for £925,000.00.
Properties for sale in Highfield
Roads and Postcodes in Highfield
Navigate through our locations to find the location of your next house in Highfield, Blackpool for sale or to rent.
| Streets | Postcodes |
|---|---|
| Abbey Close | FY4 2FH |
| Abbey Road | FY4 2JZ FY4 2LB FY4 2PZ |
| Acre Gate | FY4 3LE FY4 3LF |
| Alpine Avenue | FY4 3QH |
| Ayrton Avenue | FY4 2BW |
| Balham Avenue | FY4 3QP |
| Belvere Avenue | FY4 2LN FY4 2LW |
| Burgate | FY4 2QH |
| Burnage Gardens | FY4 3JA |
| Cartmell Fold | FY4 2NL |
| Cheddar Avenue | FY4 2LG FY4 2LQ |
| Chiltern Avenue | FY4 2BN |
| Clayton Crescent | FY4 3PT FY4 3PS |
| Dalton Avenue | FY4 2QF |
| Darley Avenue | FY4 3JW |
| Deeside | FY4 2PR |
| Dorritt Road | FY4 3PE |
| Emerson Avenue | FY4 3JG |
| Endsleigh Gardens | FY4 3PA FY4 3PB FY4 3PN |
| Faringdon Avenue | FY4 3QJ FY4 3QQ |
| Farnell Place | FY4 2LH |
| Ferndale Avenue | FY4 3JB FY4 3JD |
| Garton Avenue | FY4 2JW |
| Gildabrook Road | FY4 2LU |
| Helens Close | FY4 3QD FY4 3QE |
| Highfield Road | FY4 2HG FY4 2HH FY4 2JG FY4 3JU FY4 3NS FY4 3NU FY4 2HL |
| Highgate | FY4 2QJ |
| Ivy Avenue | FY4 3QF FY4 3QG FY4 3RU |
| Keasden Avenue | FY4 3JE FY4 3JF |
| Kimberley Avenue | FY4 2LR FY4 2LS |
| Kingsmede | FY4 3NN FY4 3NW |
| Knightsbridge Avenue | FY4 2HS |
| Lawn Tennis Court | FY4 2NJ |
| Lennox Court | FY4 3JR |
| Lennox Gate | FY4 3JH FY4 3JQ |
| Lindale Gardens | FY4 3PG FY4 3PH FY4 3PQ |
| Linfield Terrace | FY4 3PD FY4 3PR |
| Little Oaks | FY4 2LF |
| Livet Avenue | FY4 3HT |
| Longridge Avenue | FY4 3QN |
| Lostock Gardens | FY4 3PP |
| Loxham Gardens | FY4 3NY |
| Marcroft Avenue | FY4 3JL |
| Margate Avenue | FY4 3PF |
| Matthews Court | FY4 2BT |
| Molyneux Drive | FY4 3JJ FY4 3JP |
| Nesswood Avenue | FY4 3PW |
| Oak Grove | FY4 2JR |
| Pedders Lane | FY4 3HX FY4 3HY FY4 3HZ |
| Primrose Avenue | FY4 2LJ FY4 2LL |
| Ravenwood Avenue | FY4 2LT |
| Regal Avenue | FY4 3NL |
| Sandgate | FY4 2LP FY4 2LX FY4 2NA FY4 2NE FY4 2NG |
| Sawley Avenue | FY4 2NB FY4 2ND |
| Scotswood Avenue | FY4 2HN |
| Selby Avenue | FY4 2LY FY4 2LZ |
| Skerryvore Caravan Park | FY4 2HQ |
| Speyside | FY4 2BS |
| Squires Gate Lane | FY4 2NH FY4 2QG FY4 3RE FY4 3RF |
| St Annes Road | FY4 2EE FY4 2EF FY4 2QL FY4 2QN FY4 2QP FY4 2QR FY4 2QW FY4 2RB |
| St Martins Road | FY4 2EA |
| Stadium Avenue | FY4 3QA FY4 3QB |
| Sunnyhurst Avenue | FY4 2HP |
| Sunnyhurst Park | FY4 2HR |
| Taybank Avenue | FY4 3HS |
| Teenadore Avenue | FY4 3JN |
| Tewkesbury Avenue | FY4 2NF |
| Thursby Avenue | FY4 2HW |
| Waltham Avenue | FY4 2NQ |
| Weeton Avenue | FY4 3QW |
| Wellogate Gardens | FY4 2JP |
| Westby Avenue | FY4 3QL |
| Wyndham Gardens | FY4 3NX |
Transport near Highfield
-
Blackpool Pleasure Beach Station
-
Squires Gate Station
-
Blackpool South Station
-
St.Annes-On-The-Sea Station
-
Blackpool North Station
- FAQ
- Price Paid By Year
- Property Type Price
Frequently asked questions about Highfield
What is the average price for a property for sale in Highfield?
The average price for a property for sale in Highfield is £148,474. This amount is 9% higher than the average price in Blackpool. There are 1,857 property listings for sale in Highfield.
What streets have the most expensive properties for sale in Highfield?
The streets with the most expensive properties for sale in Highfield are Regal Avenue at an average of £513,250, Taybank Avenue at an average of £280,000 and Ayrton Avenue at an average of £220,875.
What streets have the most affordable properties for sale in Highfield?
The streets with the most affordable properties for sale in Highfield are Lennox Court at an average of £57,000, Molyneux Drive at an average of £97,571 and Kingsmede at an average of £98,979.
Which train stations are available in or near Highfield?
Some of the train stations available in or near Highfield are Blackpool Pleasure Beach, Squires Gate and Blackpool South.
Property Price Paid in Highfield by Year
The average sold property price by year was:
| Year | Average Sold Price | Price Change |
Sold Properties
|
|---|---|---|---|
| 2025 | £153,935 | 1% |
50 Properties |
| 2024 | £152,007 | 7% |
109 Properties |
| 2023 | £142,125 | -5% |
105 Properties |
| 2022 | £148,534 | 5% |
139 Properties |
| 2021 | £140,401 | 14% |
127 Properties |
| 2020 | £121,187 | -1% |
87 Properties |
| 2019 | £122,517 | 0,1% |
108 Properties |
| 2018 | £122,377 | -2% |
93 Properties |
| 2017 | £124,609 | 3% |
98 Properties |
| 2016 | £120,447 | 2% |
90 Properties |
| 2015 | £118,414 | -1% |
95 Properties |
| 2014 | £119,148 | 1% |
91 Properties |
| 2013 | £117,708 | 4% |
81 Properties |
| 2012 | £112,493 | 1% |
58 Properties |
| 2011 | £111,818 | -16% |
71 Properties |
| 2010 | £130,099 | 8% |
60 Properties |
| 2009 | £119,273 | 2% |
79 Properties |
| 2008 | £117,373 | -12% |
70 Properties |
| 2007 | £131,201 | 0,4% |
156 Properties |
| 2006 | £130,669 | 12% |
149 Properties |
| 2005 | £114,363 | 5% |
133 Properties |
| 2004 | £109,051 | 25% |
156 Properties |
| 2003 | £81,773 | 20% |
168 Properties |
| 2002 | £65,084 | 14% |
216 Properties |
| 2001 | £55,708 | 3% |
167 Properties |
| 2000 | £53,965 | 7% |
171 Properties |
| 1999 | £50,432 | - |
139 Properties |
| 1998 | £50,413 | 7% |
131 Properties |
| 1997 | £46,773 | -1% |
150 Properties |
| 1996 | £47,365 | 1% |
122 Properties |
| 1995 | £46,842 | - |
83 Properties |
Property Price per Property Type in Highfield
Here you can find historic sold price data in order to help with your property search.
The average Property Paid Price for specific property types in the last three years are:
| Property Type | Average Sold Price | Sold Properties |
|---|---|---|
| Semi Detached House | £162,291.00 | 222 Semi Detached Houses |
| Detached House | £228,154.00 | 25 Detached Houses |
| Terraced House | £121,677.00 | 135 Terraced Houses |
| Flat | £79,809.00 | 21 Flats |

