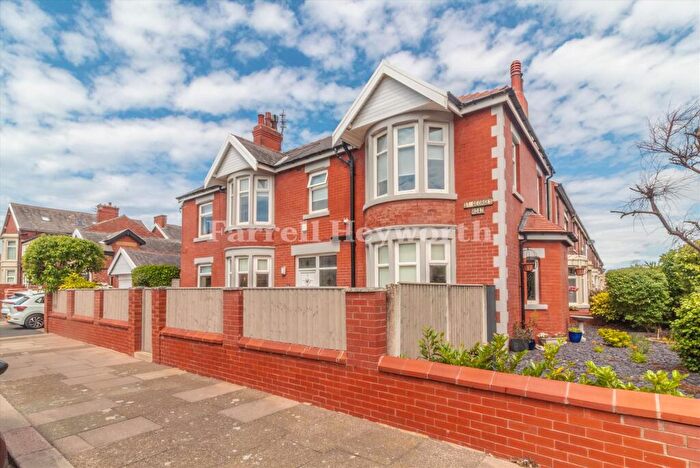
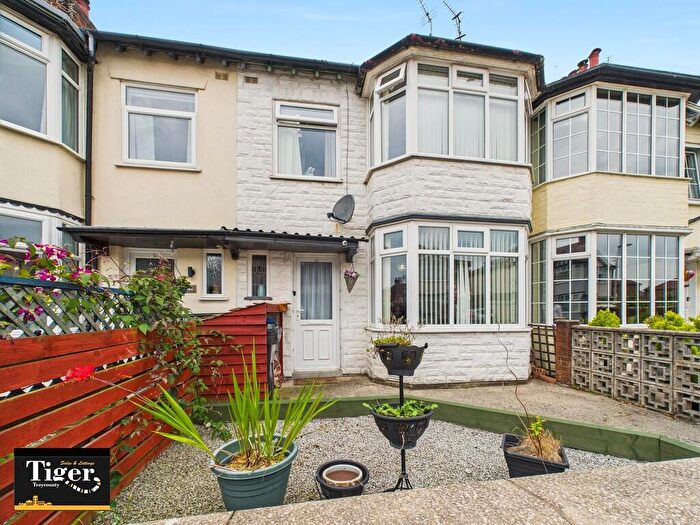
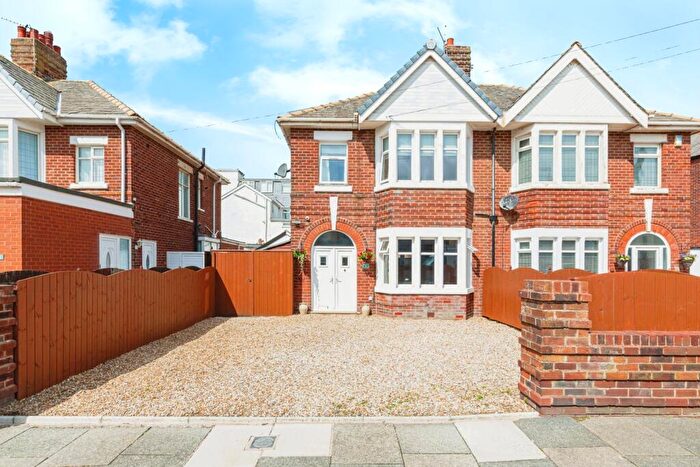
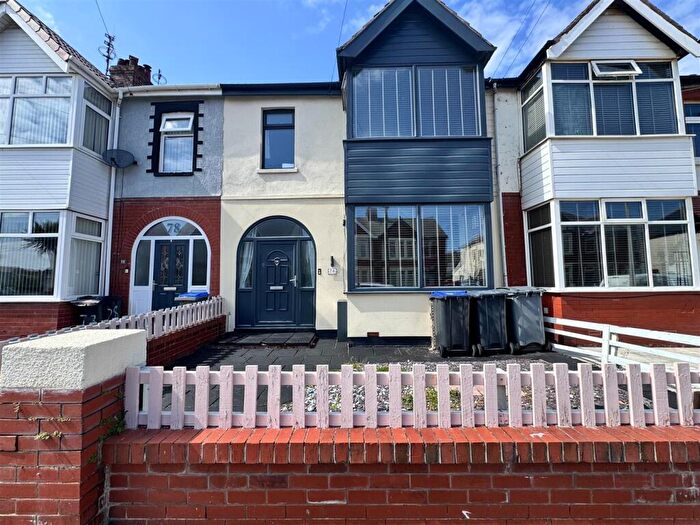
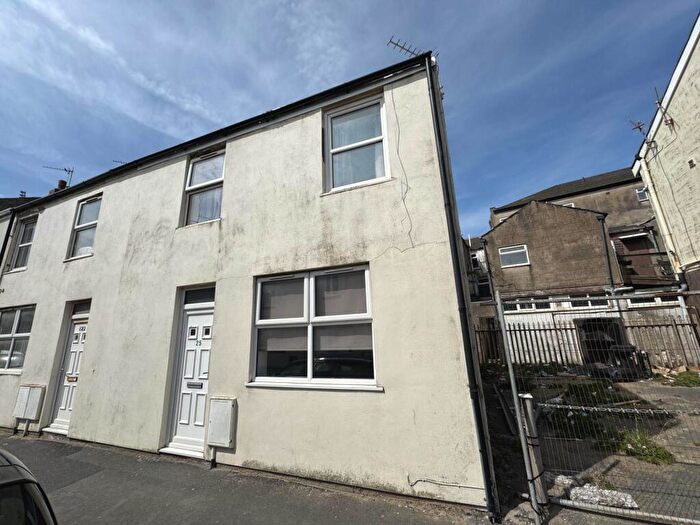
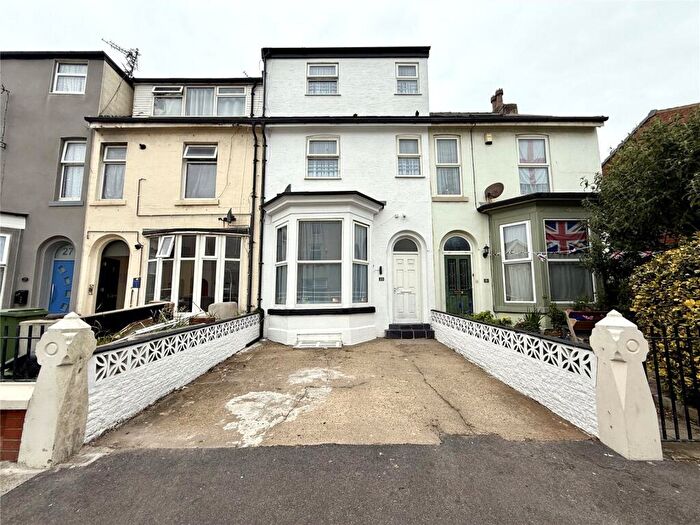
Houses for sale & to rent in Waterloo, Blackpool
House Prices in Waterloo
Properties in Waterloo have an average house price of £161,354.00 and had 346 Property Transactions within the last 3 years¹.
Waterloo is an area in Blackpool, Blackpool with 2,940 households², where the most expensive property was sold for £515,000.00.
Properties for sale in Waterloo
Roads and Postcodes in Waterloo
Navigate through our locations to find the location of your next house in Waterloo, Blackpool for sale or to rent.
| Streets | Postcodes |
|---|---|
| Arlington Avenue | FY4 1EL |
| Arnold Avenue | FY4 2BQ FY4 2EN FY4 2EP FY4 2EW |
| Balmoral Road | FY4 1HR |
| Bamton Avenue | FY4 2DN |
| Bath Street | FY4 1BT |
| Beverley Grove | FY4 2BE FY4 2BG |
| Bond Street | FY4 1BQ FY4 1BW FY4 1EX FY4 1EY FY4 1HG FY4 1HW FY4 1HU |
| Bright Street | FY4 1BS |
| Brighton Avenue | FY4 1HL |
| Broadway | FY4 2HE FY4 2HF |
| Burlington Road | FY4 1JR FY4 1JS FY4 1JU |
| Burlington Road West | FY4 1NL FY4 1NY |
| Byron Street | FY4 1DE FY4 1DD |
| Carlyle Avenue | FY4 1PF FY4 1PG |
| Clifton Drive | FY4 1NT FY4 1NU FY4 1NX FY4 1SW FY4 1ND FY4 1NE FY4 1NP FY4 1TH |
| Coniston Road | FY4 2BY |
| Dean Street | FY4 1AU FY4 1BP |
| Eastbourne Road | FY4 1LG |
| Fenber Avenue | FY4 2DL |
| Fifth Avenue | FY4 2ES |
| First Avenue | FY4 2EY |
| Fourth Avenue | FY4 2ET |
| Garden Terrace | FY4 2AD |
| Gordon Street | FY4 1AJ |
| Grundy Mews | FY4 2AX |
| Hampton Road | FY4 1JB |
| Harrowside West | FY4 1NW |
| Hill Street | FY4 1DF FY4 1DG |
| Horncliffe Road | FY4 1LJ FY4 1LL |
| Jesmond Avenue | FY4 1EJ |
| Kenilworth Gardens | FY4 1JJ FY4 1JL |
| Kingsway | FY4 2DF |
| Lawrence Street | FY4 1BU |
| Lytham Road | FY4 1DP FY4 1DR FY4 1DS FY4 1DW FY4 1EA FY4 1EB FY4 1JD FY4 1JE FY4 1JH FY4 1JQ FY4 1DY FY4 1EW FY4 1JA FY4 1JF FY4 1TL |
| Mersey Road | FY4 1EN |
| Montague Street | FY4 1AT |
| Moore Street | FY4 1DA FY4 1DB |
| Napier Avenue | FY4 1PA FY4 1PB |
| New South Promenade | FY4 1NF FY4 1NG |
| Ocean Boulevard | FY4 1EZ FY4 1PL |
| Osborne Road | FY4 1GY FY4 1HJ FY4 1HQ |
| Princeway | FY4 2DQ |
| Promenade | FY4 1AZ FY4 1BA FY4 1AR |
| Queensway | FY4 2DG |
| Rangeway Avenue | FY4 2DJ |
| Rawcliffe Street | FY4 1BX FY4 1BY FY4 1BZ FY4 1DJ FY4 1DL |
| Rosebery Avenue | FY4 1LA FY4 1LB |
| Sackville Avenue | FY4 2DX |
| Seabourne Avenue | FY4 1EH |
| Second Avenue | FY4 2EX |
| Seventh Avenue | FY4 2EB FY4 2ED |
| Severn Road | FY4 1EE |
| Simpson Street | FY4 1HS |
| Sixth Avenue | FY4 2ER |
| St Annes Road | FY4 2BL |
| St James Road | FY4 2DU |
| St Lukes Road | FY4 2EG FY4 2EH FY4 2EJ FY4 2EL FY4 2EQ |
| St Martins Road | FY4 2DT FY4 2DZ |
| Stamford Avenue | FY4 2BH FY4 2BJ |
| Station Road | FY4 1BE FY4 1EU FY4 1AL |
| Station Terrace | FY4 1HT |
| Talbot Court | FY4 1AP |
| Thames Road | FY4 1ED |
| The Crescent | FY4 1EQ |
| Third Avenue | FY4 2EU |
| Thirlmere Road | FY4 2DA |
| Trent Road | FY4 1EF |
| Tudor Place | FY4 1PQ |
| Ullswater Road | FY4 2BZ |
| Ventnor Road | FY4 1JN FY4 1LD FY4 1LE |
| Waterloo Road | FY4 1AD FY4 1AG FY4 1AF FY4 2AB |
| Watson Road | FY4 1EG FY4 2BP FY4 2DB FY4 2DD FY4 2DE |
| Wimbourne Place | FY4 1PD FY4 1NN |
| Windermere Road | FY4 2BX |
| Windsor Avenue | FY4 1HN |
| Withnell Road | FY4 1HE FY4 1HF FY4 1AH |
| Woodstock Gardens | FY4 1JP FY4 1JW |
| Worsley Avenue | FY4 2DH |
| Yeadon Way | FY1 6BF |
| FY4 1AX FY4 1AY FY4 1BB FY4 1NJ |
Transport near Waterloo
-
Blackpool Pleasure Beach Station
-
Blackpool South Station
-
Squires Gate Station
-
Blackpool North Station
-
St.Annes-On-The-Sea Station
- FAQ
- Price Paid By Year
- Property Type Price
Frequently asked questions about Waterloo
What is the average price for a property for sale in Waterloo?
The average price for a property for sale in Waterloo is £161,354. This amount is 19% higher than the average price in Blackpool. There are 2,161 property listings for sale in Waterloo.
What streets have the most expensive properties for sale in Waterloo?
The streets with the most expensive properties for sale in Waterloo are Windermere Road at an average of £342,333, Fourth Avenue at an average of £335,000 and Seventh Avenue at an average of £275,166.
What streets have the most affordable properties for sale in Waterloo?
The streets with the most affordable properties for sale in Waterloo are Byron Street at an average of £48,500, St James Road at an average of £63,983 and Bath Street at an average of £65,000.
Which train stations are available in or near Waterloo?
Some of the train stations available in or near Waterloo are Blackpool Pleasure Beach, Blackpool South and Squires Gate.
Property Price Paid in Waterloo by Year
The average sold property price by year was:
| Year | Average Sold Price | Price Change |
Sold Properties
|
|---|---|---|---|
| 2025 | £184,133 | 11% |
12 Properties |
| 2024 | £163,461 | 2% |
105 Properties |
| 2023 | £159,625 | 0,5% |
97 Properties |
| 2022 | £158,878 | -1% |
132 Properties |
| 2021 | £160,434 | 18% |
150 Properties |
| 2020 | £132,068 | -9% |
99 Properties |
| 2019 | £143,476 | 2% |
97 Properties |
| 2018 | £140,407 | 10% |
109 Properties |
| 2017 | £126,870 | -7% |
94 Properties |
| 2016 | £135,384 | 16% |
116 Properties |
| 2015 | £113,541 | -5% |
106 Properties |
| 2014 | £119,132 | 9% |
82 Properties |
| 2013 | £108,876 | -14% |
57 Properties |
| 2012 | £124,189 | -2% |
49 Properties |
| 2011 | £127,172 | -1% |
71 Properties |
| 2010 | £128,340 | 2% |
63 Properties |
| 2009 | £125,670 | -22% |
68 Properties |
| 2008 | £153,895 | 5% |
126 Properties |
| 2007 | £146,048 | 1% |
185 Properties |
| 2006 | £144,956 | 6% |
193 Properties |
| 2005 | £136,311 | 5% |
137 Properties |
| 2004 | £129,872 | 25% |
203 Properties |
| 2003 | £97,277 | 16% |
242 Properties |
| 2002 | £81,316 | 18% |
238 Properties |
| 2001 | £66,619 | 2% |
182 Properties |
| 2000 | £65,076 | 9% |
142 Properties |
| 1999 | £59,213 | 7% |
143 Properties |
| 1998 | £55,133 | 4% |
112 Properties |
| 1997 | £53,111 | -37% |
128 Properties |
| 1996 | £73,010 | 31% |
110 Properties |
| 1995 | £50,644 | - |
99 Properties |
Property Price per Property Type in Waterloo
Here you can find historic sold price data in order to help with your property search.
The average Property Paid Price for specific property types in the last three years are:
| Property Type | Average Sold Price | Sold Properties |
|---|---|---|
| Flat | £81,026.00 | 46 Flats |
| Semi Detached House | £188,191.00 | 164 Semi Detached Houses |
| Detached House | £292,097.00 | 23 Detached Houses |
| Terraced House | £128,494.00 | 113 Terraced Houses |

