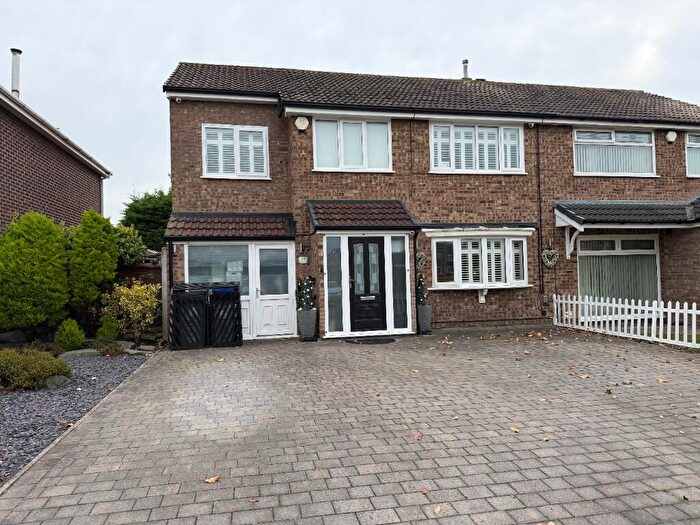
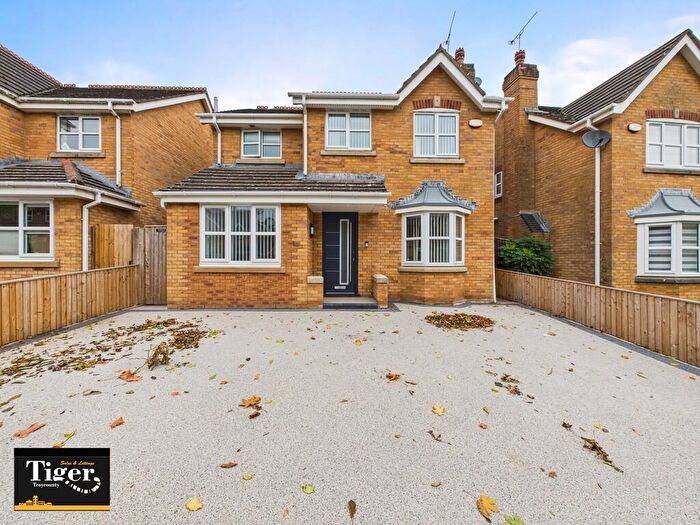
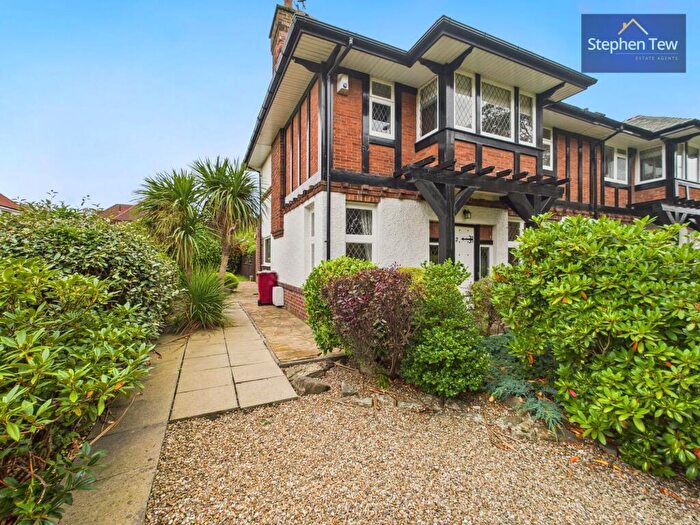
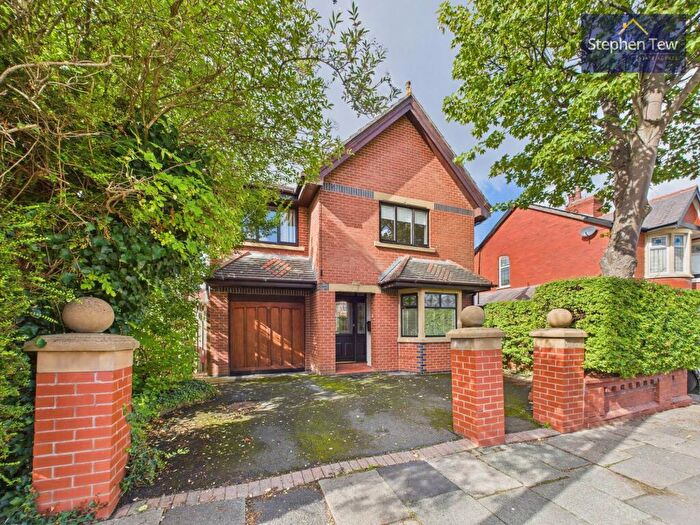
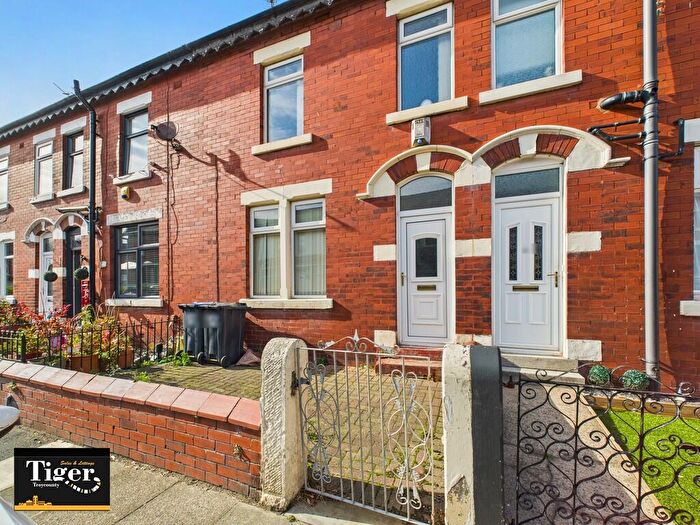
Houses for sale & to rent in Marton, Blackpool
House Prices in Marton
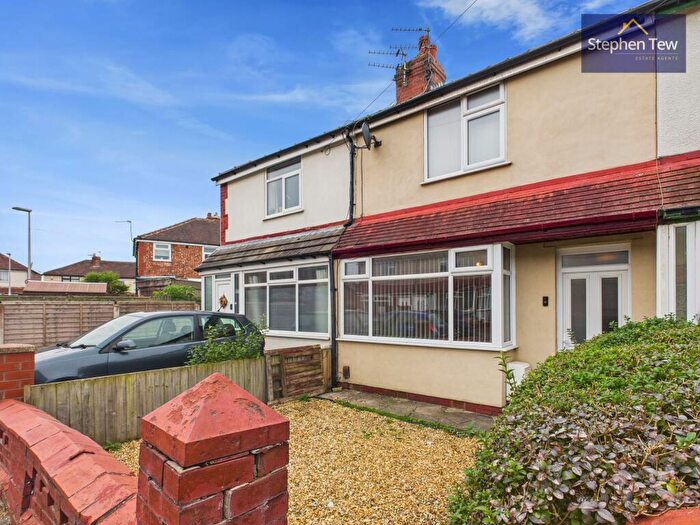
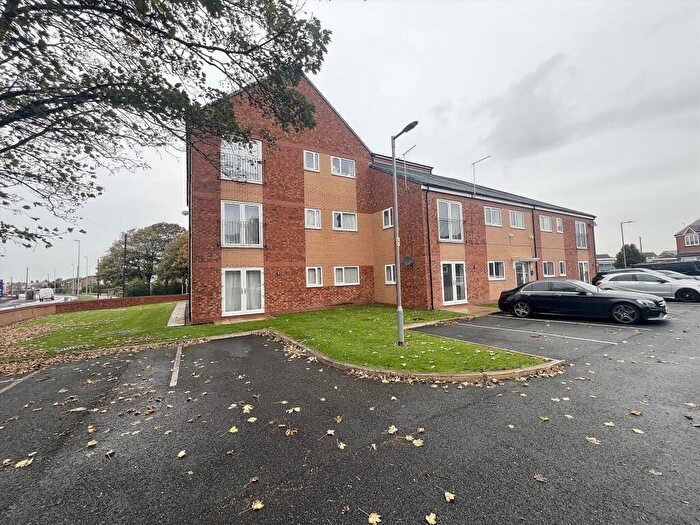
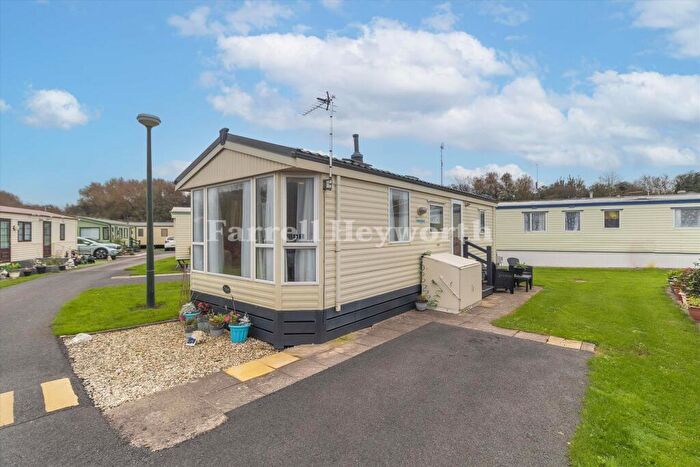
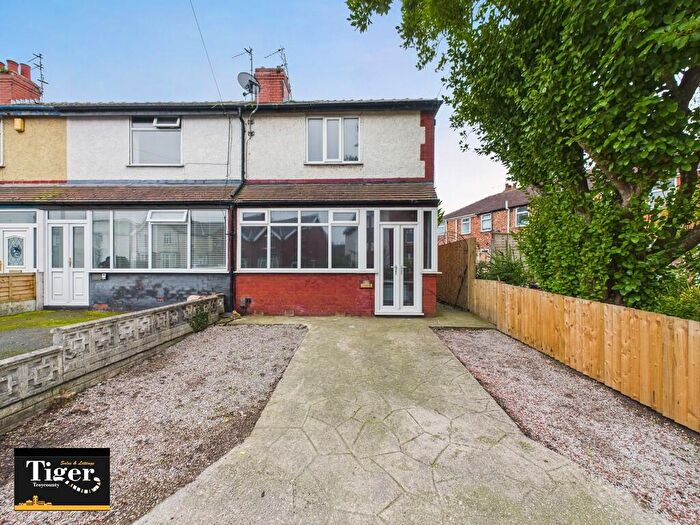
Properties in Marton have an average house price of £149,366.00 and had 500 Property Transactions within the last 3 years¹.
Marton is an area in Blackpool, Blackpool with 3,007 households², where the most expensive property was sold for £575,000.00.
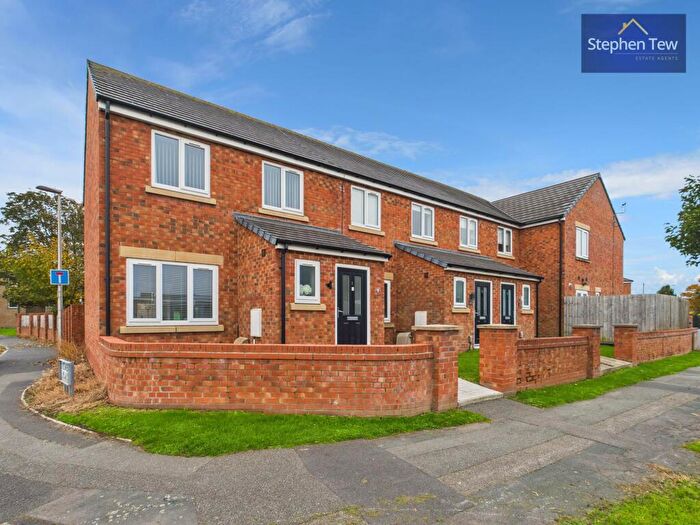
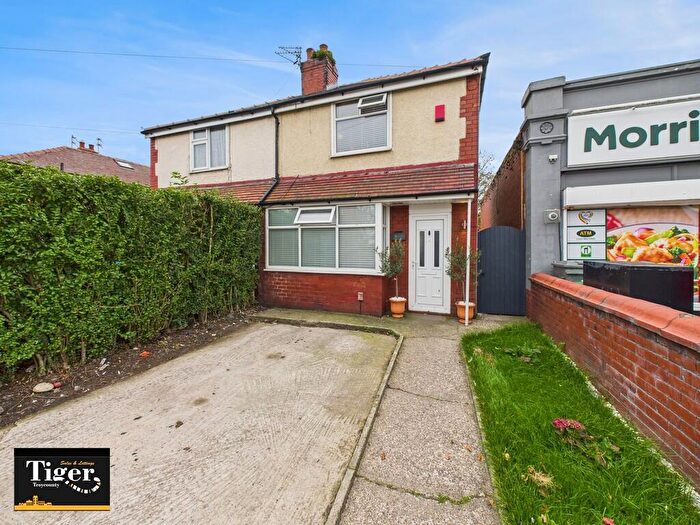
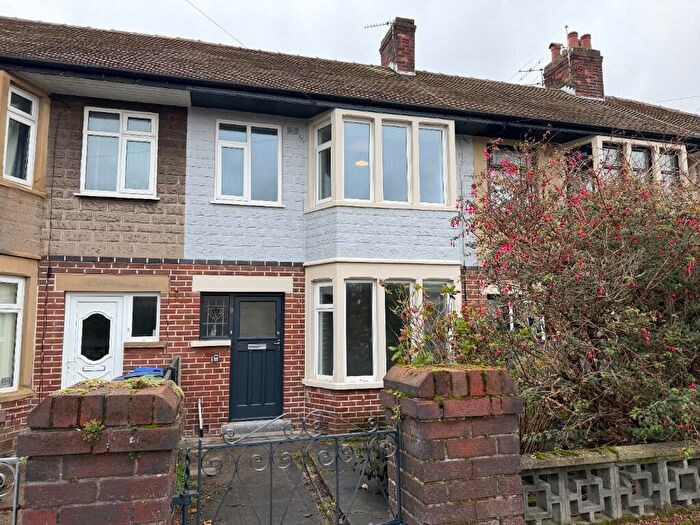
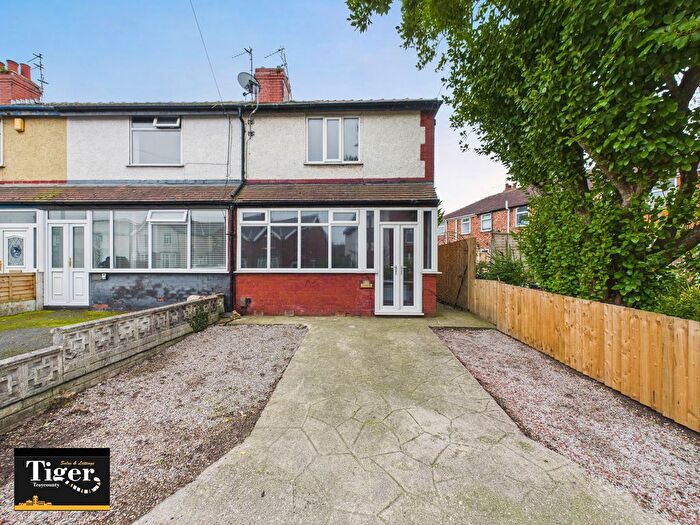
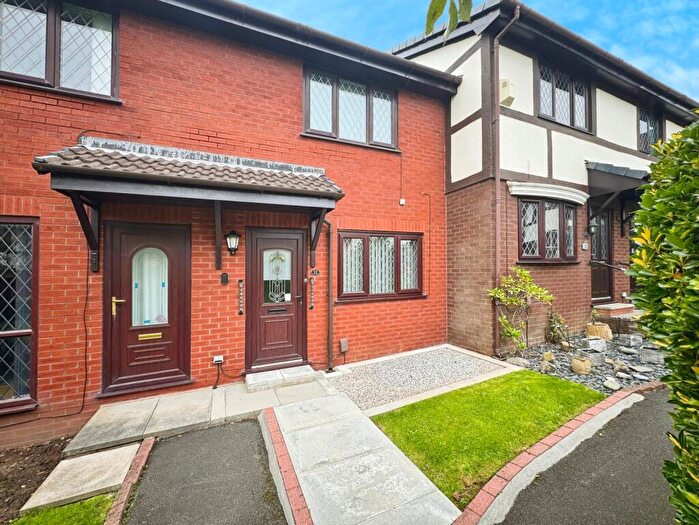
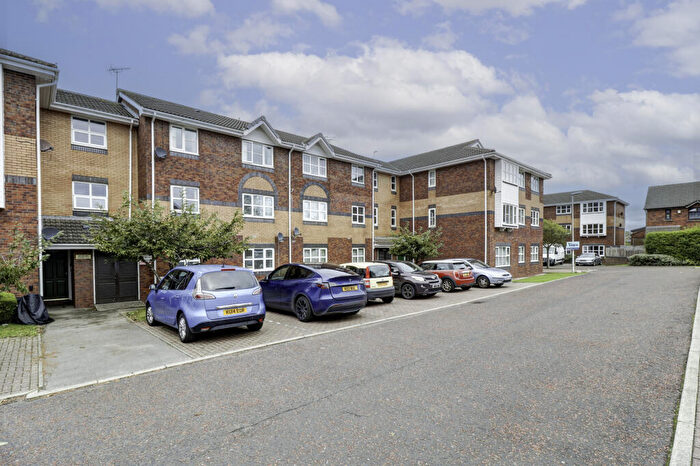
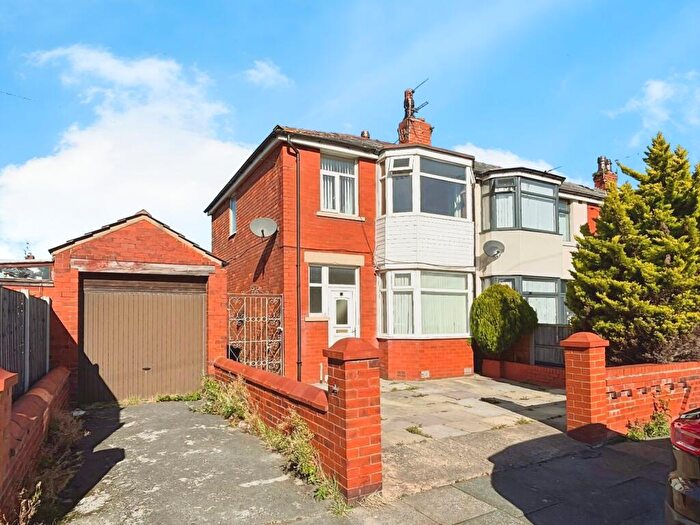
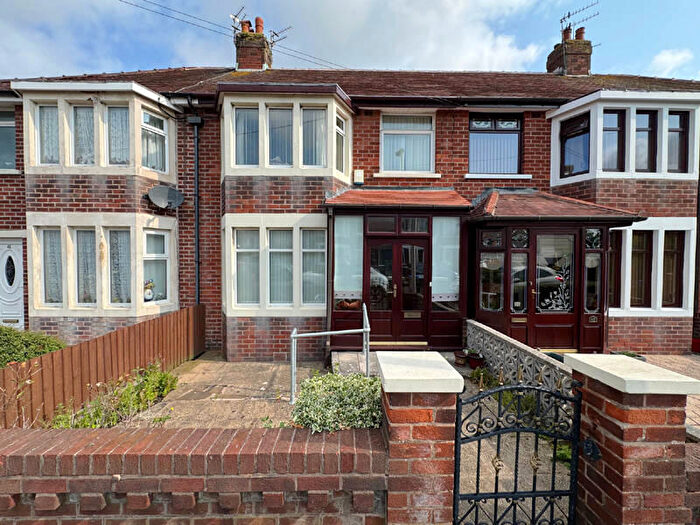
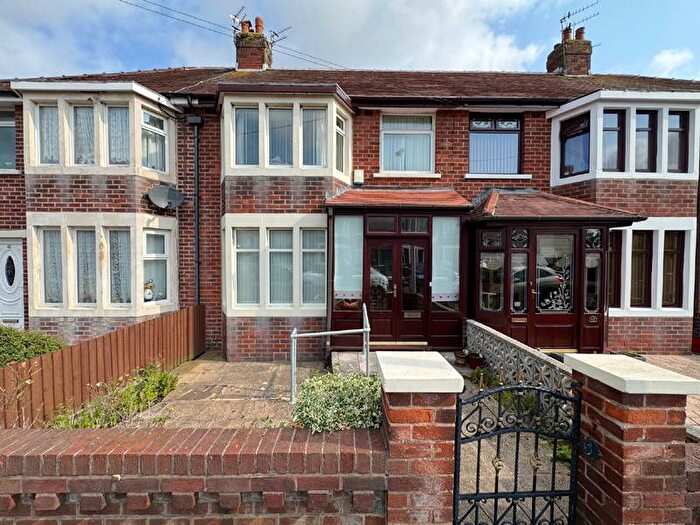
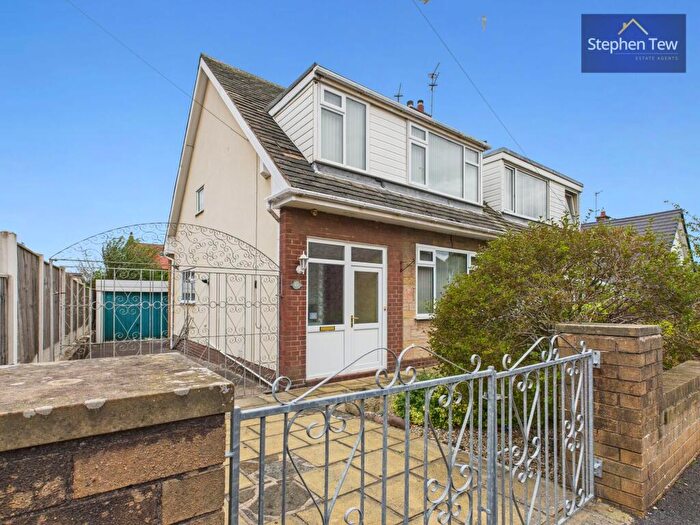
Properties for sale in Marton
Roads and Postcodes in Marton
Navigate through our locations to find the location of your next house in Marton, Blackpool for sale or to rent.
| Streets | Postcodes |
|---|---|
| Abbotsford Road | FY3 9RX FY3 9RY |
| Ackroyd Place | FY4 4ZD |
| Airedale Avenue | FY3 9LH |
| Aldwych Avenue | FY3 9LQ |
| Allenbury Place | FY3 9NN |
| Ash Close | FY3 9TT |
| Barmouth Avenue | FY3 9SL |
| Bassenthwaite Road | FY3 9UJ |
| Beechfield Avenue | FY3 9JH FY3 9JJ FY3 9JQ |
| Birchtree Gardens | FY3 9XF |
| Briercliffe Avenue | FY3 9LY |
| Briercliffe Mews | FY3 9QD |
| Broad Oak Lane | FY3 0BZ |
| Cadby Avenue | FY3 9RP |
| Camborne Court | FY3 9NS |
| Canterbury Avenue | FY3 9PT |
| Carsluith Avenue | FY3 9LJ |
| Chiswick Grove | FY3 9EU FY3 9TW |
| Clifton Crescent | FY3 9NQ |
| Colchester Road | FY3 9RL |
| Cornwall Place | FY3 9NR |
| Crosby Grove | FY3 9PU |
| Dalkeith Avenue | FY3 9SA FY3 9SB FY3 9SS |
| Doncaster Road | FY3 9SQ FY3 9TA |
| Dovedale Avenue | FY3 9UA |
| Dryburgh Avenue | FY3 9RH |
| Dunmail Avenue | FY3 9PQ |
| East Mead | FY3 9LN |
| East Park Drive | FY3 9RS FY3 8LL FY3 8PP FY3 9RB |
| Elterwater Place | FY3 9UH |
| Fredora Avenue | FY3 9NL |
| Garden Close | FY3 9TL |
| Godwin Avenue | FY3 9LG |
| Goldsboro Avenue | FY3 9RJ FY3 9RR |
| Halifax Street | FY3 9QH FY3 9QQ |
| Haslemere Avenue | FY3 9JG |
| Hereford Avenue | FY3 9LL |
| Higham Grove | FY3 9LZ |
| Honister Avenue | FY3 9PF |
| Kelmarsh Close | FY3 9UY |
| Kingsley Road | FY3 9UP FY3 9US |
| Kipling Drive | FY3 9UB FY3 9UF FY3 9UG FY3 9UX FY3 9XA FY3 9XD FY3 9TH |
| Knaresboro Avenue | FY3 9QW |
| Knutsford Road | FY3 9UU |
| Lancaster Road | FY3 9SR FY3 9ST |
| Lark Close | FY3 9PB |
| Latham Avenue | FY3 9PP |
| Lawnswood Crescent | FY3 9UQ |
| Lawson Road | FY3 9RT FY3 9TB FY3 9TD |
| Lightbown Avenue | FY3 9JN |
| Lindsay Avenue | FY3 9LB FY3 9LD |
| Lodge Court | FY3 0EH |
| Lomond Avenue | FY3 9NB FY3 9QL |
| Lovejoy Close | FY4 4ZH |
| Lulworth Avenue | FY3 9SN |
| Marples Drive | FY4 4ZA |
| Meadowbrook | FY3 9UE |
| Mereland Road | FY3 9NF |
| Metropolitan Business Park | FY3 9LT |
| Metropolitan Drive | FY3 9JD |
| Moorland Court | FY4 4ZE |
| Mythop Road | FY4 4UU FY4 4UZ FY4 4XN |
| Newlands Avenue | FY3 9PG |
| Norfolk Road | FY3 9NW |
| North Park Drive | FY3 8LS |
| Paddock Drive | FY3 9TZ |
| Palmerston Close | FY4 4ZG |
| Patterdale Avenue | FY3 9QR FY3 9QT FY3 9QU |
| Pine Crescent | FY3 9TX |
| Pittsdale Avenue | FY3 9QS |
| Prescot Place | FY3 9TE |
| Preston New Road | FY3 9LU FY3 9LX FY3 9NA FY3 9ND FY3 9NE FY3 9NG FY3 9NJ FY3 9TN FY3 9TU FY3 9TY |
| Preston Old Road | FY3 9NU FY3 9PL FY3 9PR FY3 9QG FY3 9QJ FY3 9QP FY3 9QX FY3 9QY FY3 9SE FY3 9SG FY3 9SP FY3 9TF FY3 9UN FY3 9UW FY3 9UZ FY3 9SF |
| Quernmore Avenue | FY3 9SU |
| Rosefinch Court | FY3 9PD |
| Rosefinch Way | FY3 9NX FY3 9NY |
| Royal Avenue | FY3 9PS |
| Royal Bank Road | FY3 9LE FY3 9LF FY3 9PW |
| Skelwith Road | FY3 9UL |
| South Park Drive | FY3 9PX FY3 9PY FY3 9PZ FY3 9QA |
| Southbourne Road | FY3 9SH FY3 9SW |
| St Leonards Road | FY3 9RE FY3 9RF FY3 9RG FY3 9RU |
| Stanley Park Close | FY3 9TR |
| Stock Road | FY4 4ZF |
| Suffolk Road | FY3 9NP |
| Swallow Close | FY3 9NZ |
| Swift Close | FY3 9PE |
| The Square | FY3 9NH |
| Torquay Avenue | FY3 9SJ |
| West Park Drive | FY3 9LW FY3 9EQ FY3 9HQ |
| Weymouth Road | FY3 9RN FY3 9RW |
| Wheatlands Crescent | FY3 9UD |
| Whitegate Drive | FY3 9JW |
| Willow Way | FY3 9TQ |
| Worcester Road | FY3 9RQ FY3 9SX FY3 9SY FY3 9SZ |
| Wordsworth Avenue | FY3 9UR FY3 9UT |
| Wren Grove | FY3 9PN |
| FY3 9ZJ FY3 9ZL FY3 9ZP FY3 9ZQ FY3 9ZR FY3 9ZS |
Transport near Marton
-
Blackpool South Station
-
Blackpool North Station
-
Blackpool Pleasure Beach Station
-
Layton Station
-
Squires Gate Station
- FAQ
- Price Paid By Year
- Property Type Price
Frequently asked questions about Marton
What is the average price for a property for sale in Marton?
The average price for a property for sale in Marton is £149,366. This amount is 11% higher than the average price in Blackpool. There are 1,156 property listings for sale in Marton.
What streets have the most expensive properties for sale in Marton?
The streets with the most expensive properties for sale in Marton are East Park Drive at an average of £317,500, Lark Close at an average of £270,390 and Preston New Road at an average of £261,363.
What streets have the most affordable properties for sale in Marton?
The streets with the most affordable properties for sale in Marton are Higham Grove at an average of £61,600, Norfolk Road at an average of £86,427 and Suffolk Road at an average of £88,000.
Which train stations are available in or near Marton?
Some of the train stations available in or near Marton are Blackpool South, Blackpool North and Blackpool Pleasure Beach.
Property Price Paid in Marton by Year
The average sold property price by year was:
| Year | Average Sold Price | Price Change |
Sold Properties
|
|---|---|---|---|
| 2025 | £156,809 | 3% |
48 Properties |
| 2024 | £152,085 | 4% |
145 Properties |
| 2023 | £146,005 | -1% |
147 Properties |
| 2022 | £147,758 | 10% |
160 Properties |
| 2021 | £133,571 | -16% |
165 Properties |
| 2020 | £155,084 | 11% |
147 Properties |
| 2019 | £138,044 | 5% |
158 Properties |
| 2018 | £131,021 | 6% |
118 Properties |
| 2017 | £122,539 | 3% |
127 Properties |
| 2016 | £119,304 | 6% |
110 Properties |
| 2015 | £112,584 | -1% |
90 Properties |
| 2014 | £113,866 | -2% |
99 Properties |
| 2013 | £116,106 | 8% |
86 Properties |
| 2012 | £106,578 | -10% |
71 Properties |
| 2011 | £117,652 | 1% |
85 Properties |
| 2010 | £116,037 | 5% |
56 Properties |
| 2009 | £110,146 | -17% |
75 Properties |
| 2008 | £129,404 | -8% |
92 Properties |
| 2007 | £140,191 | 7% |
204 Properties |
| 2006 | £130,135 | -2% |
204 Properties |
| 2005 | £132,324 | 15% |
169 Properties |
| 2004 | £113,044 | 19% |
226 Properties |
| 2003 | £91,638 | 25% |
234 Properties |
| 2002 | £68,557 | 21% |
238 Properties |
| 2001 | £54,365 | 6% |
202 Properties |
| 2000 | £51,045 | 1% |
162 Properties |
| 1999 | £50,455 | 2% |
162 Properties |
| 1998 | £49,403 | 6% |
138 Properties |
| 1997 | £46,614 | 5% |
160 Properties |
| 1996 | £44,378 | -1% |
145 Properties |
| 1995 | £44,837 | - |
156 Properties |
Property Price per Property Type in Marton
Here you can find historic sold price data in order to help with your property search.
The average Property Paid Price for specific property types in the last three years are:
| Property Type | Average Sold Price | Sold Properties |
|---|---|---|
| Flat | £76,384.00 | 26 Flats |
| Semi Detached House | £161,130.00 | 202 Semi Detached Houses |
| Detached House | £261,327.00 | 53 Detached Houses |
| Terraced House | £120,085.00 | 219 Terraced Houses |

