
Houses for sale & to rent in FY3 9NA, Preston New Road, Marton, Blackpool
House Prices in FY3 9NA, Preston New Road, Marton
Properties in FY3 9NA have no sales history available within the last 3 years. FY3 9NA is a postcode in Preston New Road located in Marton, an area in Blackpool, Blackpool, with 6 households².
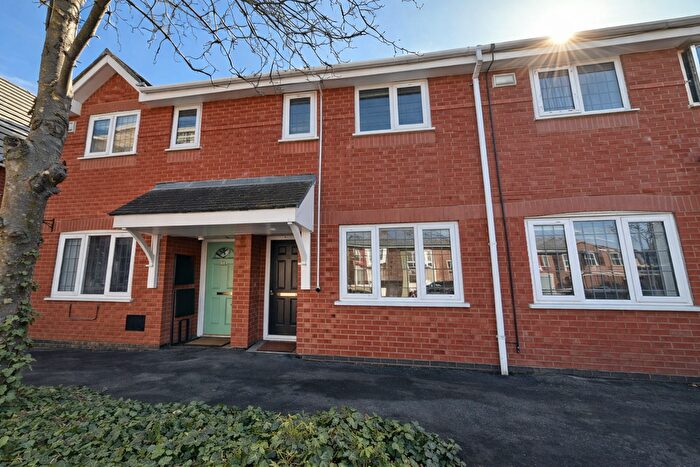
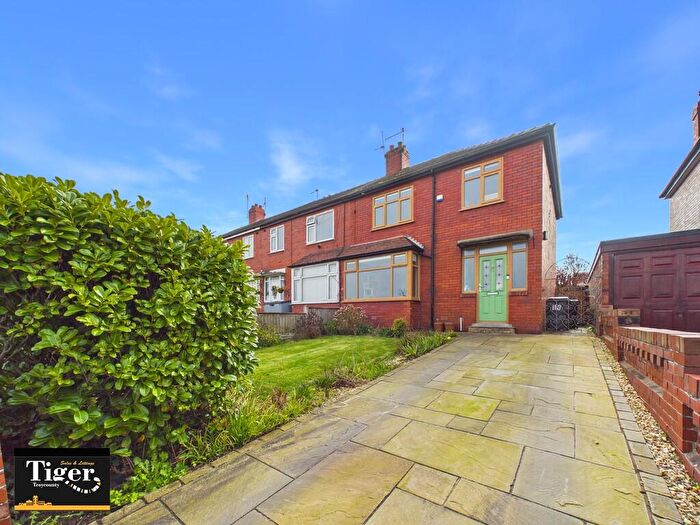
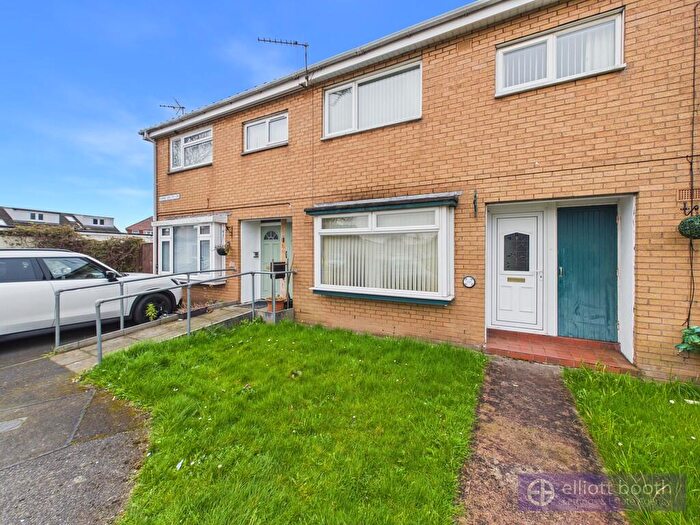
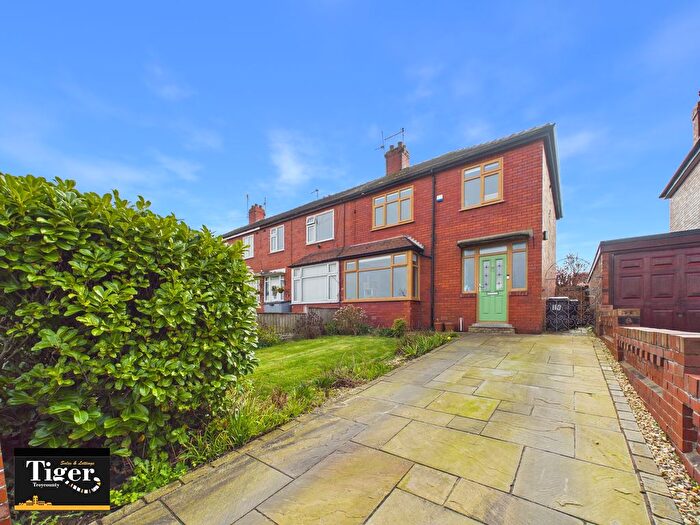
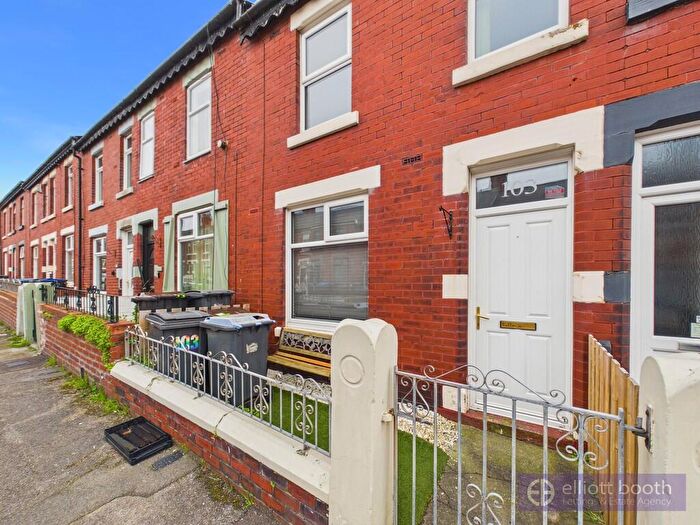
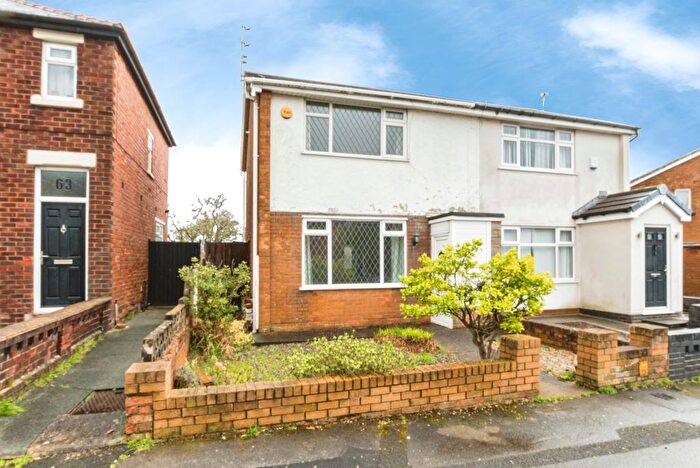
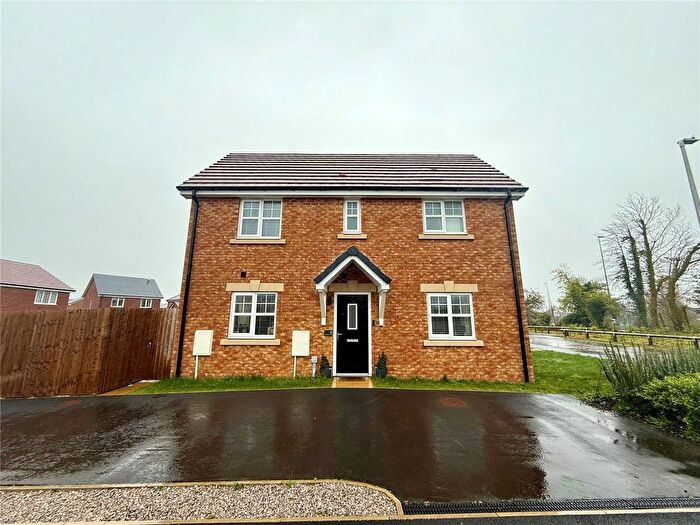
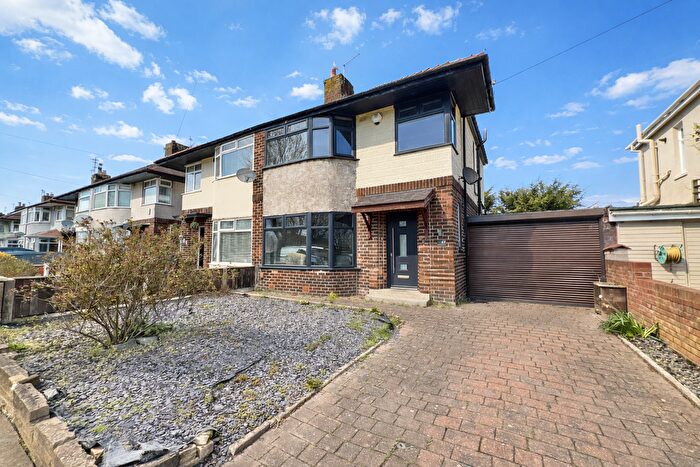
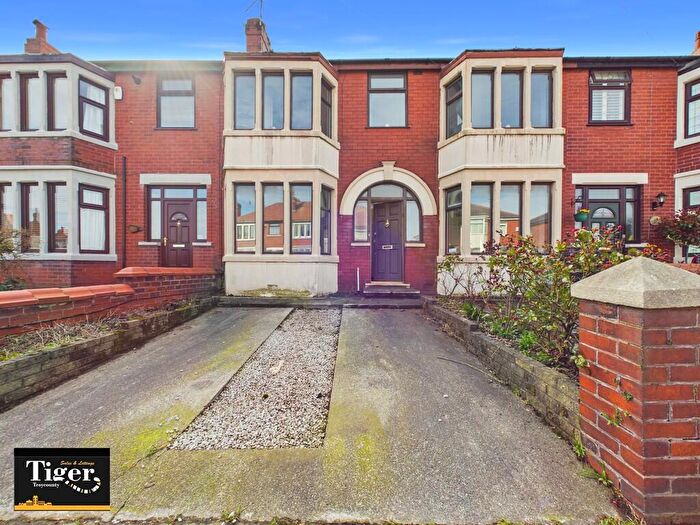
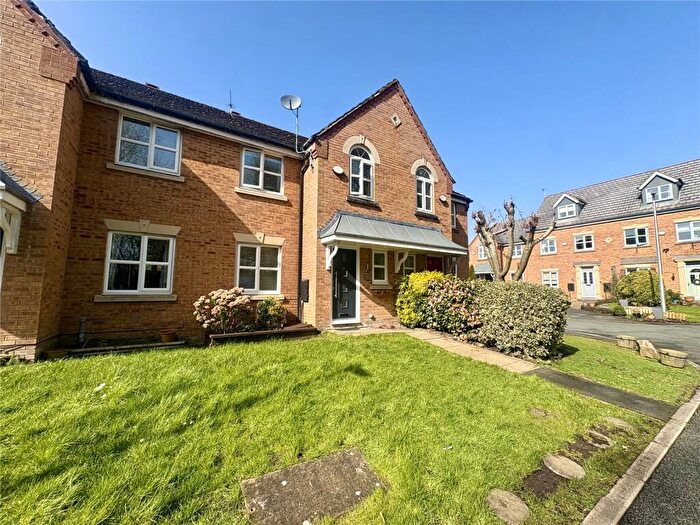
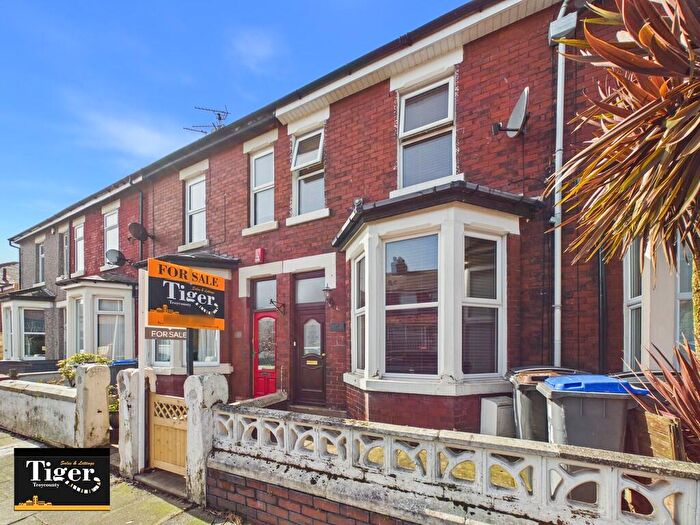
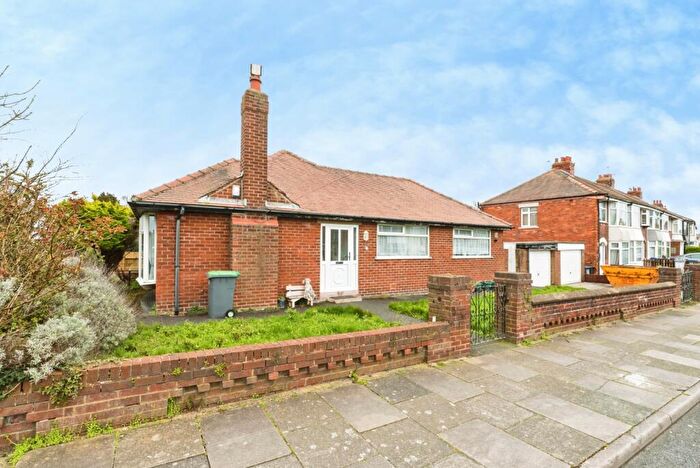
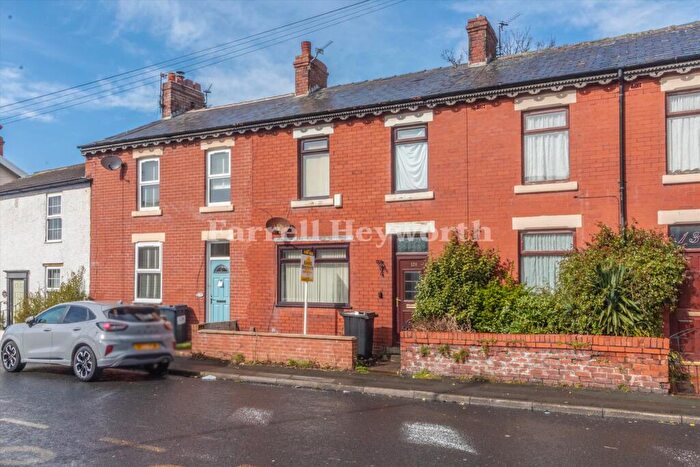
Properties for sale near FY3 9NA, Preston New Road
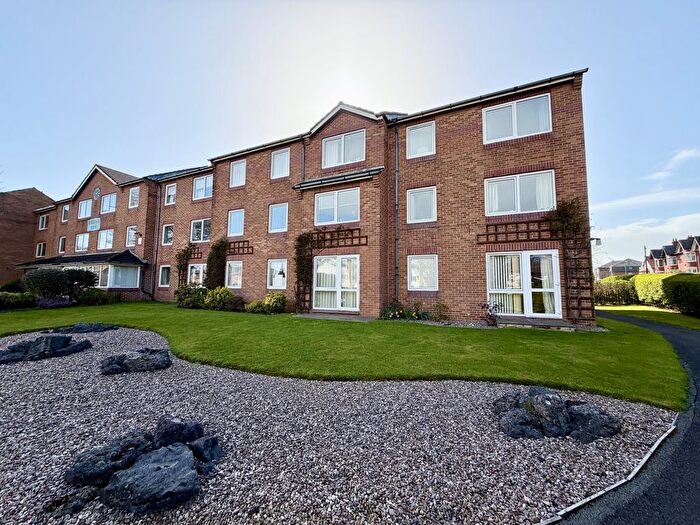
![]()
If you are looking to sell your house, let it out, or receive a property valuation, an expert can help you.
Click the button below to get started.


Price Paid in Preston New Road, FY3 9NA, Marton
45 Preston New Road, FY3 9NA, Marton Blackpool
Property 45 has been sold 2 times. The last time it was sold was in 23/06/2008 and the sold price was £155,000.00.
This is a Semi Detached House which was sold as a freehold in 23/06/2008
| Date | Price | Property Type | Tenure | Classification |
|---|---|---|---|---|
| 23/06/2008 | £155,000.00 | Semi Detached House | freehold | Established Building |
| 24/11/1997 | £78,500.00 | Semi Detached House | freehold | Established Building |
51 Preston New Road, FY3 9NA, Marton Blackpool
Property 51 has been sold 2 times. The last time it was sold was in 26/08/2005 and the sold price was £189,950.00.
This semi detached house, sold as a freehold on 26/08/2005, is a 113 sqm semi-detached house with an EPC rating of D.
| Date | Price | Property Type | Tenure | Classification |
|---|---|---|---|---|
| 26/08/2005 | £189,950.00 | Semi Detached House | freehold | Established Building |
| 01/07/1998 | £75,000.00 | Semi Detached House | freehold | Established Building |
Postcodes in Preston New Road, Marton
Navigate through other locations in Preston New Road, Marton, Blackpool to see more property listings for sale or to rent.
Transport near FY3 9NA, Preston New Road
-
 Blackpool South Station
 -
Blackpool North Station
-
Blackpool Pleasure Beach Station
-
Layton Station
-
Squires Gate Station
House price paid reports for FY3 9NA, Preston New Road
Click on the buttons below to see price paid reports by year or property price:
- Price Paid By Year
Property Price Paid in FY3 9NA, Preston New Road by Year
The average sold property price by year was:
| Year | Average Sold Price | Price Change |
Sold Properties
|
|---|---|---|---|
| 2008 | £155,000 | -23% |
1 Property |
| 2005 | £189,950 | 61% |
1 Property |
| 1998 | £75,000 | -5% |
1 Property |
| 1997 | £78,500 | - |
1 Property |