
Houses for sale & to rent in FY3 7TY, Dinmore Avenue, Park, Blackpool
House Prices in FY3 7TY, Dinmore Avenue, Park
Properties in FY3 7TY have no sales history available within the last 3 years. FY3 7TY is a postcode in Dinmore Avenue located in Park, an area in Blackpool, Blackpool, with 13 households².
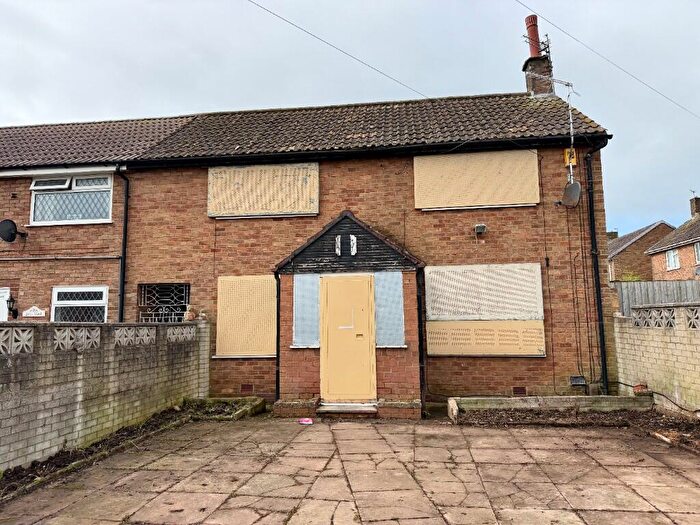
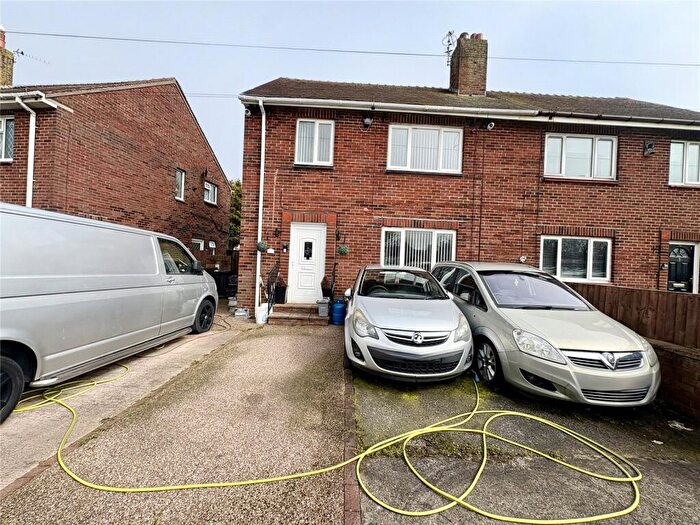
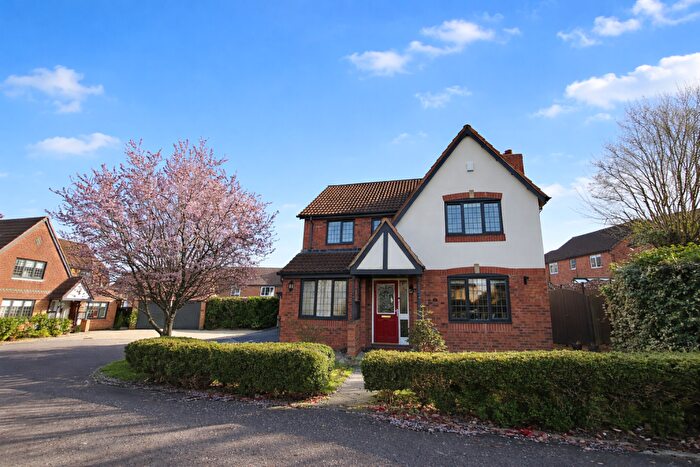
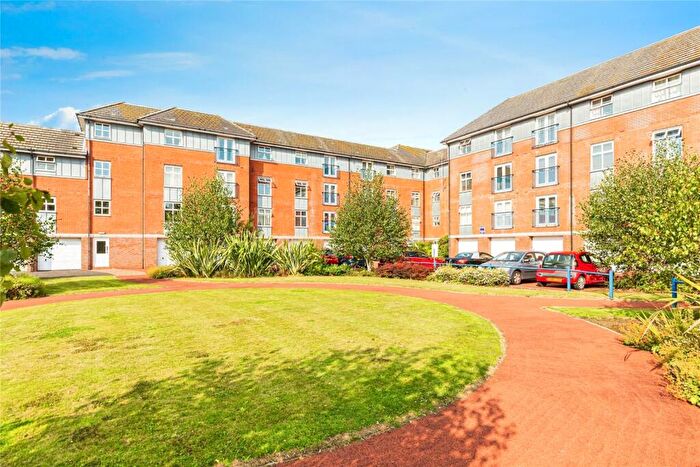
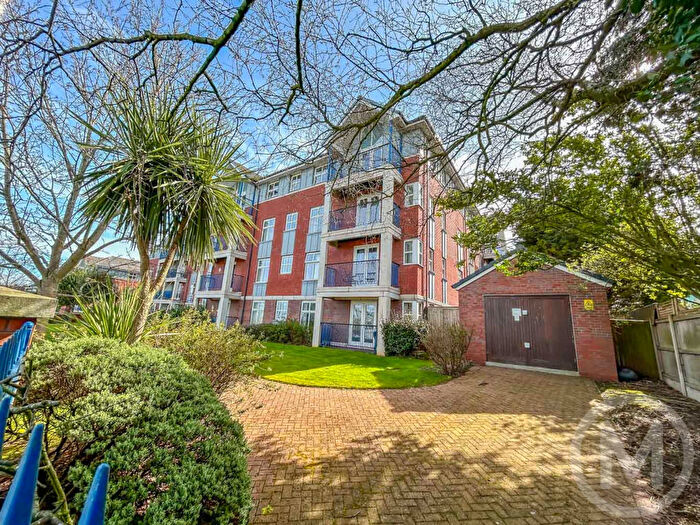
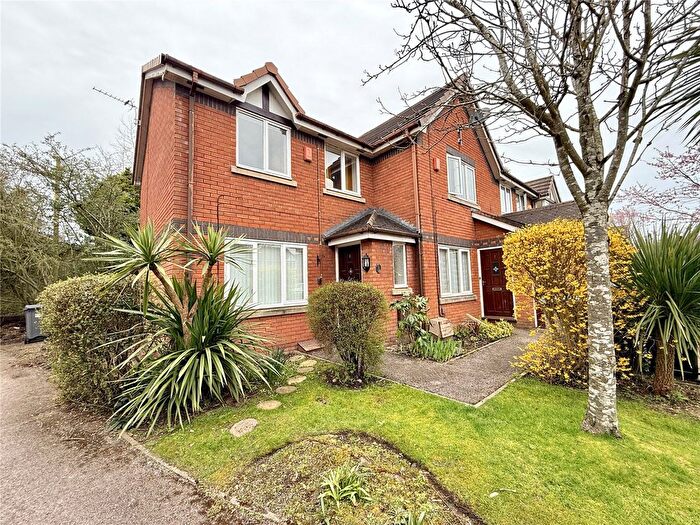
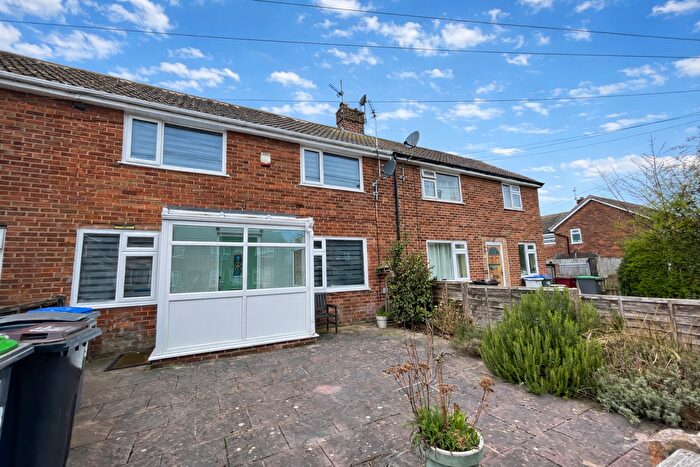
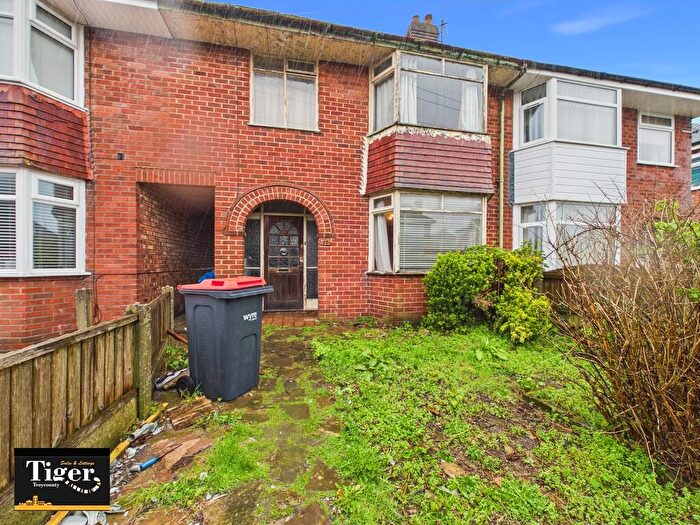
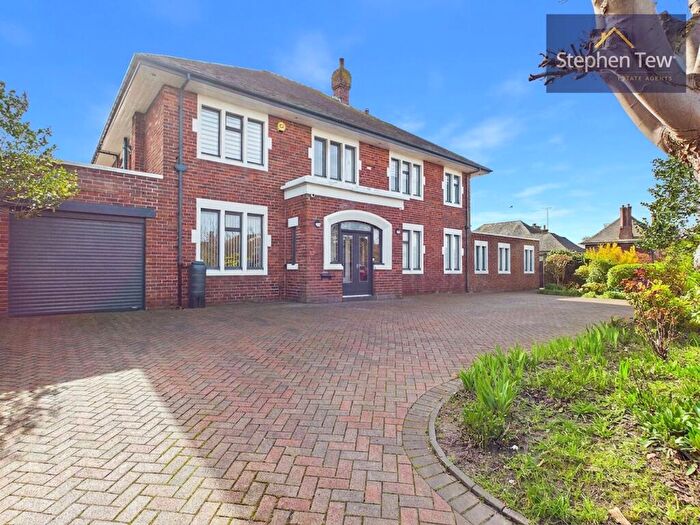
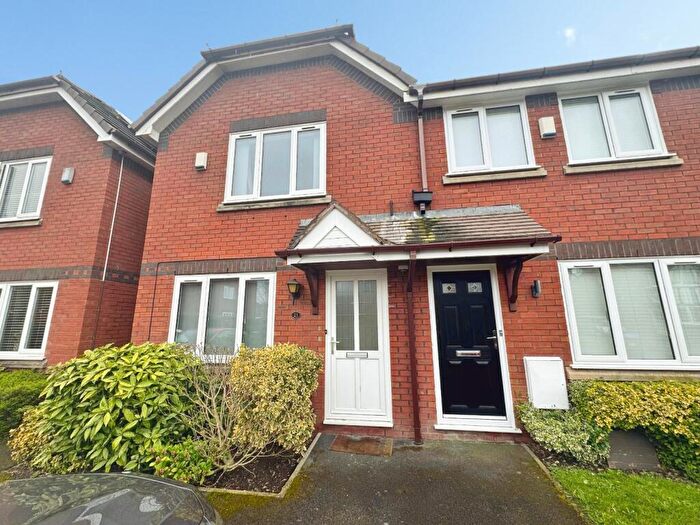
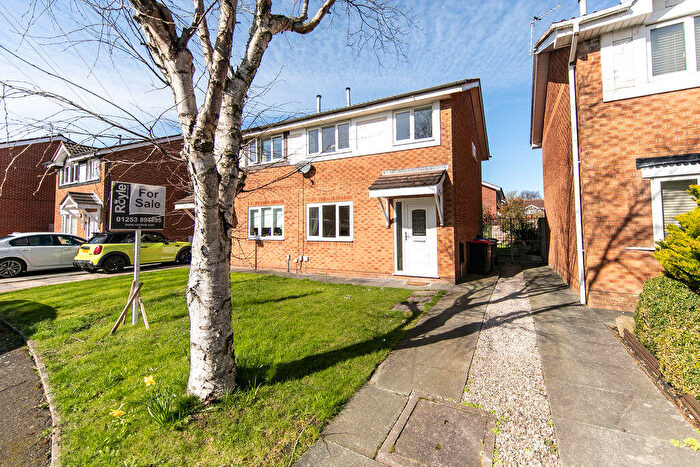
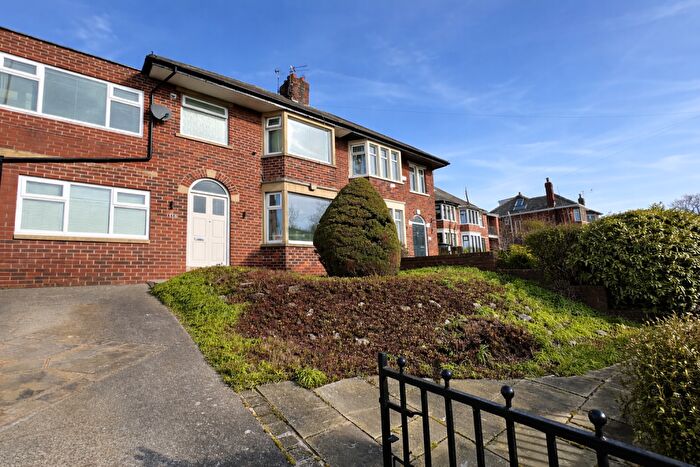
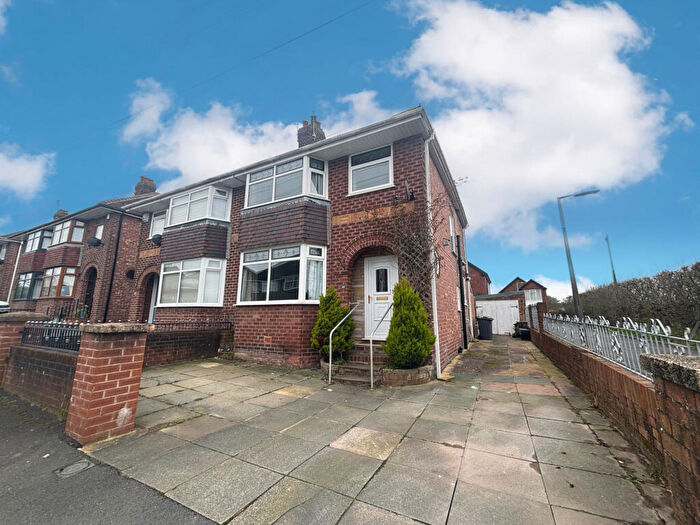
Properties for sale near FY3 7TY, Dinmore Avenue

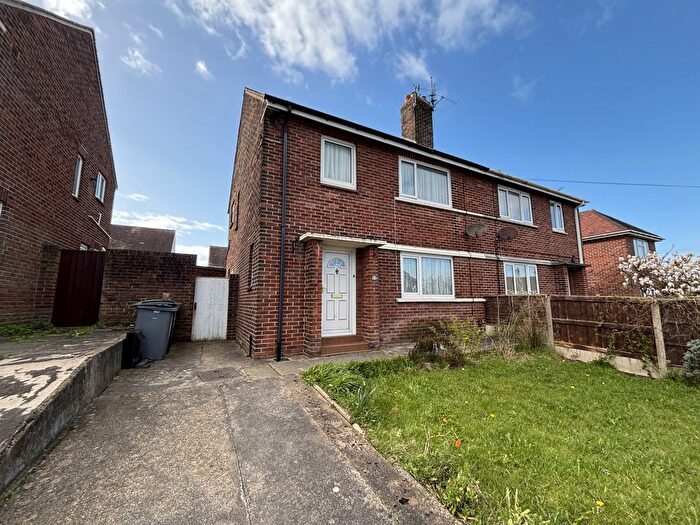
![]()
If you are looking to sell your house, let it out, or receive a property valuation, an expert can help you.
Click the button below to get started.

Price Paid in Dinmore Avenue, FY3 7TY, Park
236 Dinmore Avenue, FY3 7TY, Park Blackpool
Property 236 has been sold 1 time. The last time it was sold was in 11/02/2022 and the sold price was £80,000.00.
This terraced house, sold as a freehold on 11/02/2022, is a 82 sqm mid-terrace house with an EPC rating of D.
| Date | Price | Property Type | Tenure | Classification |
|---|---|---|---|---|
| 11/02/2022 | £80,000.00 | Terraced House | freehold | Established Building |
224 Dinmore Avenue, FY3 7TY, Park Blackpool
Property 224 has been sold 2 times. The last time it was sold was in 31/05/2018 and the sold price was £79,500.00.
This semi detached house, sold as a freehold on 31/05/2018, is a 64 sqm semi-detached house with an EPC rating of D.
| Date | Price | Property Type | Tenure | Classification |
|---|---|---|---|---|
| 31/05/2018 | £79,500.00 | Semi Detached House | freehold | Established Building |
| 18/11/2008 | £78,000.00 | Semi Detached House | freehold | Established Building |
218 Dinmore Avenue, FY3 7TY, Park Blackpool
Property 218 has been sold 1 time. The last time it was sold was in 04/11/2013 and the sold price was £28,000.00.
This semi detached house, sold as a freehold on 04/11/2013, is a 66 sqm semi-detached house with an EPC rating of C.
| Date | Price | Property Type | Tenure | Classification |
|---|---|---|---|---|
| 04/11/2013 | £28,000.00 | Semi Detached House | freehold | Established Building |
230 Dinmore Avenue, FY3 7TY, Park Blackpool
Property 230 has been sold 1 time. The last time it was sold was in 10/11/2008 and the sold price was £79,000.00.
This terraced house, sold as a freehold on 10/11/2008, is a 69 sqm end-terrace house with an EPC rating of C.
| Date | Price | Property Type | Tenure | Classification |
|---|---|---|---|---|
| 10/11/2008 | £79,000.00 | Terraced House | freehold | Established Building |
228 Dinmore Avenue, FY3 7TY, Park Blackpool
Property 228 has been sold 1 time. The last time it was sold was in 23/10/2008 and the sold price was £66,000.00.
This terraced house, sold as a freehold on 23/10/2008, is a 63 sqm mid-terrace house with an EPC rating of D.
| Date | Price | Property Type | Tenure | Classification |
|---|---|---|---|---|
| 23/10/2008 | £66,000.00 | Terraced House | freehold | Established Building |
234 Dinmore Avenue, FY3 7TY, Park Blackpool
Property 234 has been sold 1 time. The last time it was sold was in 23/11/2007 and the sold price was £100,000.00.
This terraced house, sold as a freehold on 23/11/2007, is a 54 sqm mid-terrace house with an EPC rating of D.
| Date | Price | Property Type | Tenure | Classification |
|---|---|---|---|---|
| 23/11/2007 | £100,000.00 | Terraced House | freehold | Established Building |
226 Dinmore Avenue, FY3 7TY, Park Blackpool
Property 226 has been sold 3 times. The last time it was sold was in 26/06/1998 and the sold price was £28,000.00.
This is a Terraced House which was sold as a freehold in 26/06/1998
| Date | Price | Property Type | Tenure | Classification |
|---|---|---|---|---|
| 26/06/1998 | £28,000.00 | Terraced House | freehold | Established Building |
| 16/05/1997 | £27,000.00 | Terraced House | freehold | Established Building |
| 02/08/1996 | £23,000.00 | Terraced House | freehold | Established Building |
Postcodes in Dinmore Avenue, Park
Navigate through other locations in Dinmore Avenue, Park, Blackpool to see more property listings for sale or to rent.
Transport near FY3 7TY, Dinmore Avenue

House price paid reports for FY3 7TY, Dinmore Avenue
Click on the buttons below to see price paid reports by year or property price:
- Price Paid By Year
Property Price Paid in FY3 7TY, Dinmore Avenue by Year
The average sold property price by year was:
| Year | Average Sold Price | Price Change |
Sold Properties
|
|---|---|---|---|
| 2022 | £80,000 | 1% |
1 Property |
| 2018 | £79,500 | 65% |
1 Property |
| 2013 | £28,000 | -165% |
1 Property |
| 2008 | £74,333 | -35% |
3 Properties |
| 2007 | £100,000 | 72% |
1 Property |
| 1998 | £28,000 | 4% |
1 Property |
| 1997 | £27,000 | 15% |
1 Property |
| 1996 | £23,000 | - |
1 Property |