
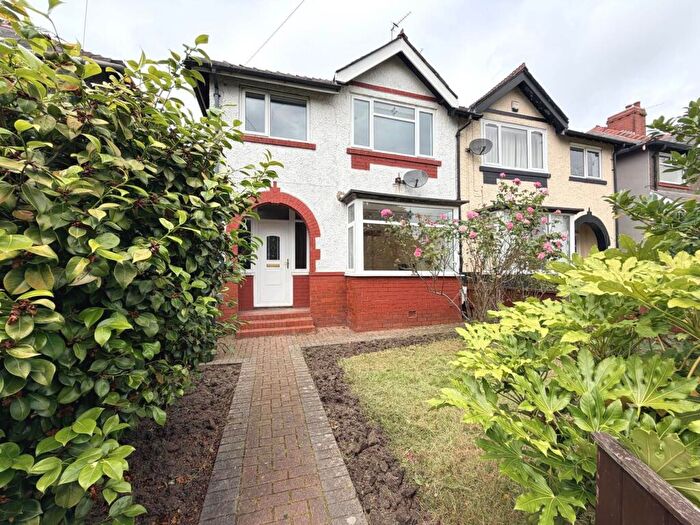
Houses for sale in Tithebarn, Blackpool
House Prices in Tithebarn
Properties in Tithebarn have an average house price of £162k and had 11 Property Transactions within the last 3 years¹.
Tithebarn is an area in Blackpool, Lancashire with 93 households², where the most expensive property was sold for £298k.
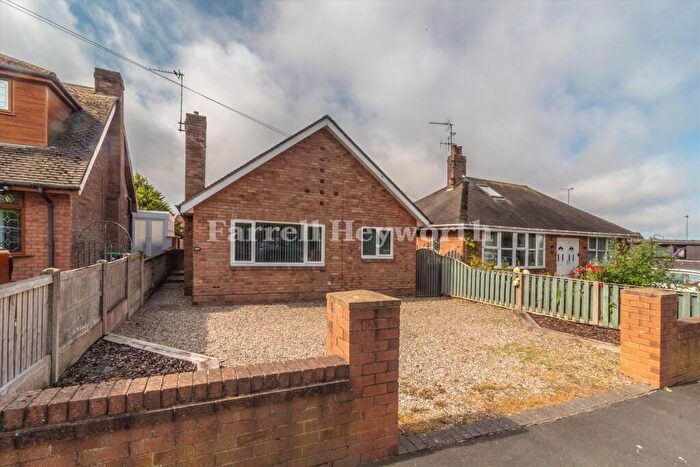
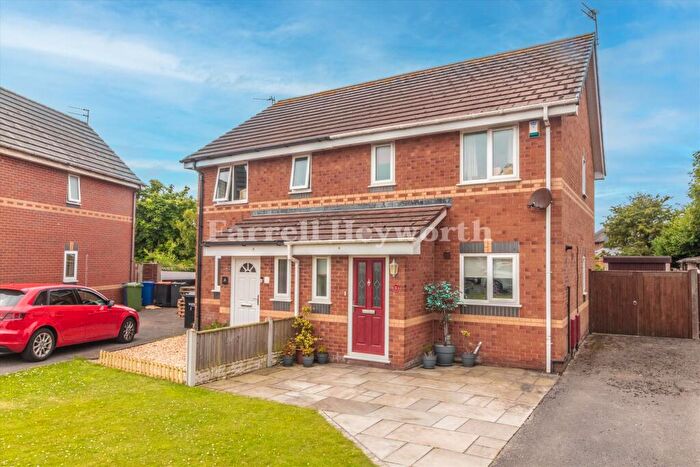
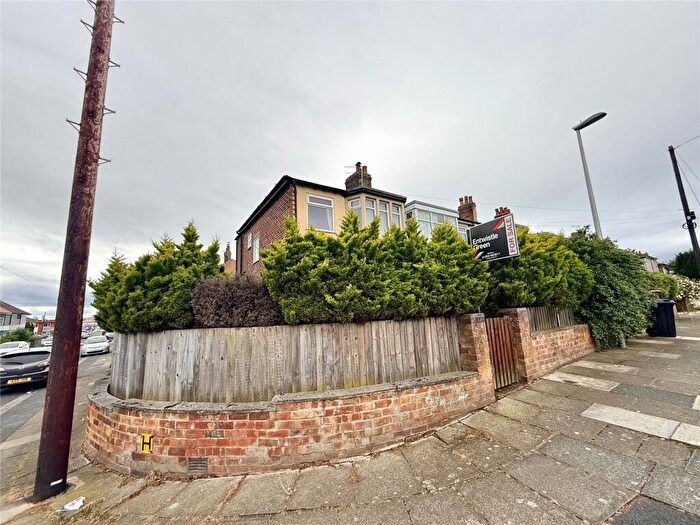
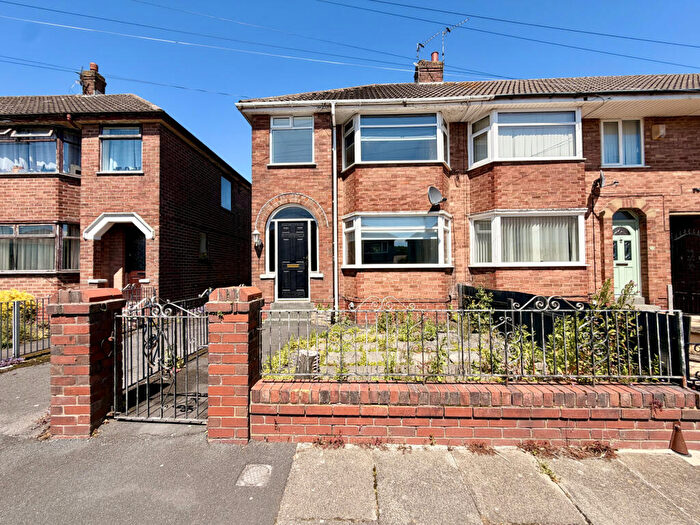
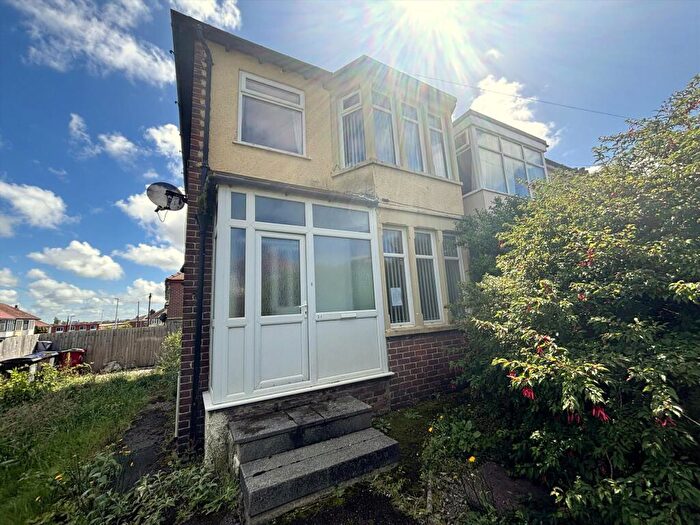
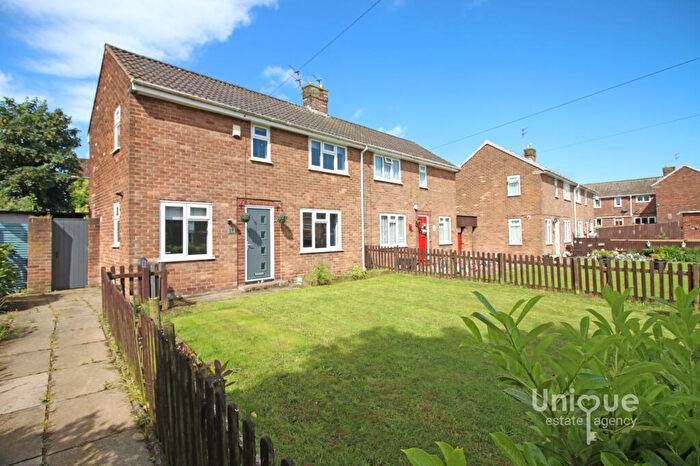
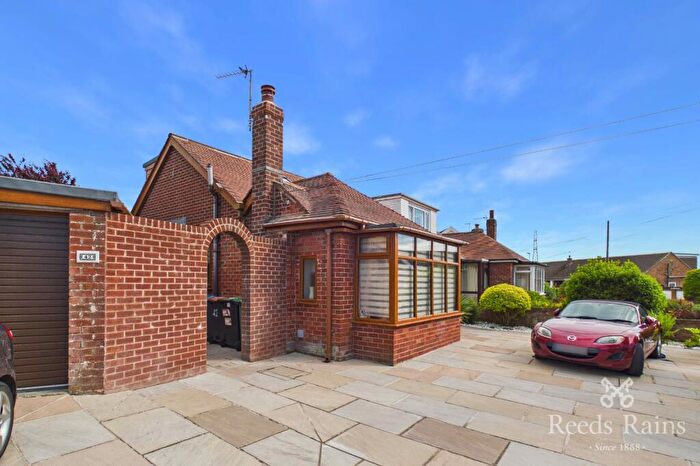
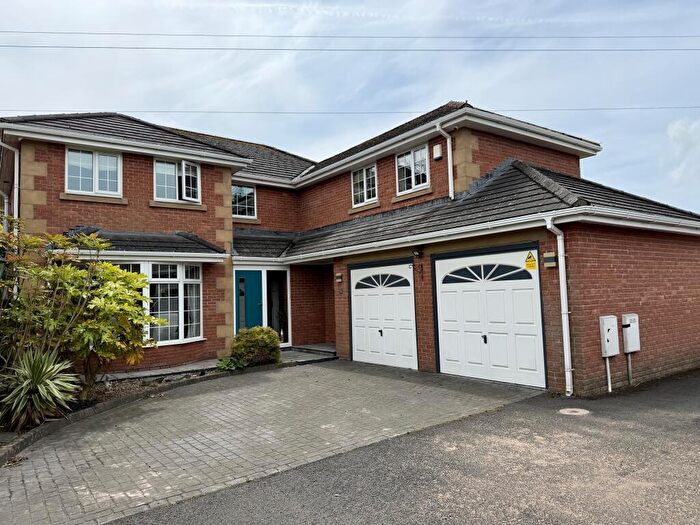
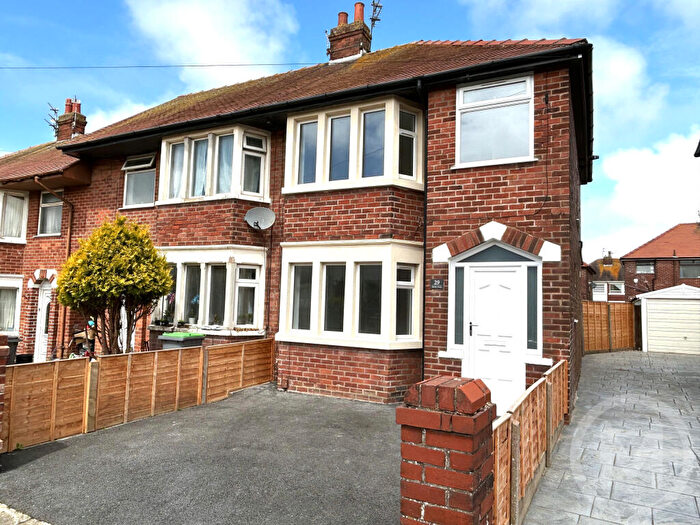
Properties for sale in Tithebarn
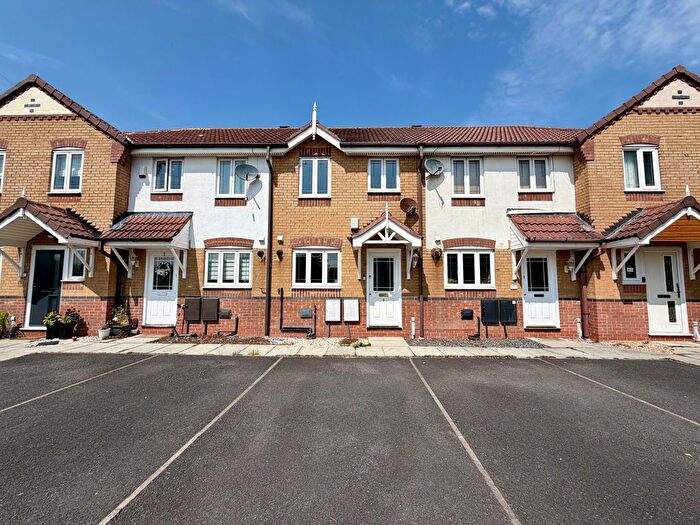
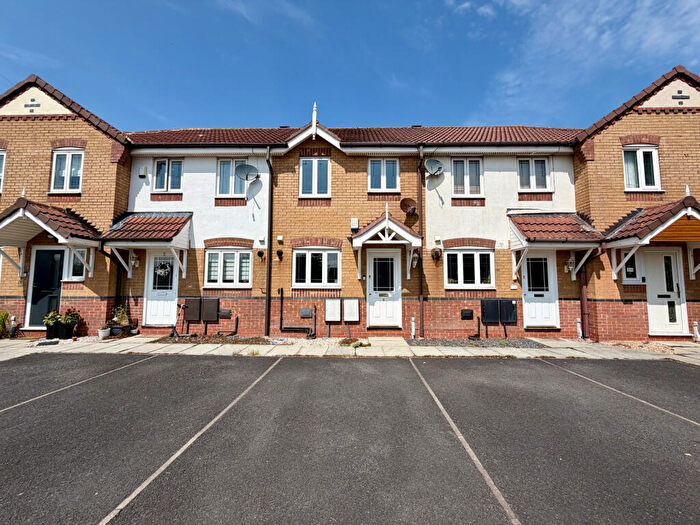
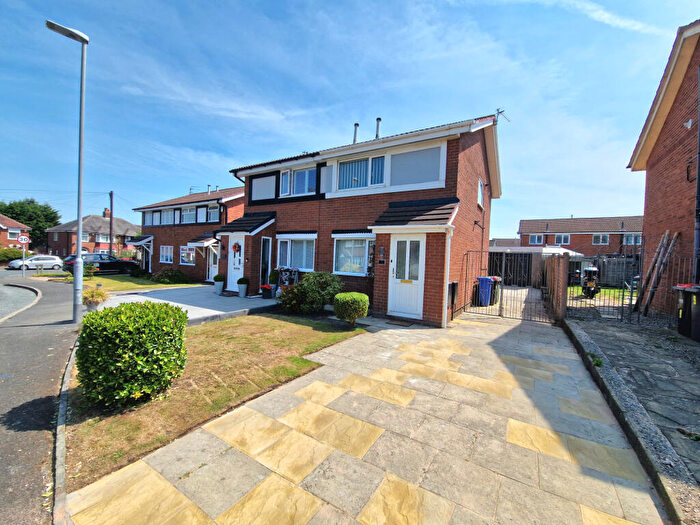
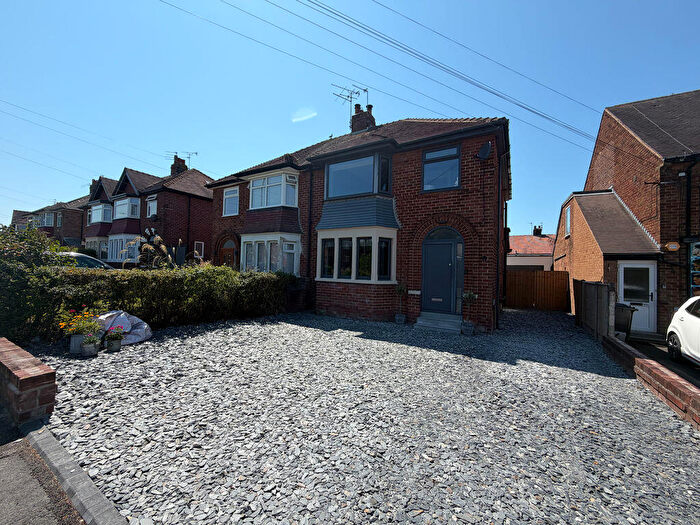
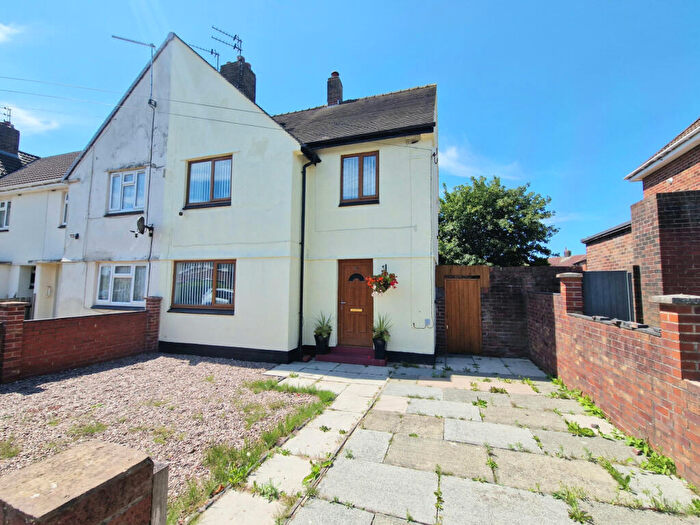
![]()
If you are looking to sell your house, let it out, or receive a property valuation, an expert can help you.
Click the button below to get started.
Roads and Postcodes in Tithebarn
Navigate through our locations to find the location of your next house in Tithebarn, Blackpool for sale or to rent.
| Streets | Postcodes |
|---|---|
| Blackpool Old Road | FY3 7LX |
| Elkfield Drive | FY3 7RG |
| Higher Moor Road | FY3 7NA |
| Leyfield Close | FY3 7RQ |
| Robson Way | FY3 7PP |
| Westfield Avenue | FY3 7LU |
Property price trends in Tithebarn
According to the latest Land Registry data, the average home in Tithebarn sold for £211,166 in 2025. That figure comes from 180 sales logged over the past 30 years.
Prices have continued to climb over the last three years. Compared with 2022, when the typical sale came in around £198,545, that's a rise of roughly 6.4%.
Looking back five years, average prices are up about 45.1% since 2020, a gain of around £65,666 in cash terms.
Zoom out to the past decade for the fuller picture. Back in 2015, homes here averaged £160,533, so the typical sold price has climbed about 31.5% since then, roughly 2.8% a year. Stretch the view to fifteen years and that annual pace eases back to about 1.3%.
Frequently asked questions about Tithebarn
What is the average price for a property for sale in Tithebarn?
The average price for a property for sale in Tithebarn is £161,715. This amount is 30% lower than the average price in Blackpool. There are 990 property listings for sale in Tithebarn.
What streets have the most expensive properties for sale in Tithebarn?
The streets with the most expensive properties for sale in Tithebarn are Blackpool Old Road at an average of £194,000 and Leyfield Close at an average of £163,000.
What streets have the most affordable properties for sale in Tithebarn?
The streets with the most affordable properties for sale in Tithebarn are Elkfield Drive at an average of £132,342 and Westfield Avenue at an average of £155,250.
Which train stations are available in or near Tithebarn?
Some of the train stations available in or near Tithebarn are Layton, Poulton-Le-Fylde and Blackpool North.
Property Price Paid in Tithebarn by Year
The average sold property price by year was:
| Year | Average Sold Price | Price Change |
Sold Properties
|
|---|---|---|---|
| 2025 | £211,166 | 31% |
3 Properties |
| 2024 | £146,333 | 3% |
3 Properties |
| 2023 | £141,274 | -41% |
5 Properties |
| 2022 | £198,545 | -6% |
11 Properties |
| 2021 | £210,333 | 31% |
6 Properties |
| 2020 | £145,500 | 16% |
6 Properties |
| 2019 | £121,750 | -25% |
4 Properties |
| 2018 | £151,991 | 25% |
6 Properties |
| 2017 | £113,333 | -121% |
3 Properties |
| 2016 | £250,000 | 36% |
2 Properties |
Property Price per Property Type in Tithebarn
Here you can find historic sold price data in order to help with your property search.
The average Property Paid Price for specific property types in the last three years are:
| Property Type | Average Sold Price | Sold Properties |
|---|---|---|
| Semi Detached House | £142,983.00 | 8 Semi Detached Houses |
| Detached House | £211,666.00 | 3 Detached Houses |
