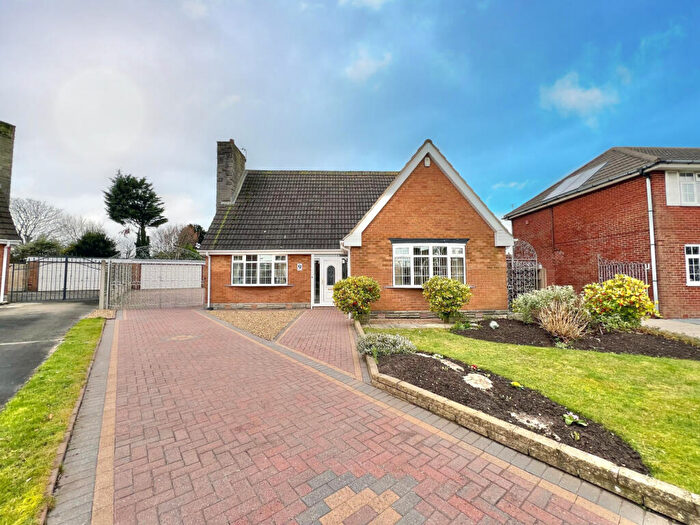
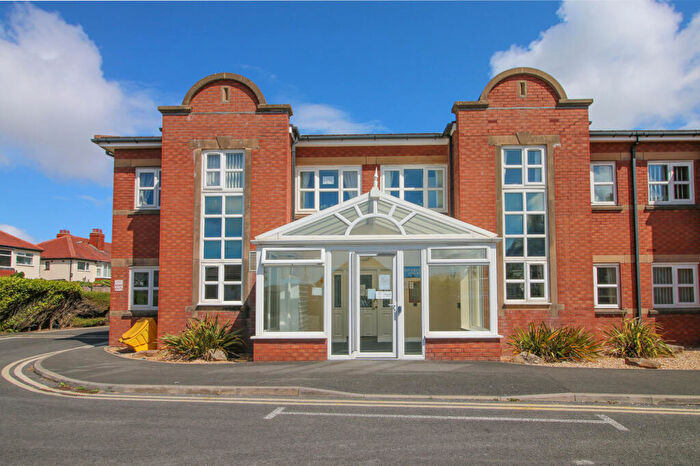
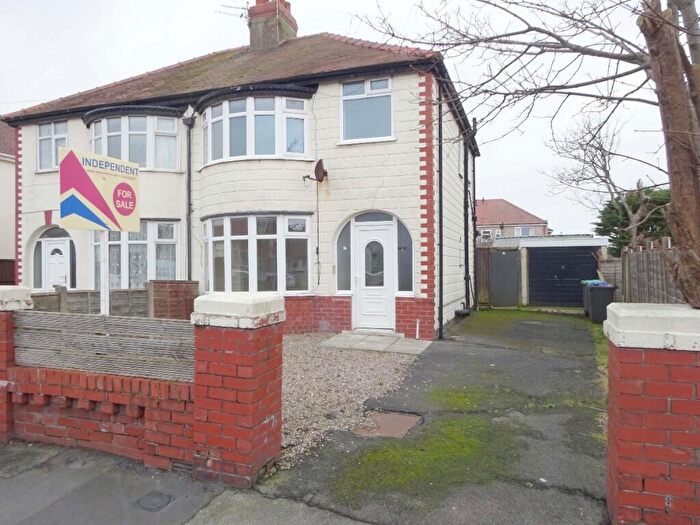
Houses for sale & to rent in Norbreck, Thornton-cleveleys
House Prices in Norbreck
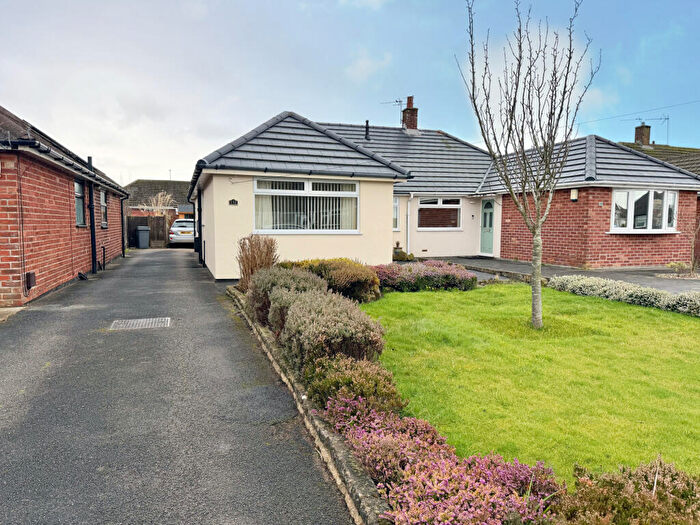
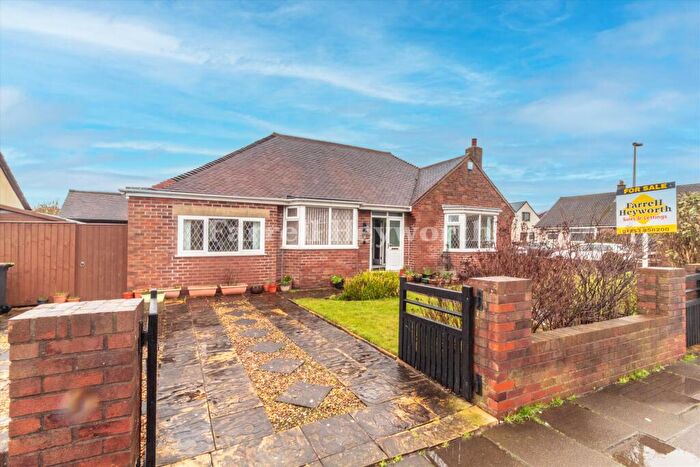
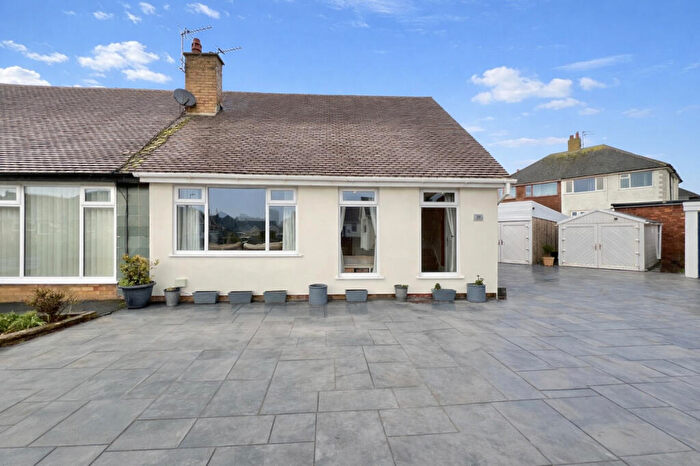
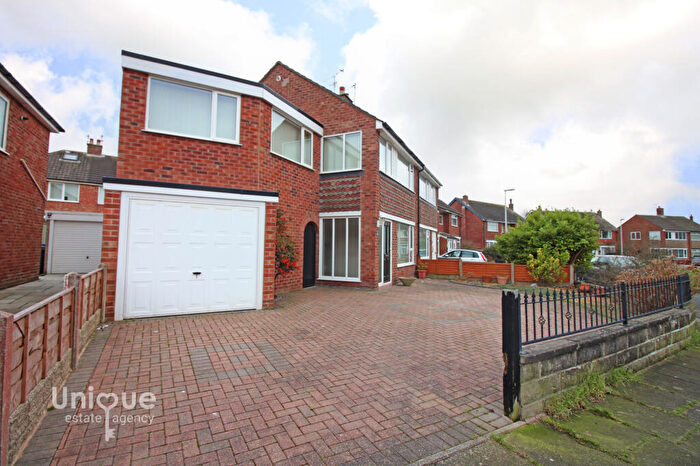
Properties in Norbreck have an average house price of £181,408.00 and had 299 Property Transactions within the last 3 years¹.
Norbreck is an area in Thornton-cleveleys, Blackpool with 2,412 households², where the most expensive property was sold for £450,000.00.
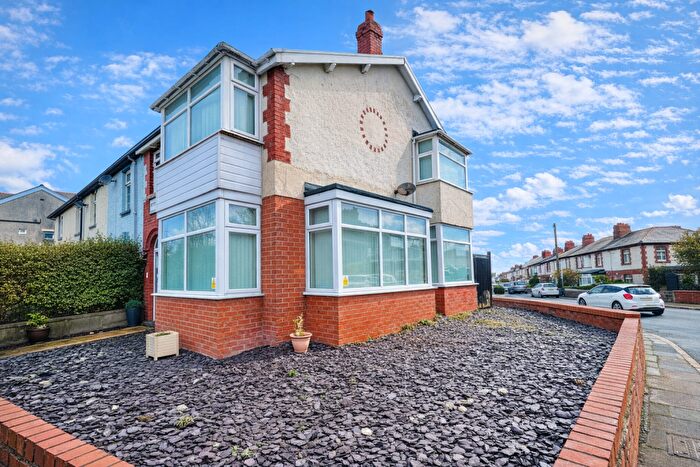
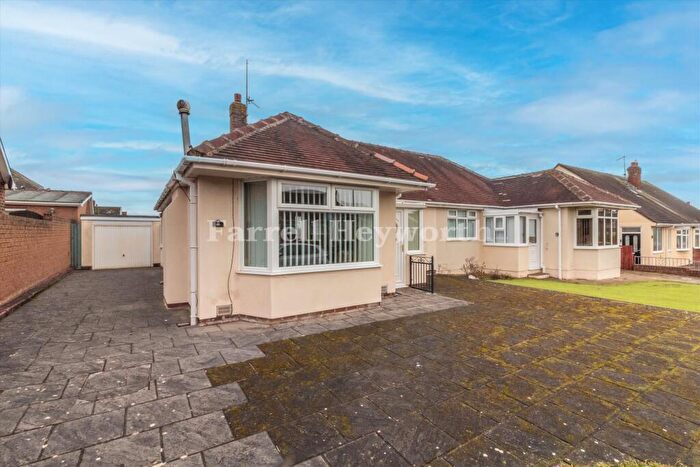
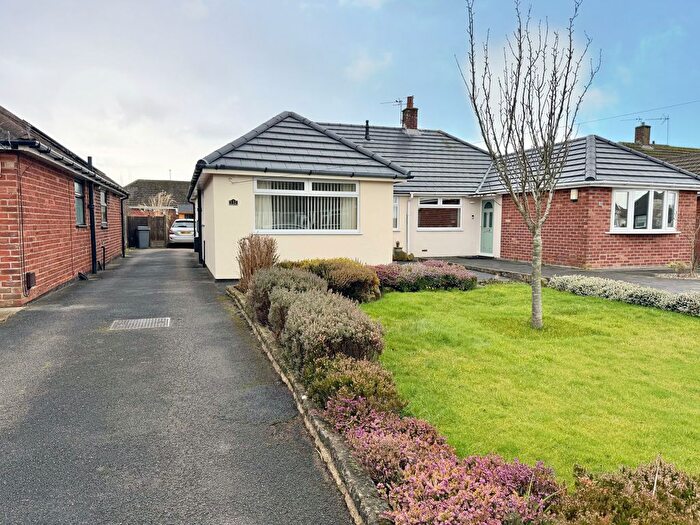
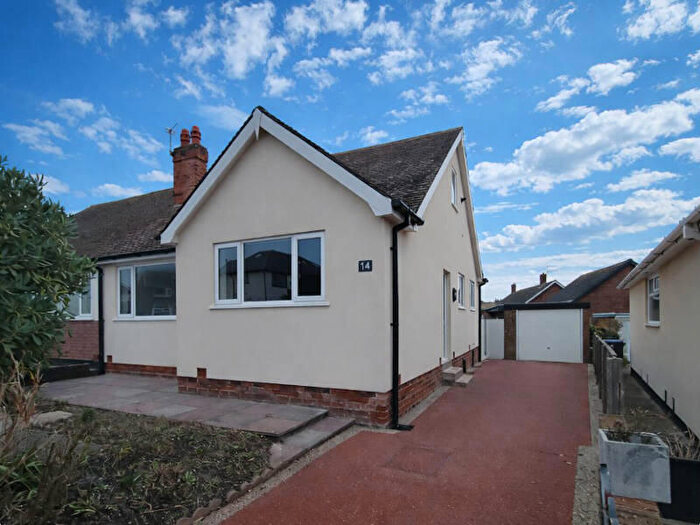
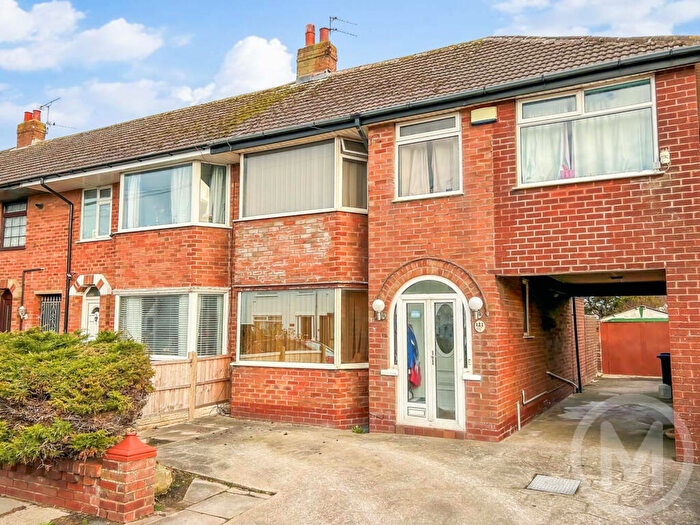
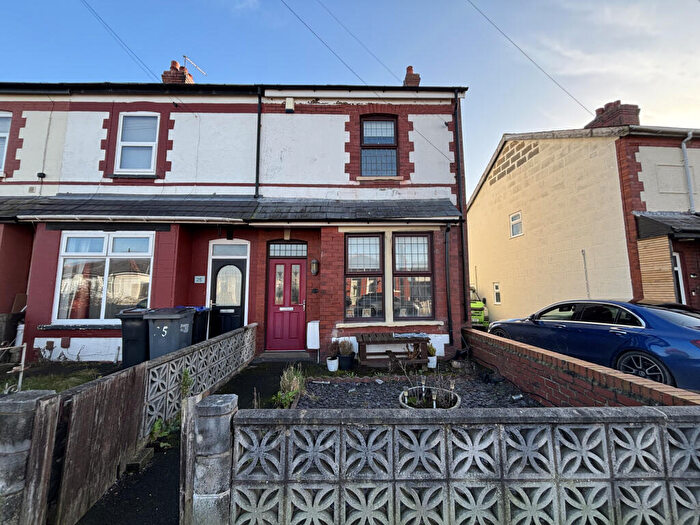
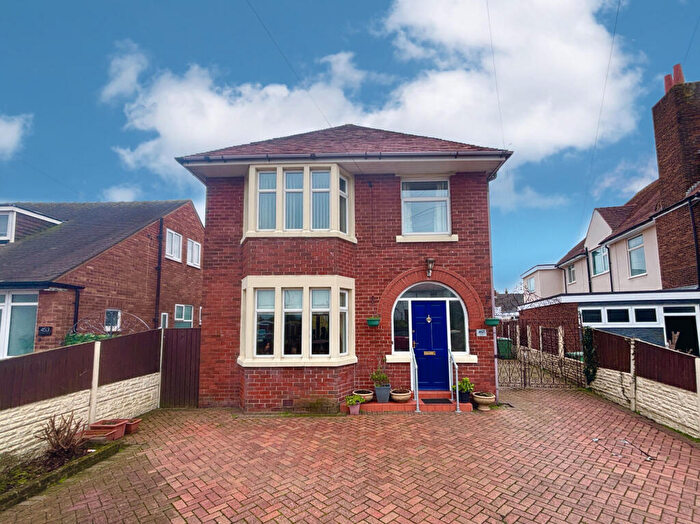
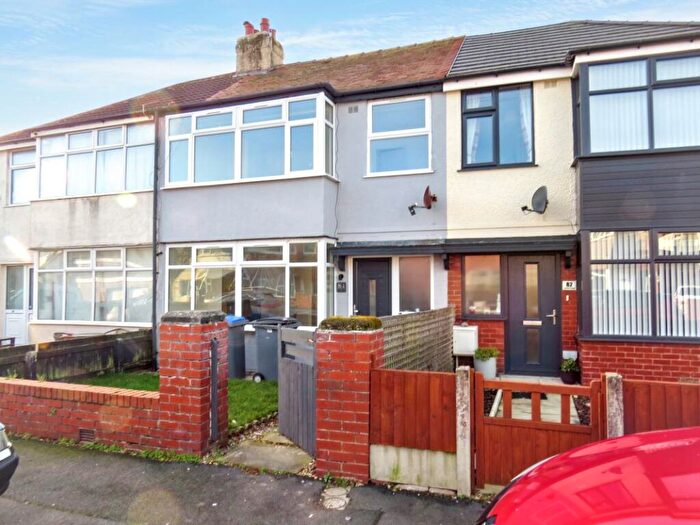
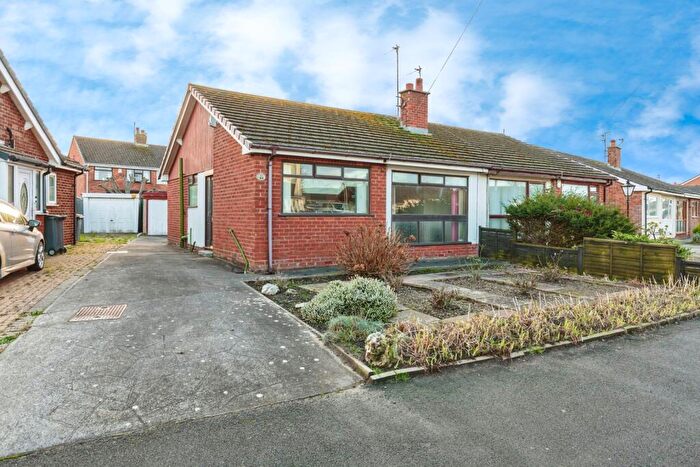
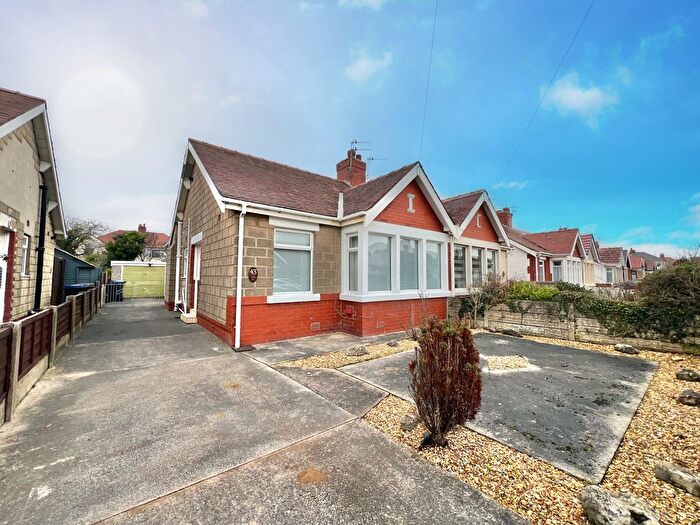
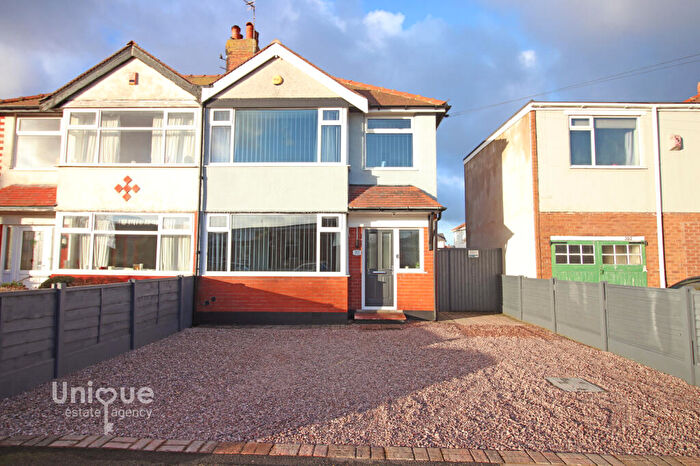
Properties for sale in Norbreck
Roads and Postcodes in Norbreck
Navigate through our locations to find the location of your next house in Norbreck, Thornton-cleveleys for sale or to rent.
| Streets | Postcodes |
|---|---|
| Alpic Drive | FY5 1QB |
| Ashfield Road | FY5 3JA FY5 3PJ |
| Ashwell Place | FY5 1QS |
| Brentwood Avenue | FY5 3QR |
| Buckley Crescent | FY5 1RH |
| Bucknell Place | FY5 3HZ |
| Byfield Avenue | FY5 3HW |
| Carr Road | FY5 3AG |
| Clovelly Avenue | FY5 1RU FY5 1RZ |
| Deerhurst Road | FY5 3HG |
| Delphene Avenue | FY5 1RY |
| Derwent Place | FY5 3HA |
| Elmbank Avenue | FY5 1QW |
| Emerald Close | FY5 3LH |
| Evesham Close | FY5 3HQ |
| Fleetwood Road | FY5 1NJ FY5 1NL FY5 1NQ FY5 1RA FY5 1RB FY5 1RD FY5 1SB FY5 1SD FY5 1SE FY5 1SF FY5 1RN |
| Gaydon Way | FY5 3HN |
| Glenmere Crescent | FY5 1QD |
| Gretna Crescent | FY5 1NX |
| Halford Place | FY5 3HP |
| Ilkley Grove | FY5 3HF |
| Jem Gate | FY5 1NN |
| Kelvin Road | FY5 3AF |
| Kirkstone Drive | FY5 1QH FY5 1QJ FY5 1QL FY5 1QQ |
| Lockerbie Avenue | FY5 3EP FY5 3EW |
| Lodge Close | FY5 1RQ |
| Loxley Place | FY5 3HH |
| Loxley Place East | FY5 3JU |
| Lyddesdale Avenue | FY5 3EJ FY5 3EL |
| Maida Vale | FY5 1NP FY5 1NW |
| Maplewood Drive | FY5 1PN FY5 1PW |
| Marble Avenue | FY5 3LE |
| Melton Place | FY5 1PL |
| Micklegate | FY5 1RG |
| Mossom Lane | FY5 1RJ FY5 1RL FY5 3AA FY5 3AE |
| Norbreck Road | FY5 1PA FY5 1PB FY5 1PE FY5 1QG FY5 1RE FY5 1RR FY5 1RS FY5 1RT FY5 1NU |
| Norkeed Road | FY5 1QE |
| North Drive | FY5 3AH FY5 3AJ FY5 3AQ FY5 3HT |
| Oakland Avenue | FY5 1RX |
| Opal Close | FY5 3LL |
| Oxhill Place | FY5 3JB |
| Poolhill Close | FY5 3HL |
| Queens Promenade | FY5 1PG FY5 1PH FY5 1PJ FY5 1PQ FY5 1PU FY5 1QT FY5 1TE |
| Radway Close | FY5 3EZ |
| Russell Avenue | FY5 1NY |
| Shelley Grove | FY5 3ES |
| Sheringham Avenue | FY5 3AB FY5 3AD |
| Shore Road | FY5 1PF |
| Snowshill Crescent | FY5 3JD |
| Stable Mews | FY5 1SQ |
| Valeway Avenue | FY5 3ER |
| Warren Drive | FY5 3HB FY5 3HU |
| Waterhead Crescent | FY5 1QR |
| Westbury Close | FY5 1QN |
| Wheatfield Close | FY5 3PQ |
| Whiteholme Road | FY5 3HX |
| Wilson Square | FY5 1RF |
| Wilvere Drive | FY5 1QA FY5 1TG |
| Wimbledon Avenue | FY5 1BE FY5 1SA |
| Winchcombe Road | FY5 3HJ |
| Wingate Avenue | FY5 3HE |
| Wingate Place | FY5 3HD |
| Winsford Crescent | FY5 1PS FY5 1PT |
| Woodridge Avenue | FY5 1PP FY5 1PR |
| Wroxton Close | FY5 3EY |
Transport near Norbreck
- FAQ
- Price Paid By Year
- Property Type Price
Frequently asked questions about Norbreck
What is the average price for a property for sale in Norbreck?
The average price for a property for sale in Norbreck is £181,408. This amount is 9% higher than the average price in Thornton-cleveleys. There are 2,258 property listings for sale in Norbreck.
What streets have the most expensive properties for sale in Norbreck?
The streets with the most expensive properties for sale in Norbreck are Whiteholme Road at an average of £450,000, Evesham Close at an average of £300,000 and Opal Close at an average of £297,000.
What streets have the most affordable properties for sale in Norbreck?
The streets with the most affordable properties for sale in Norbreck are Carr Road at an average of £80,250, Micklegate at an average of £115,000 and Warren Drive at an average of £115,375.
Which train stations are available in or near Norbreck?
Some of the train stations available in or near Norbreck are Layton, Poulton-Le-Fylde and Blackpool North.
Property Price Paid in Norbreck by Year
The average sold property price by year was:
| Year | Average Sold Price | Price Change |
Sold Properties
|
|---|---|---|---|
| 2025 | £182,283 | 2% |
84 Properties |
| 2024 | £178,024 | -4% |
111 Properties |
| 2023 | £184,313 | 4% |
104 Properties |
| 2022 | £177,741 | 6% |
134 Properties |
| 2021 | £166,283 | 10% |
149 Properties |
| 2020 | £149,541 | 8% |
114 Properties |
| 2019 | £137,099 | -6% |
116 Properties |
| 2018 | £145,260 | 7% |
109 Properties |
| 2017 | £135,063 | -1% |
133 Properties |
| 2016 | £136,208 | 5% |
111 Properties |
| 2015 | £129,379 | -1% |
107 Properties |
| 2014 | £131,146 | 6% |
112 Properties |
| 2013 | £123,568 | 6% |
111 Properties |
| 2012 | £116,166 | -15% |
71 Properties |
| 2011 | £133,329 | 2% |
70 Properties |
| 2010 | £130,346 | -0,1% |
63 Properties |
| 2009 | £130,413 | -6% |
60 Properties |
| 2008 | £138,716 | -14% |
61 Properties |
| 2007 | £158,679 | 9% |
138 Properties |
| 2006 | £144,544 | 2% |
156 Properties |
| 2005 | £141,421 | 8% |
97 Properties |
| 2004 | £129,777 | 20% |
125 Properties |
| 2003 | £103,426 | 21% |
144 Properties |
| 2002 | £82,021 | 26% |
148 Properties |
| 2001 | £60,762 | -2% |
159 Properties |
| 2000 | £61,988 | -8% |
105 Properties |
| 1999 | £66,933 | 9% |
184 Properties |
| 1998 | £60,801 | 10% |
148 Properties |
| 1997 | £54,922 | 9% |
136 Properties |
| 1996 | £50,069 | -7% |
121 Properties |
| 1995 | £53,731 | - |
78 Properties |
Property Price per Property Type in Norbreck
Here you can find historic sold price data in order to help with your property search.
The average Property Paid Price for specific property types in the last three years are:
| Property Type | Average Sold Price | Sold Properties |
|---|---|---|
| Semi Detached House | £177,734.00 | 188 Semi Detached Houses |
| Detached House | £288,841.00 | 47 Detached Houses |
| Terraced House | £121,194.00 | 28 Terraced Houses |
| Flat | £107,165.00 | 36 Flats |

