
Houses for sale & to rent in Norbreck, Blackpool
House Prices in Norbreck
Properties in Norbreck have an average house price of £218k and had 31 Property Transactions within the last 3 years¹.
Norbreck is an area in Blackpool, Blackpool with 351 households², where the most expensive property was sold for £360k.
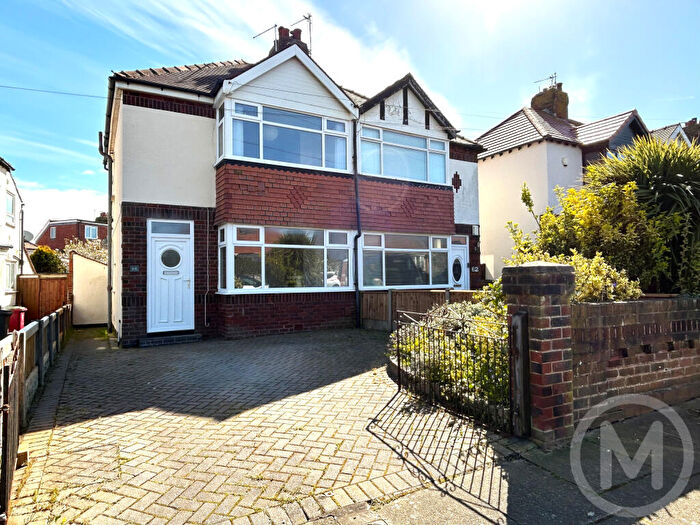
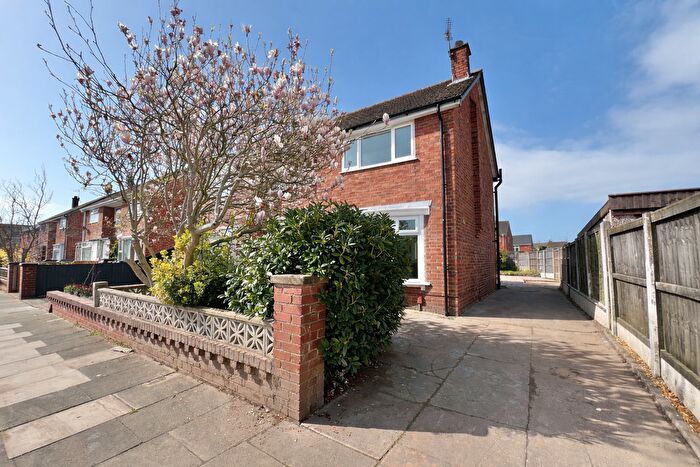
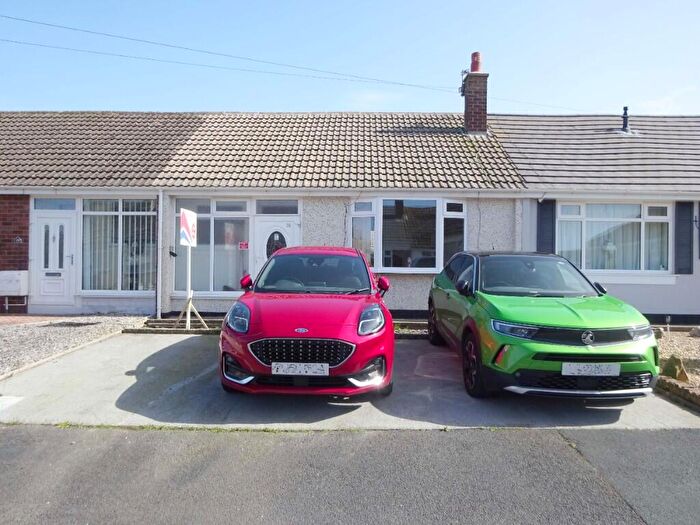
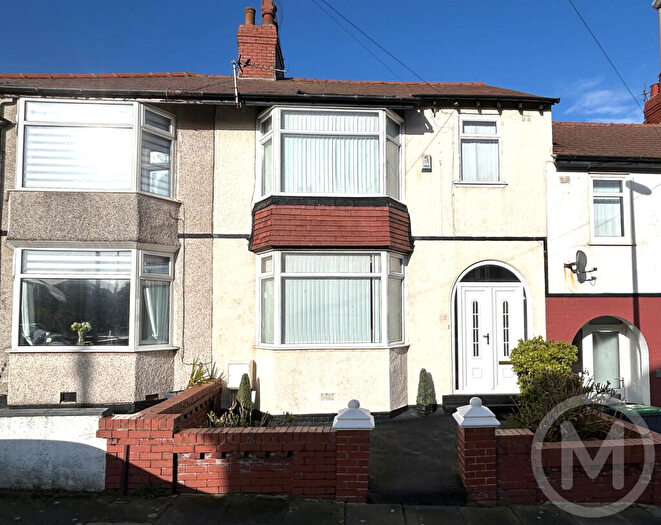
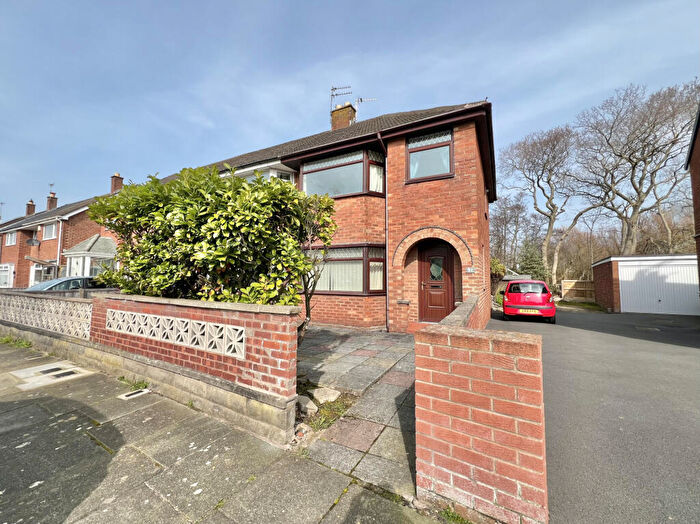
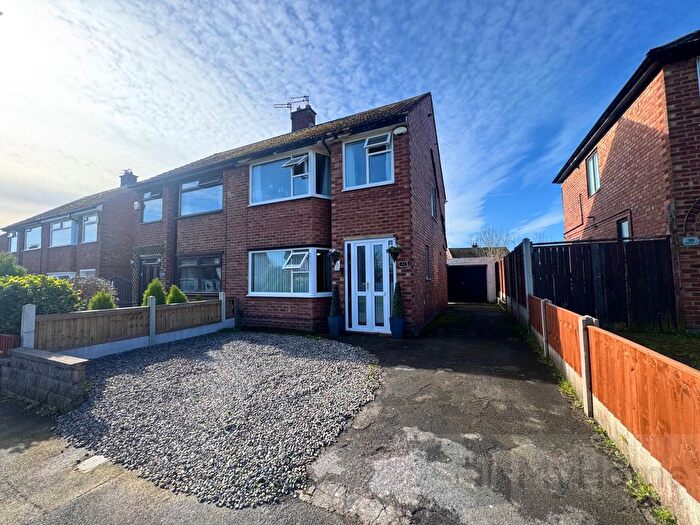
Properties for sale in Norbreck
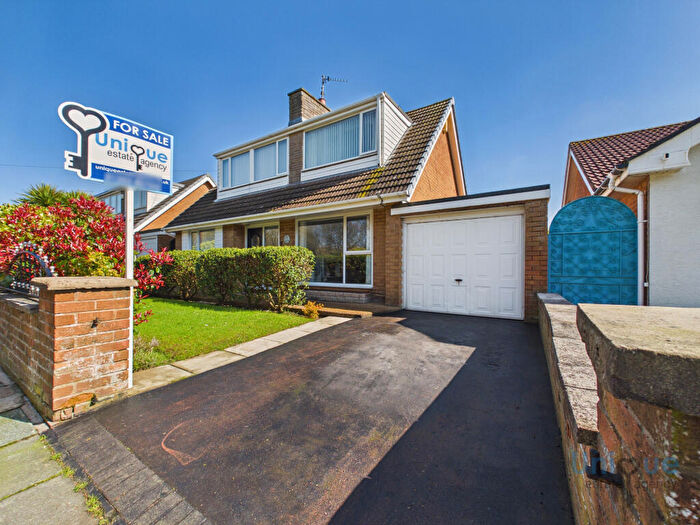
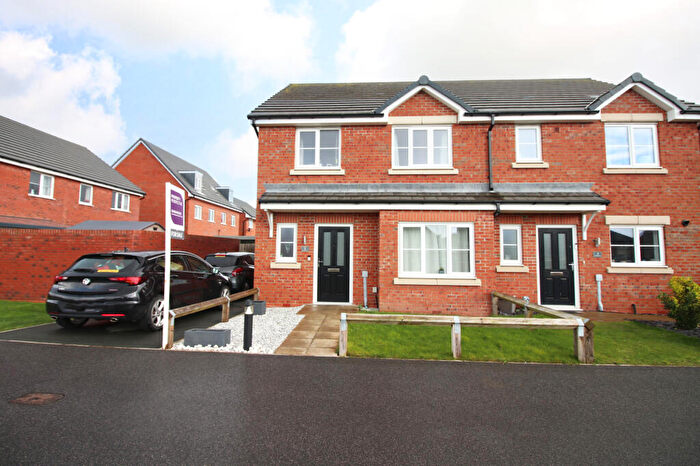
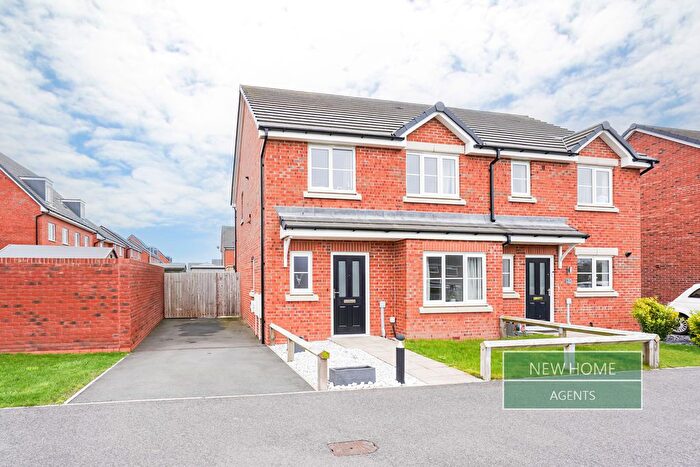
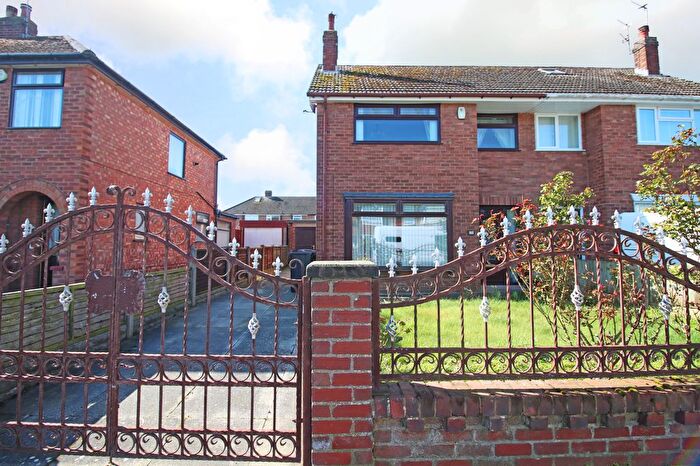
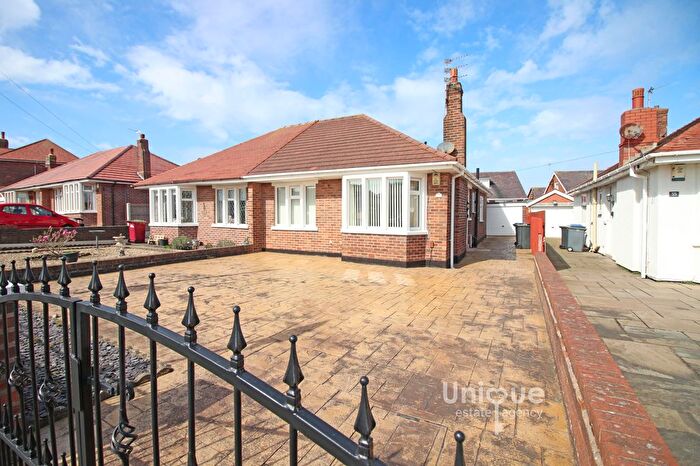
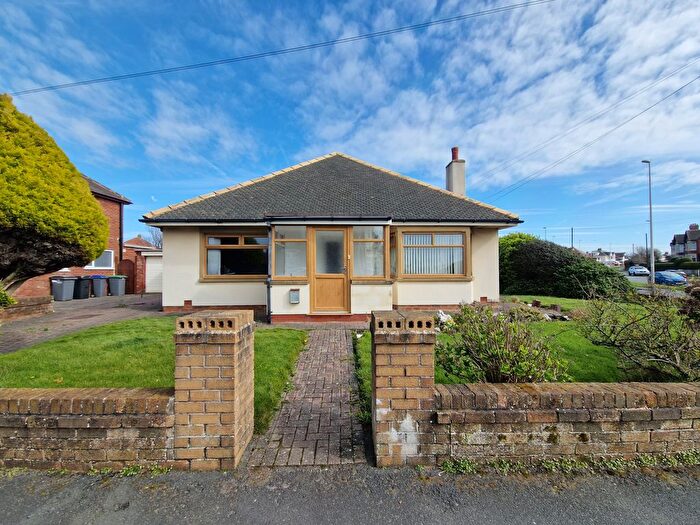
![]()
If you are looking to sell your house, let it out, or receive a property valuation, an expert can help you.
Click the button below to get started.

Roads and Postcodes in Norbreck
Navigate through our locations to find the location of your next house in Norbreck, Blackpool for sale or to rent.
| Streets | Postcodes |
|---|---|
| Ashfield Road | FY2 0HB |
| Boston Avenue | FY2 9BZ FY2 9DA |
| Devonshire Road | FY2 0AD FY2 0AE FY2 0AG FY2 0AP FY2 0AR |
| Digham Avenue | FY2 0AQ |
| Duncan Avenue | FY2 9DB |
| Everest Drive | FY2 9DW |
| Glossop Close | FY2 9DE |
| Guildford Avenue | FY2 0AB FY2 9BE FY2 9BG |
| Norbreck Road | FY5 1PD FY5 1QF |
| Shirley Crescent | FY2 0AA |
| Solway Close | FY2 9DF |
| FY2 9AA |
Transport near Norbreck

- FAQ
- Price Paid By Year
- Property Type Price
Frequently asked questions about Norbreck
What is the average price for a property for sale in Norbreck?
The average price for a property for sale in Norbreck is £218,193. This amount is 60% higher than the average price in Blackpool. There are 1,745 property listings for sale in Norbreck.
What streets have the most expensive properties for sale in Norbreck?
The streets with the most expensive properties for sale in Norbreck are Devonshire Road at an average of £293,500, Boston Avenue at an average of £264,750 and Norbreck Road at an average of £245,000.
What streets have the most affordable properties for sale in Norbreck?
The streets with the most affordable properties for sale in Norbreck are Guildford Avenue at an average of £177,000, Shirley Crescent at an average of £181,285 and Digham Avenue at an average of £181,500.
Which train stations are available in or near Norbreck?
Some of the train stations available in or near Norbreck are Layton, Poulton-Le-Fylde and Blackpool North.
Property Price Paid in Norbreck by Year
The average sold property price by year was:
| Year | Average Sold Price | Price Change |
Sold Properties
|
|---|---|---|---|
| 2025 | £228,500 | 8% |
13 Properties |
| 2024 | £209,653 | -2% |
13 Properties |
| 2023 | £213,600 | 6% |
5 Properties |
| 2022 | £201,253 | -3% |
12 Properties |
| 2021 | £208,277 | 4% |
18 Properties |
| 2020 | £198,964 | 11% |
17 Properties |
| 2019 | £177,633 | 1% |
15 Properties |
| 2018 | £176,572 | 11% |
11 Properties |
| 2017 | £157,767 | -2% |
16 Properties |
| 2016 | £160,275 | -4% |
16 Properties |
| 2015 | £165,901 | 1% |
18 Properties |
| 2014 | £163,828 | 13% |
13 Properties |
| 2013 | £142,590 | 3% |
11 Properties |
| 2012 | £138,730 | -14% |
13 Properties |
| 2011 | £158,707 | 15% |
7 Properties |
| 2010 | £134,883 | -21% |
9 Properties |
| 2009 | £163,725 | -2% |
12 Properties |
| 2008 | £166,700 | -3% |
10 Properties |
| 2007 | £171,491 | 2% |
19 Properties |
| 2006 | £168,160 | 1% |
20 Properties |
| 2005 | £165,746 | 8% |
14 Properties |
| 2004 | £151,761 | -5% |
13 Properties |
| 2003 | £159,766 | 39% |
9 Properties |
| 2002 | £97,950 | 13% |
13 Properties |
| 2001 | £85,082 | 6% |
25 Properties |
| 2000 | £80,052 | 13% |
18 Properties |
| 1999 | £69,392 | 2% |
19 Properties |
| 1998 | £68,167 | 7% |
23 Properties |
| 1997 | £63,657 | 5% |
14 Properties |
| 1996 | £60,504 | -10% |
12 Properties |
| 1995 | £66,576 | - |
13 Properties |
Property Price per Property Type in Norbreck
Here you can find historic sold price data in order to help with your property search.
The average Property Paid Price for specific property types in the last three years are:
| Property Type | Average Sold Price | Sold Properties |
|---|---|---|
| Semi Detached House | £195,400.00 | 20 Semi Detached Houses |
| Detached House | £259,636.00 | 11 Detached Houses |