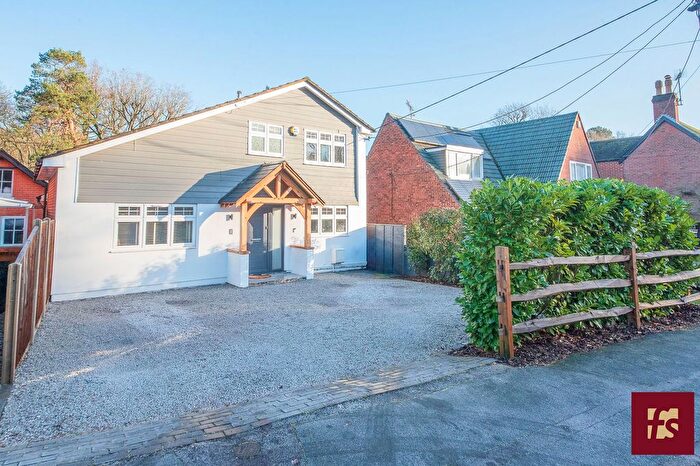
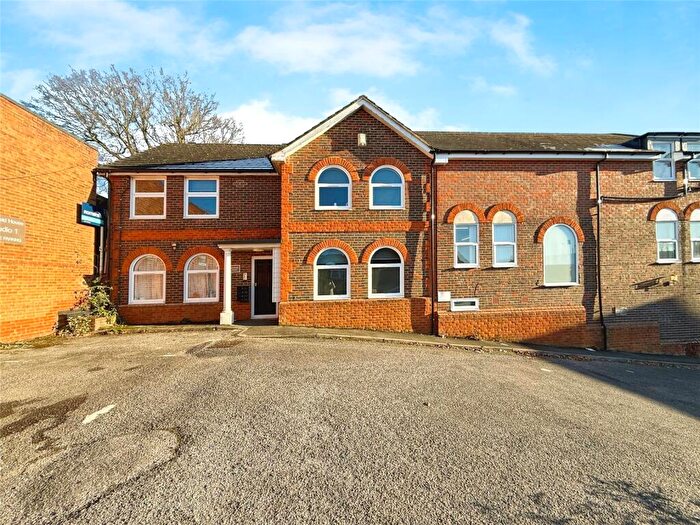
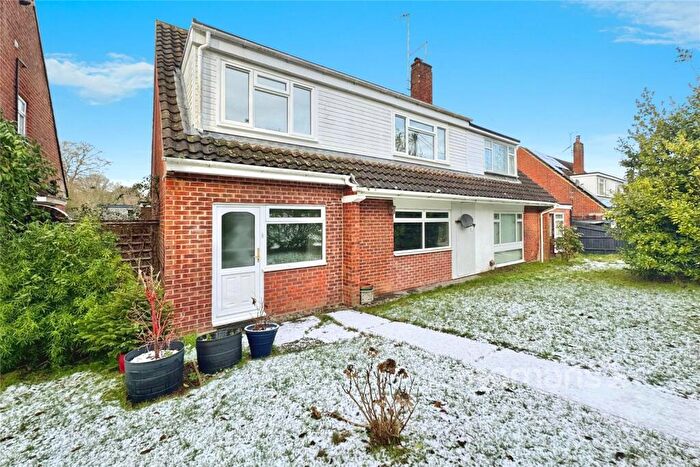
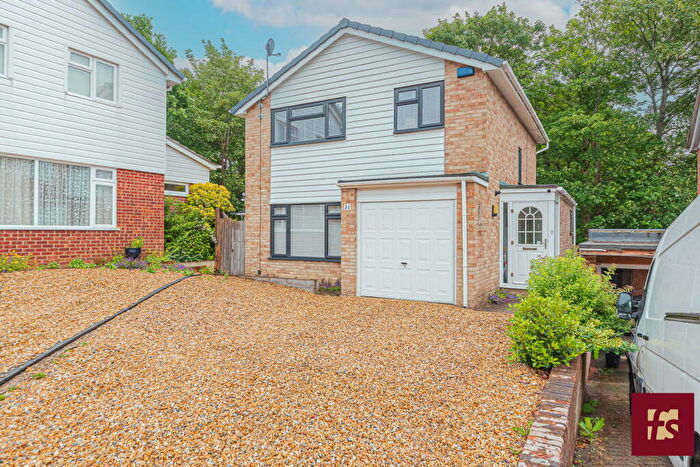
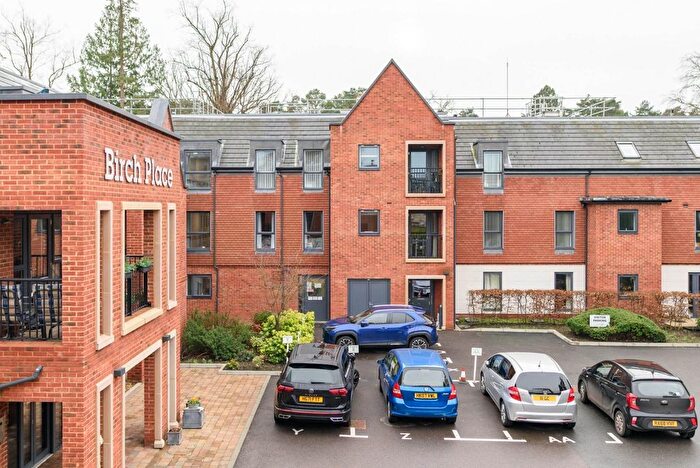
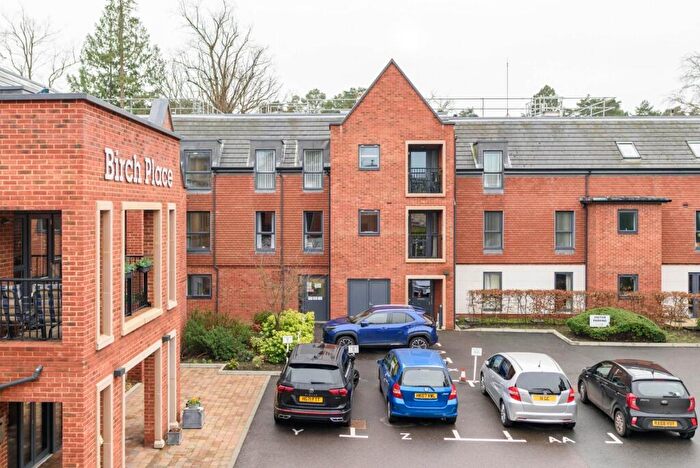
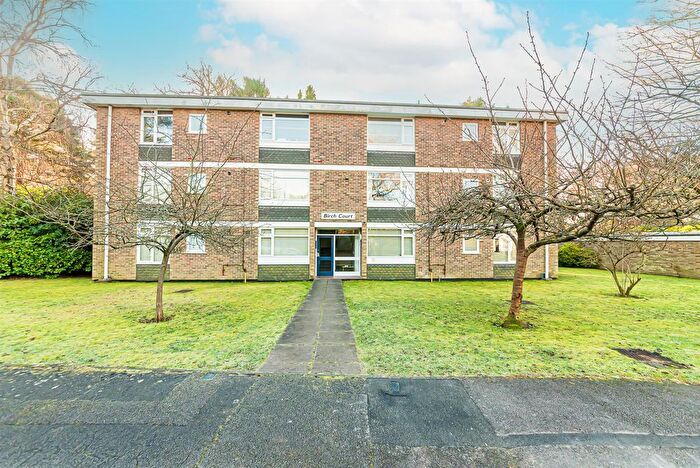
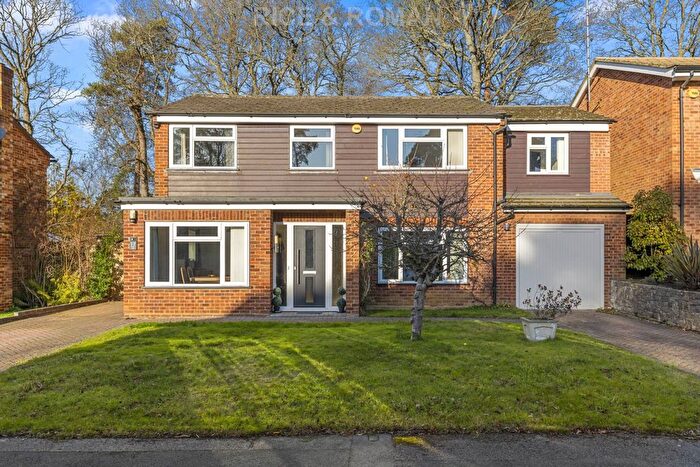
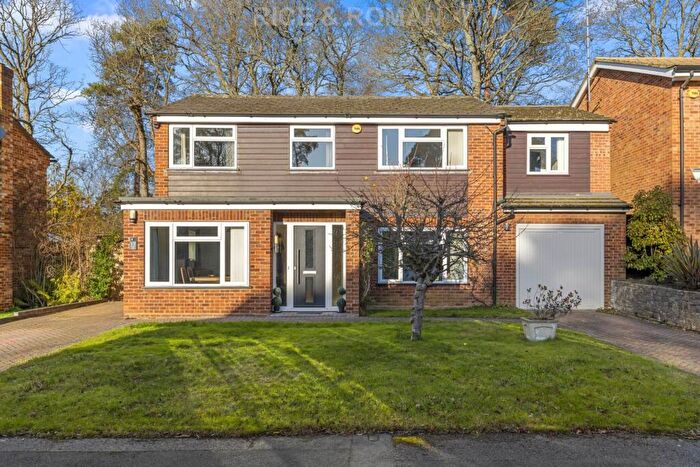
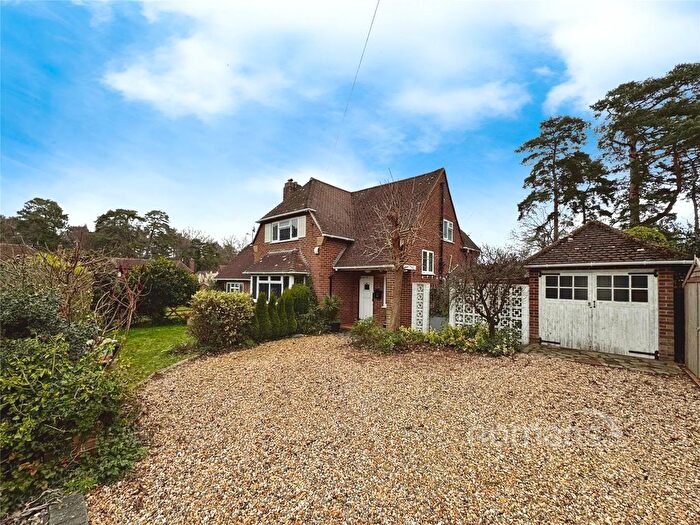
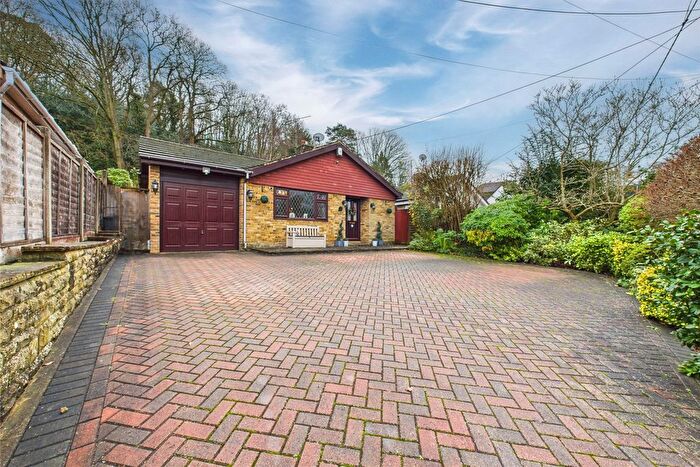
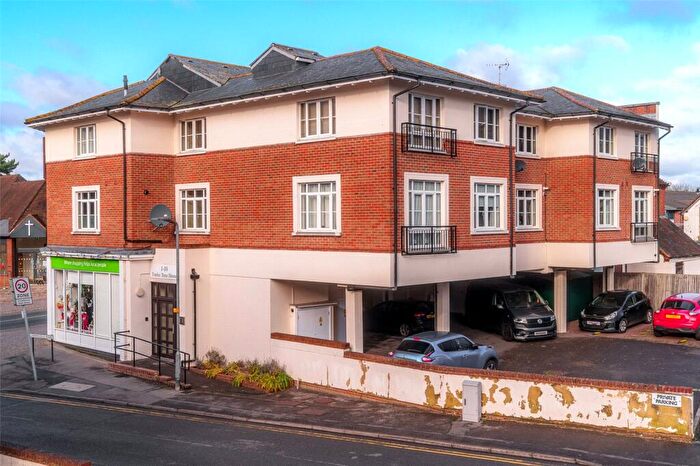
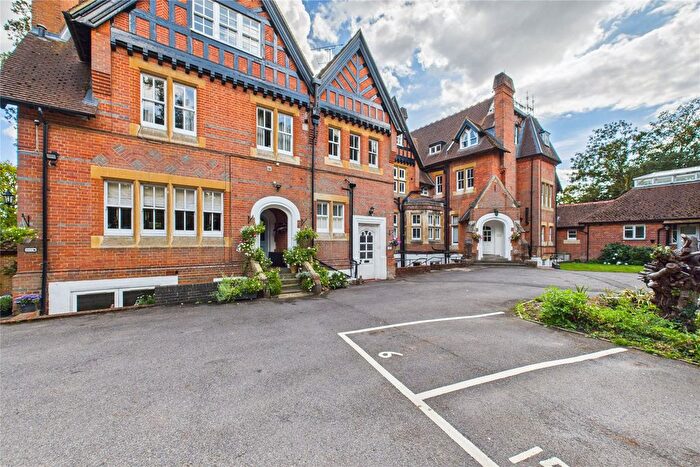
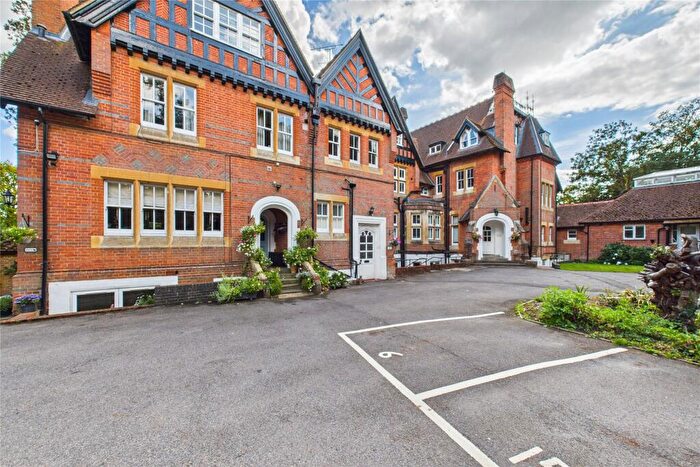
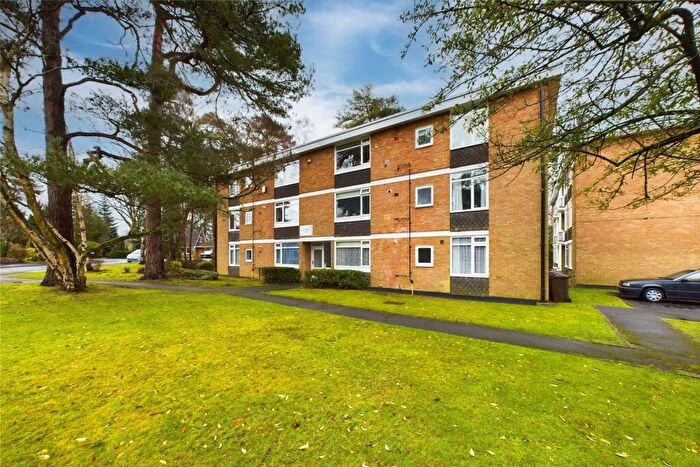
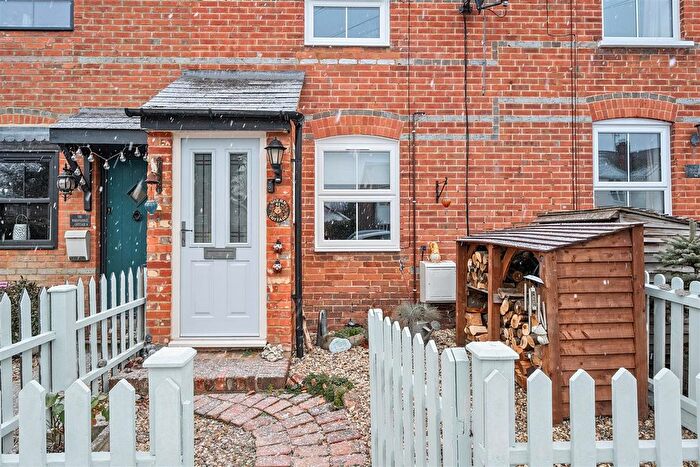
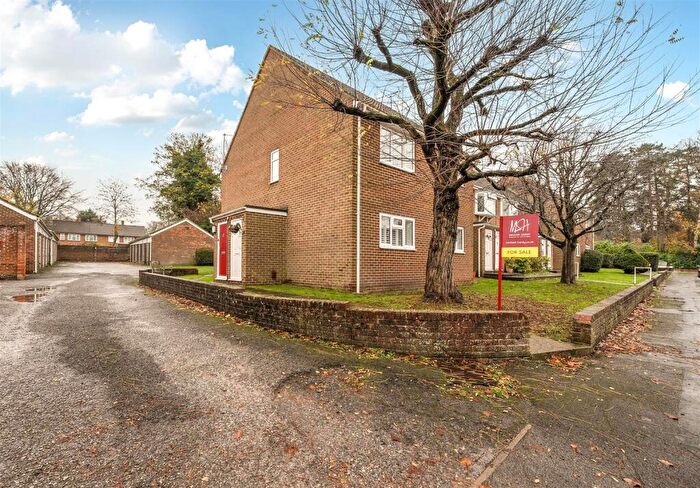
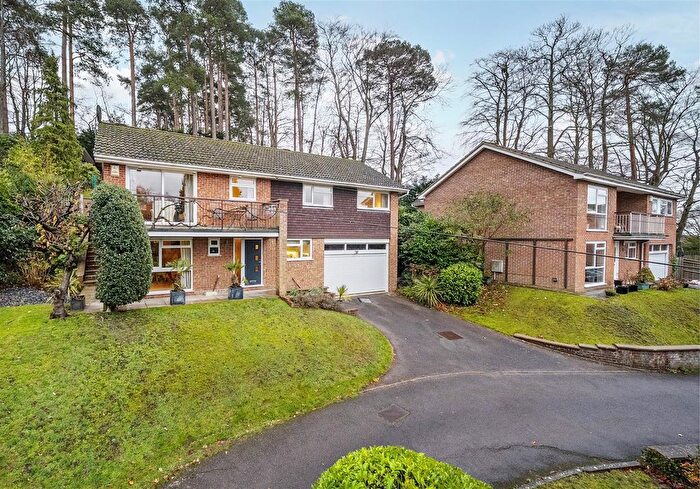
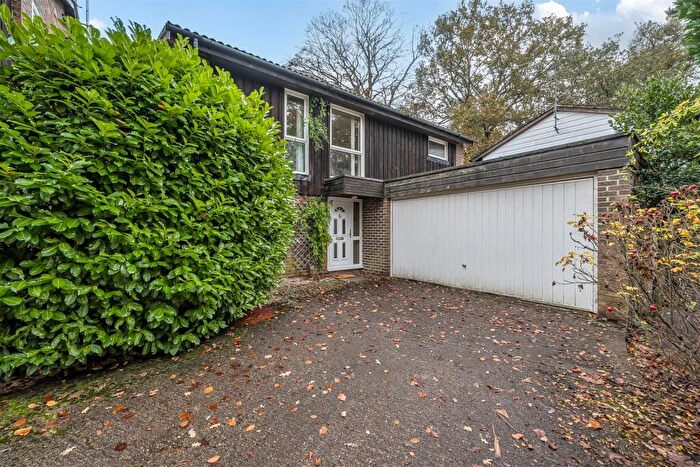
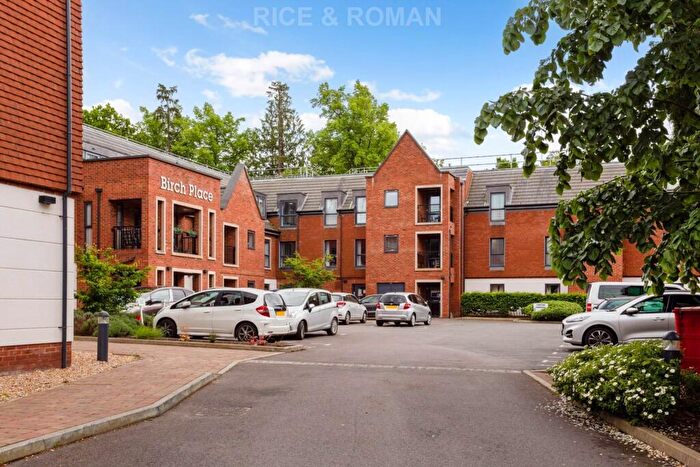
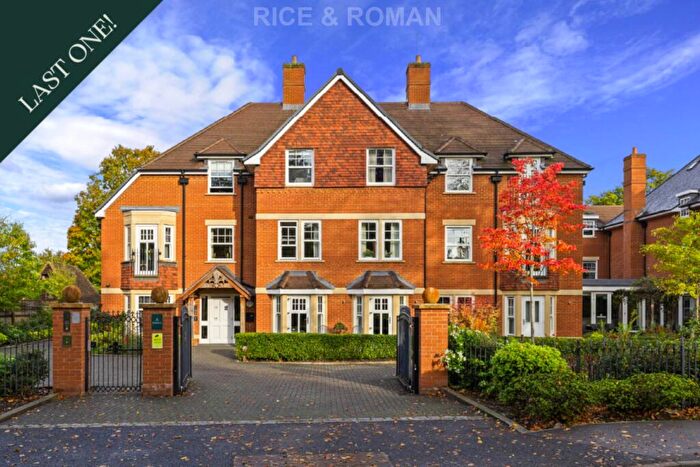
Houses for sale & to rent in Little Sandhurst And Wellington, Crowthorne
House Prices in Little Sandhurst And Wellington
Properties in Little Sandhurst And Wellington have an average house price of £437,377.00 and had 41 Property Transactions within the last 3 years¹.
Little Sandhurst And Wellington is an area in Crowthorne, Bracknell Forest with 435 households², where the most expensive property was sold for £1,200,000.00.
Properties for sale in Little Sandhurst And Wellington
Roads and Postcodes in Little Sandhurst And Wellington
Navigate through our locations to find the location of your next house in Little Sandhurst And Wellington, Crowthorne for sale or to rent.
| Streets | Postcodes |
|---|---|
| Back Drive | RG45 7QG |
| Byron Drive | RG45 7QJ |
| Chaucer Road | RG45 7QN |
| Connaught Close | RG45 7QE |
| Copenhagen Walk | RG45 7QU |
| Crowthorne Road | RG45 7PS |
| Edgbarrow Court | RG45 7QF |
| Fielding Gardens | RG45 7QW |
| Goldsmith Way | RG45 7QP |
| Hardy Green | RG45 7QR |
| Hougoumont Gate | RG45 6BF |
| Masefield Gardens | RG45 7QS RG45 7QT |
| Mordaunt Drive | RG45 7QQ |
| Sandhurst Road | RG45 7HS RG45 7HU |
| Shaw Park | RG45 7QL |
| Victoria Place | RG45 6EZ |
| Waterloo Road | RG45 7NP |
| Wokingham Road | RG45 7QA RG45 7QB RG45 7QD |
| GU46 6WD RG45 7PR RG45 7PT RG45 7PU |
Transport near Little Sandhurst And Wellington
- FAQ
- Price Paid By Year
- Property Type Price
Frequently asked questions about Little Sandhurst And Wellington
What is the average price for a property for sale in Little Sandhurst And Wellington?
The average price for a property for sale in Little Sandhurst And Wellington is £437,377. This amount is 2% lower than the average price in Crowthorne. There are 1,137 property listings for sale in Little Sandhurst And Wellington.
What streets have the most expensive properties for sale in Little Sandhurst And Wellington?
The streets with the most expensive properties for sale in Little Sandhurst And Wellington are Hardy Green at an average of £579,666 and Shaw Park at an average of £372,937.
What streets have the most affordable properties for sale in Little Sandhurst And Wellington?
The streets with the most affordable properties for sale in Little Sandhurst And Wellington are Copenhagen Walk at an average of £201,142 and Masefield Gardens at an average of £313,583.
Which train stations are available in or near Little Sandhurst And Wellington?
Some of the train stations available in or near Little Sandhurst And Wellington are Crowthorne, Sandhurst and Blackwater.
Property Price Paid in Little Sandhurst And Wellington by Year
The average sold property price by year was:
| Year | Average Sold Price | Price Change |
Sold Properties
|
|---|---|---|---|
| 2025 | £320,125 | -5% |
4 Properties |
| 2024 | £336,499 | -31% |
6 Properties |
| 2023 | £440,363 | -25% |
22 Properties |
| 2022 | £549,444 | 16% |
9 Properties |
| 2021 | £463,843 | 32% |
16 Properties |
| 2020 | £316,549 | -8% |
13 Properties |
| 2019 | £343,026 | -19% |
19 Properties |
| 2018 | £408,508 | -10% |
29 Properties |
| 2017 | £449,515 | 33% |
26 Properties |
| 2016 | £303,073 | 1% |
17 Properties |
| 2015 | £298,859 | 2% |
22 Properties |
| 2014 | £293,775 | -5% |
15 Properties |
| 2013 | £309,397 | -4% |
17 Properties |
| 2012 | £321,618 | 29% |
8 Properties |
| 2011 | £229,704 | 2% |
12 Properties |
| 2010 | £226,211 | -6% |
9 Properties |
| 2009 | £239,945 | 9% |
21 Properties |
| 2008 | £219,309 | -4% |
16 Properties |
| 2007 | £229,118 | -19% |
33 Properties |
| 2006 | £273,170 | 20% |
24 Properties |
| 2005 | £217,361 | 5% |
17 Properties |
| 2004 | £207,072 | -10% |
24 Properties |
| 2003 | £228,680 | 13% |
38 Properties |
| 2002 | £199,240 | 21% |
36 Properties |
| 2001 | £158,076 | -16% |
33 Properties |
| 2000 | £183,755 | 17% |
36 Properties |
| 1999 | £153,411 | 22% |
51 Properties |
| 1998 | £120,345 | 16% |
37 Properties |
| 1997 | £101,190 | -3% |
78 Properties |
| 1996 | £104,500 | 5% |
7 Properties |
| 1995 | £98,866 | - |
12 Properties |
Property Price per Property Type in Little Sandhurst And Wellington
Here you can find historic sold price data in order to help with your property search.
The average Property Paid Price for specific property types in the last three years are:
| Property Type | Average Sold Price | Sold Properties |
|---|---|---|
| Terraced House | £439,800.00 | 5 Terraced Houses |
| Flat | £288,412.00 | 23 Flats |
| Detached House | £729,166.00 | 12 Detached Houses |
| Semi Detached House | £350,000.00 | 1 Semi Detached House |

