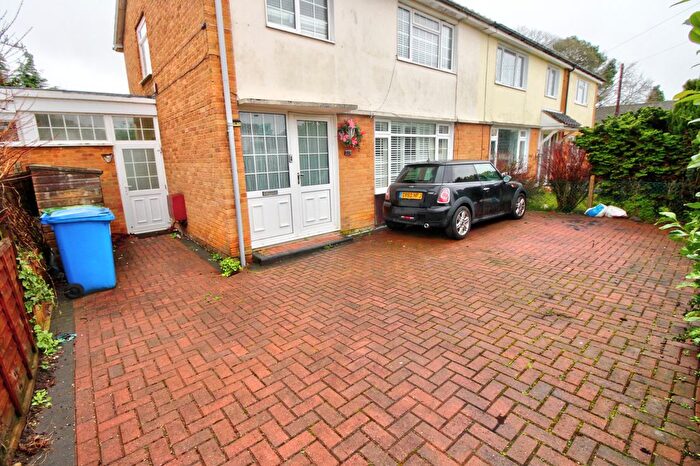
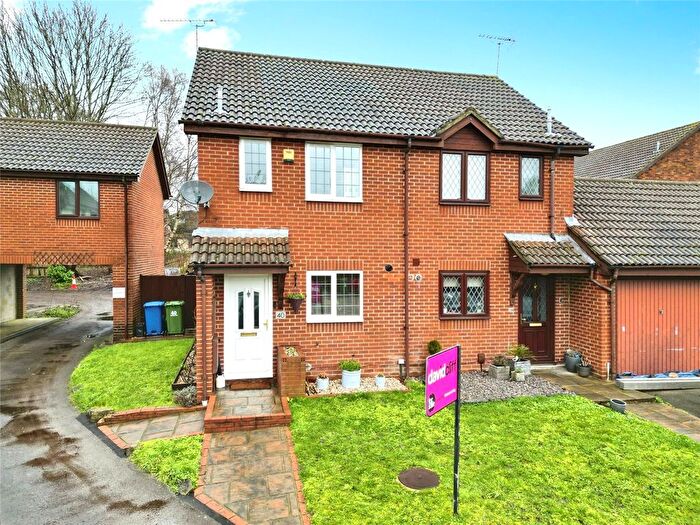
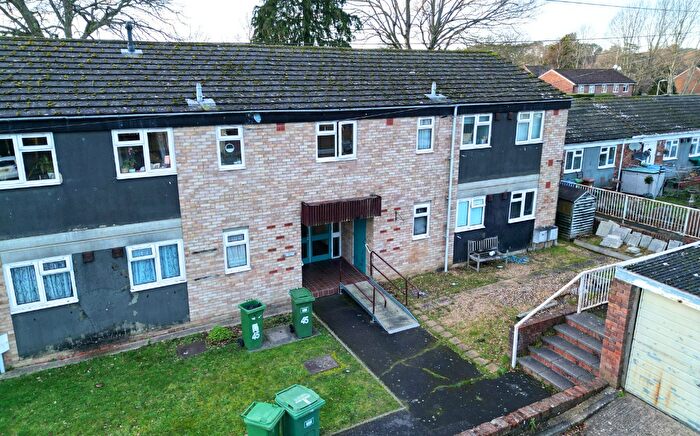
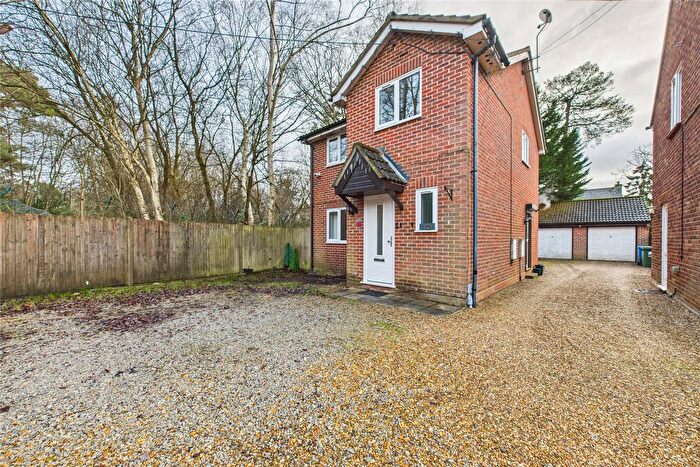
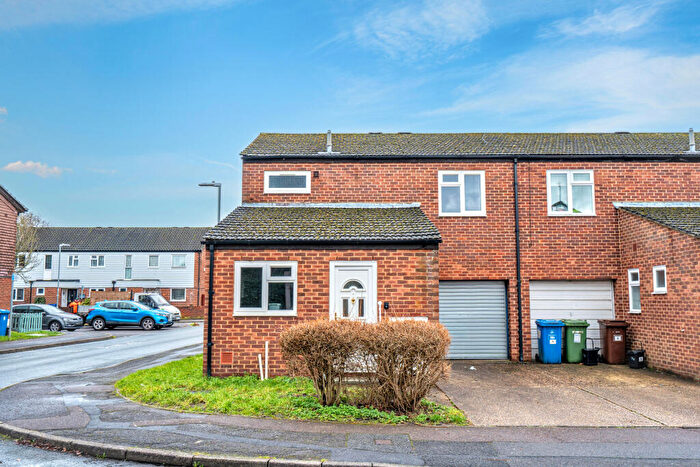
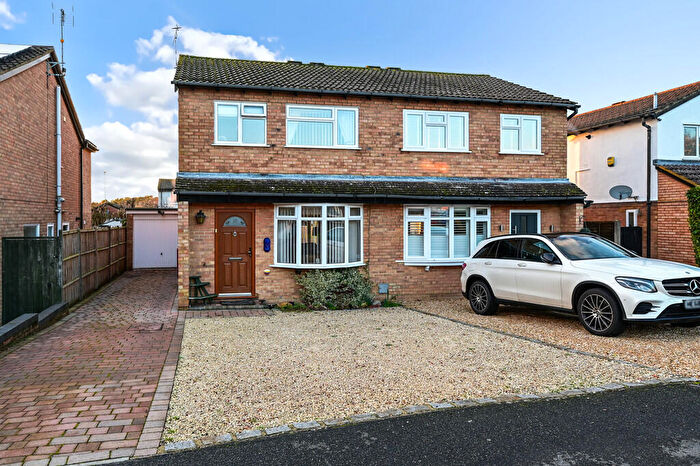
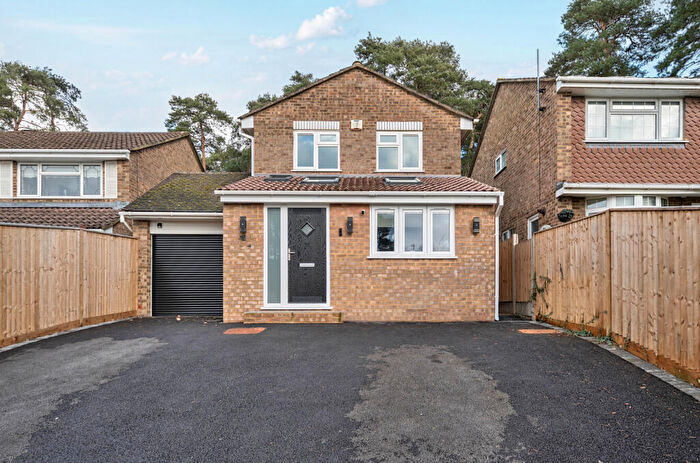
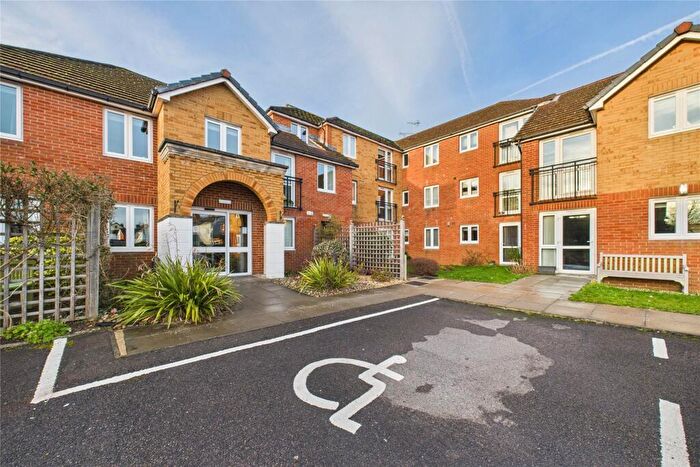
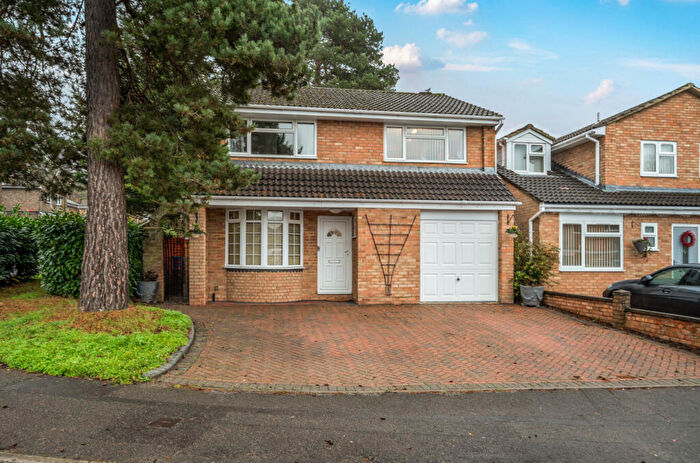
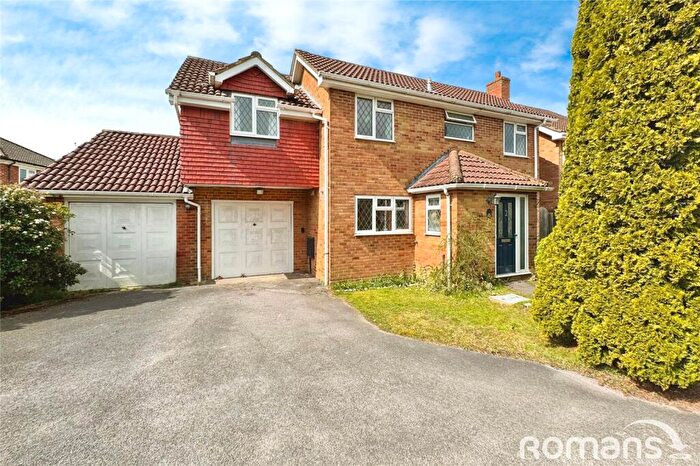
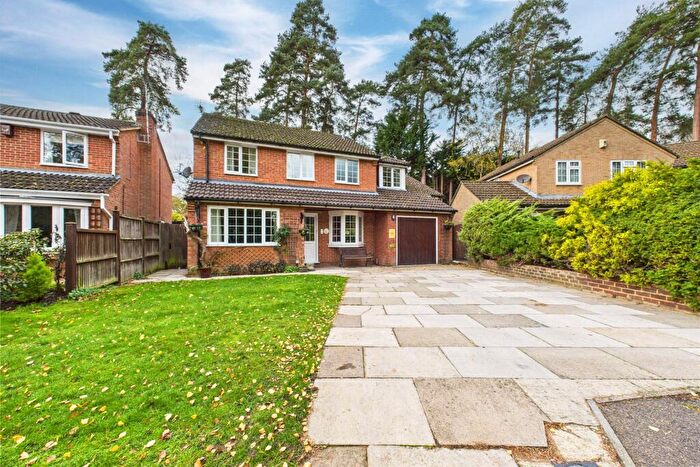
Houses for sale & to rent in Owlsmoor, Sandhurst
House Prices in Owlsmoor
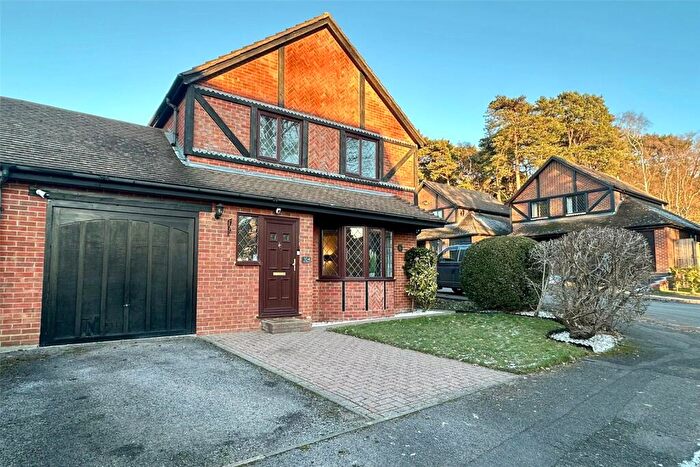
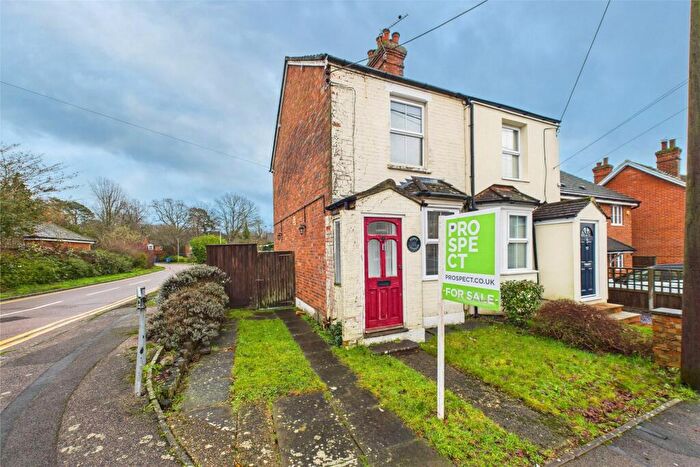
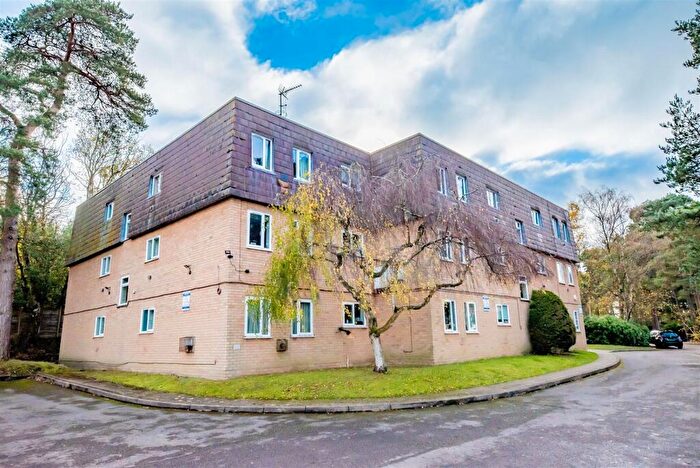
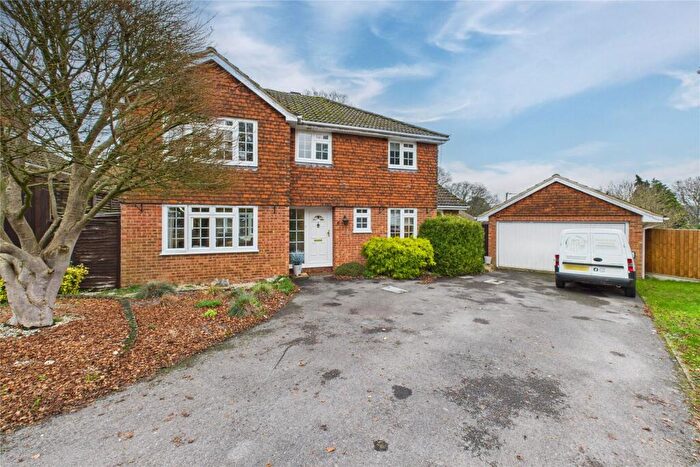
Properties in Owlsmoor have an average house price of £422,171.00 and had 174 Property Transactions within the last 3 years¹.
Owlsmoor is an area in Sandhurst, Bracknell Forest with 1,992 households², where the most expensive property was sold for £870,000.00.
Properties for sale in Owlsmoor
Roads and Postcodes in Owlsmoor
Navigate through our locations to find the location of your next house in Owlsmoor, Sandhurst for sale or to rent.
| Streets | Postcodes |
|---|---|
| Acacia Avenue | GU47 0RU GU47 0YH |
| Appletree Way | GU47 0UD |
| Balliol Way | GU47 0QN GU47 0UN |
| Barkis Mead | GU47 0GT |
| Birkbeck Place | GU47 0UL |
| Branksome Hill Road | GU47 0QL |
| Cambridge Road | GU47 0GR GU47 0SX GU47 0SZ GU47 0TA GU47 0UB |
| Cherrytree Close | GU47 0UH |
| Church Road | GU47 0TJ GU47 0TP |
| College Road | GU47 0RJ |
| Copperfield Avenue | GU47 0GZ |
| Crown Place | GU47 0UA |
| Culver Road | GU47 0SH |
| Darleydale Close | GU47 0YF |
| Dovedale Close | GU47 0YG |
| Durham Road | GU47 0GS GU47 0TZ |
| Evesham Walk | GU47 0YU |
| Fakenham Way | GU47 0YS GU47 0YW |
| Faversham Road | GU47 0YP |
| Frodsham Way | GU47 0TX |
| Georgeham Road | GU47 0YR |
| Girton Close | GU47 0UP |
| Glen Innes | GU47 0QJ |
| Grantham Close | GU47 0SY |
| Hailsham Close | GU47 0YN |
| Harvard Road | GU47 0UR GU47 0UY GU47 0XB |
| Hexham Close | GU47 0QP |
| Hormer Close | GU47 0QW |
| Hornbeam Close | GU47 0UE |
| Horsham Road | GU47 0YY GU47 0YZ |
| Keble Way | GU47 0XA |
| Keynsham Way | GU47 0SB |
| Kirkham Close | GU47 0QR |
| Lewisham Way | GU47 0YJ |
| Magdalene Road | GU47 0UT |
| Magnolia Close | GU47 0UF |
| May Close | GU47 0UG |
| Melksham Close | GU47 0YL |
| Merton Close | GU47 0TU |
| Millins Close | GU47 0TL |
| Moor Close | GU47 0TB |
| Mulberry Close | GU47 0UQ |
| Nuffield Drive | GU47 0UX |
| Oak Avenue | GU47 0SF GU47 0SG GU47 0SJ GU47 0SQ |
| Okingham Close | GU47 0YD |
| Owlsmoor Road | GU47 0SD GU47 0SP GU47 0SR GU47 0SS GU47 0ST GU47 0SU GU47 0SW |
| Oxford Road | GU47 0TR GU47 0TS |
| Peggotty Place | GU47 0GY |
| Peterhouse Close | GU47 0XD |
| Rookwood Avenue | GU47 0TW GU47 0TY |
| Rugby Close | GU47 0TT |
| St Georges Court | GU47 0LL |
| Steerforth Copse | GU47 0GX |
| Tottenham Walk | GU47 0YT |
| Trinity | GU47 0UZ |
| Trotwood Close | GU47 0GU |
| Union Close | GU47 0TN |
| Victoria Road | GU47 0TH GU47 0TQ |
| Wadham | GU47 0UU |
| Waltham Close | GU47 0YX |
| Wasdale Close | GU47 0YQ |
| Whitmore Close | GU47 0SE |
| Woodlands Court | GU47 0UW |
| Yale Close | GU47 0UJ |
| Yeovil Road | GU47 0TD GU47 0TF |
Transport near Owlsmoor
- FAQ
- Price Paid By Year
- Property Type Price
Frequently asked questions about Owlsmoor
What is the average price for a property for sale in Owlsmoor?
The average price for a property for sale in Owlsmoor is £422,171. This amount is 3% lower than the average price in Sandhurst. There are 1,466 property listings for sale in Owlsmoor.
What streets have the most expensive properties for sale in Owlsmoor?
The streets with the most expensive properties for sale in Owlsmoor are Georgeham Road at an average of £736,000, Wasdale Close at an average of £712,500 and Darleydale Close at an average of £656,666.
What streets have the most affordable properties for sale in Owlsmoor?
The streets with the most affordable properties for sale in Owlsmoor are Woodlands Court at an average of £161,277, Durham Road at an average of £220,000 and Cambridge Road at an average of £261,000.
Which train stations are available in or near Owlsmoor?
Some of the train stations available in or near Owlsmoor are Sandhurst, Blackwater and Crowthorne.
Property Price Paid in Owlsmoor by Year
The average sold property price by year was:
| Year | Average Sold Price | Price Change |
Sold Properties
|
|---|---|---|---|
| 2025 | £444,654 | 4% |
48 Properties |
| 2024 | £426,582 | 6% |
67 Properties |
| 2023 | £398,870 | -2% |
59 Properties |
| 2022 | £405,633 | 9% |
77 Properties |
| 2021 | £367,277 | 5% |
104 Properties |
| 2020 | £350,058 | 4% |
64 Properties |
| 2019 | £335,055 | -4% |
71 Properties |
| 2018 | £348,565 | -2% |
76 Properties |
| 2017 | £357,086 | 8% |
87 Properties |
| 2016 | £329,605 | 16% |
87 Properties |
| 2015 | £278,162 | - |
94 Properties |
| 2014 | £278,120 | 12% |
117 Properties |
| 2013 | £243,945 | 0,1% |
95 Properties |
| 2012 | £243,698 | 2% |
97 Properties |
| 2011 | £238,410 | -2% |
67 Properties |
| 2010 | £242,108 | 8% |
79 Properties |
| 2009 | £223,855 | 1% |
66 Properties |
| 2008 | £222,063 | -8% |
73 Properties |
| 2007 | £240,132 | 4% |
162 Properties |
| 2006 | £230,030 | 13% |
140 Properties |
| 2005 | £199,511 | 0,2% |
131 Properties |
| 2004 | £199,200 | 5% |
179 Properties |
| 2003 | £189,308 | 14% |
144 Properties |
| 2002 | £162,068 | 5% |
178 Properties |
| 2001 | £154,146 | 15% |
194 Properties |
| 2000 | £131,662 | 16% |
182 Properties |
| 1999 | £110,753 | 7% |
217 Properties |
| 1998 | £103,503 | 16% |
116 Properties |
| 1997 | £86,728 | 8% |
210 Properties |
| 1996 | £80,152 | 4% |
177 Properties |
| 1995 | £77,337 | - |
120 Properties |
Property Price per Property Type in Owlsmoor
Here you can find historic sold price data in order to help with your property search.
The average Property Paid Price for specific property types in the last three years are:
| Property Type | Average Sold Price | Sold Properties |
|---|---|---|
| Semi Detached House | £440,225.00 | 36 Semi Detached Houses |
| Detached House | £556,803.00 | 61 Detached Houses |
| Terraced House | £341,502.00 | 60 Terraced Houses |
| Flat | £185,558.00 | 17 Flats |

