
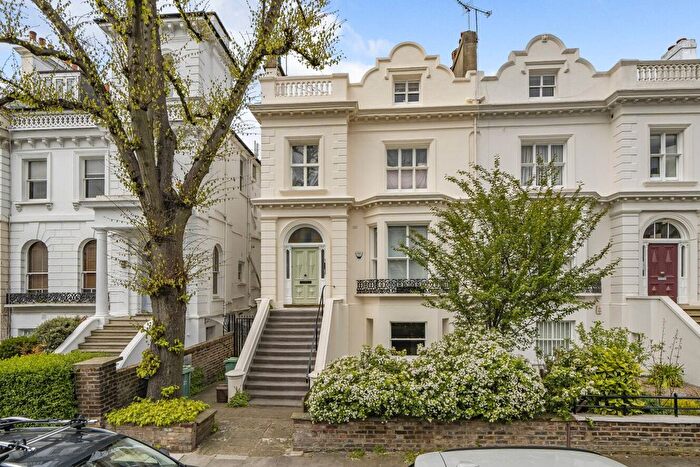
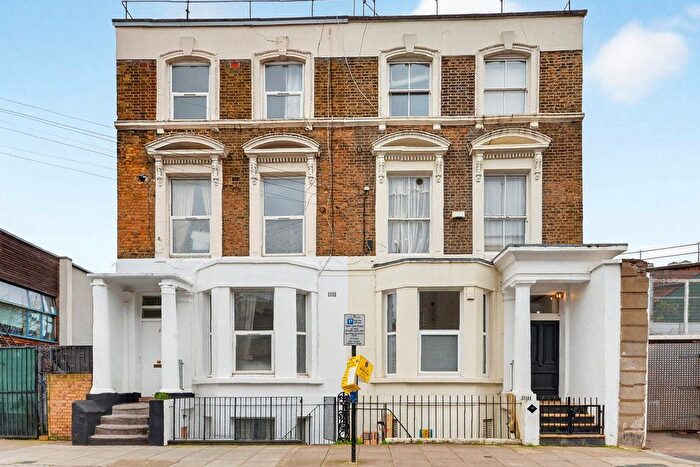
Houses for sale & to rent in Kilburn, London
House Prices in Kilburn
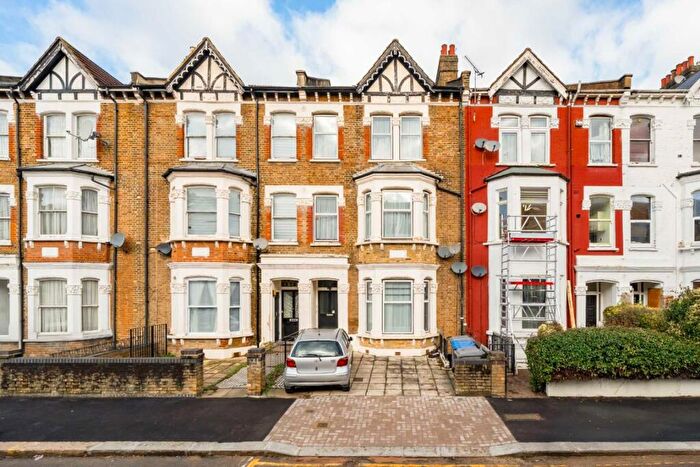
Properties in this part of Kilburn within London have an average house price of £717k and had 424 Property Transactions within the last 3 years¹. This area has 7,251 households² , where the most expensive property was sold for £3.66M.
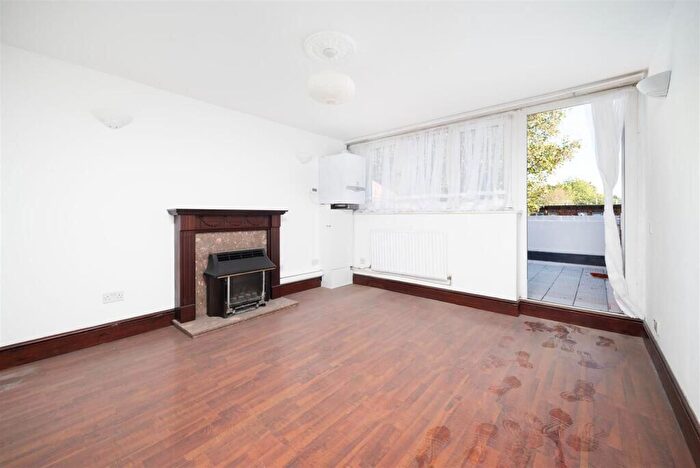
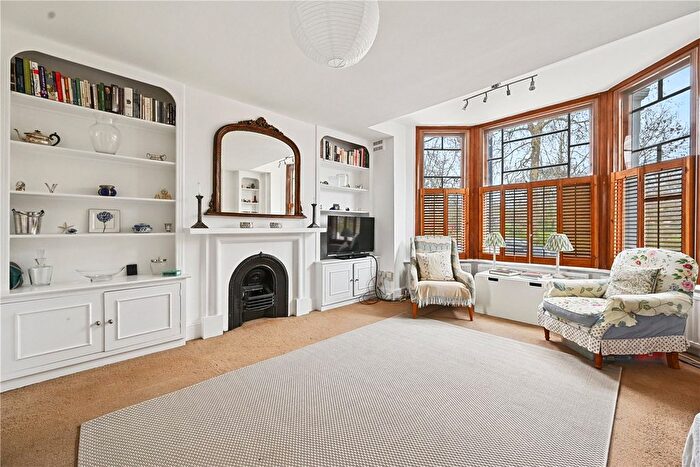
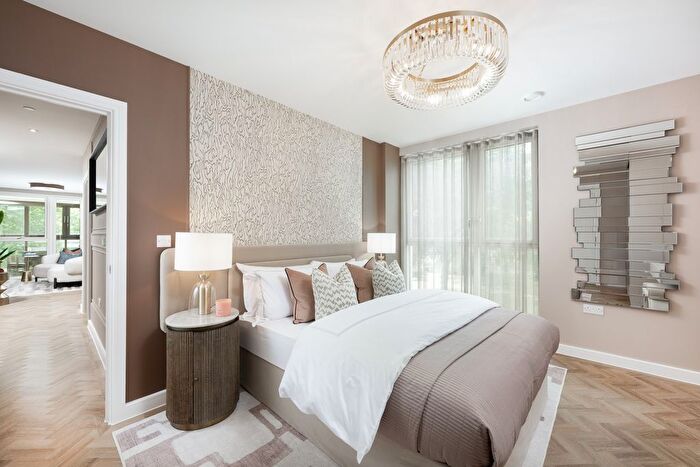
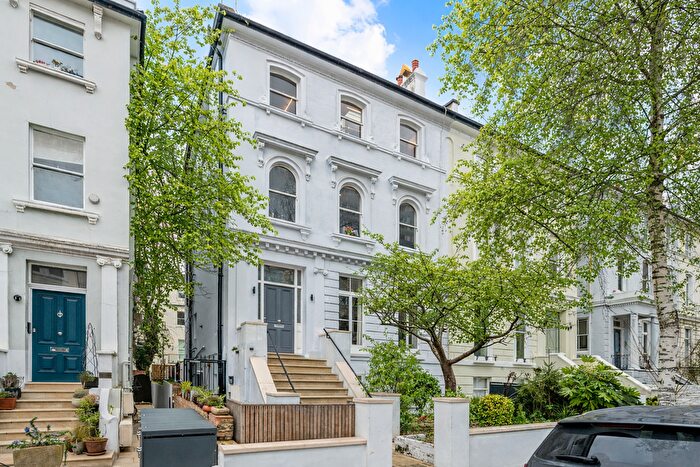
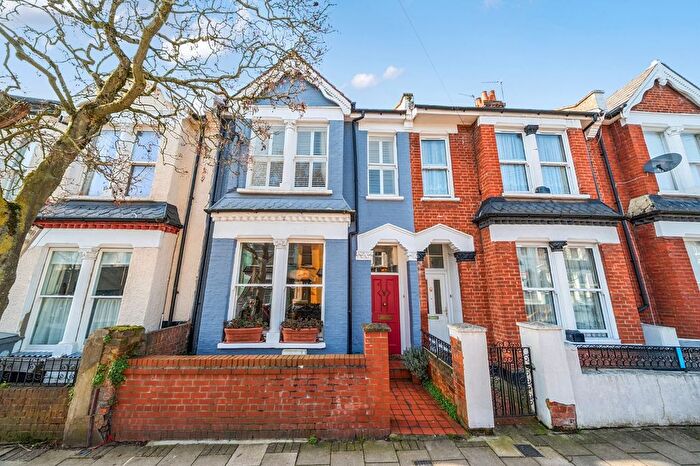
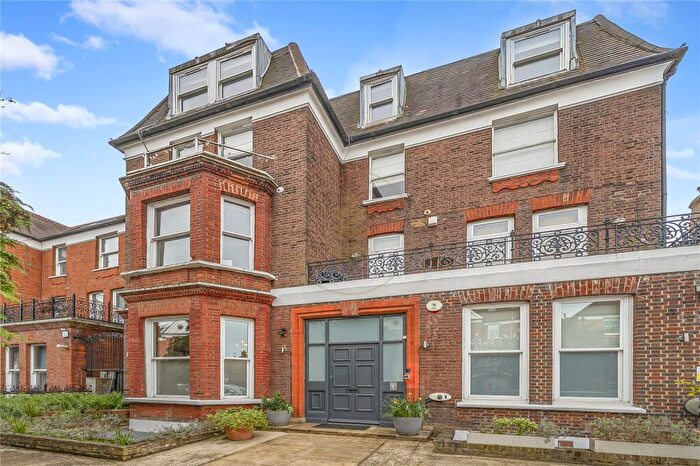
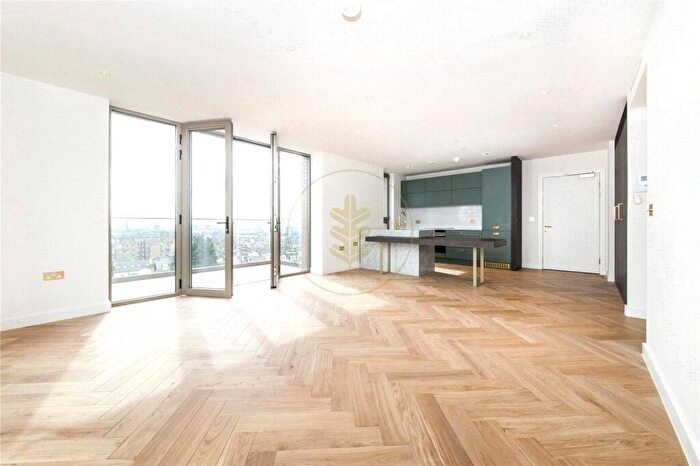
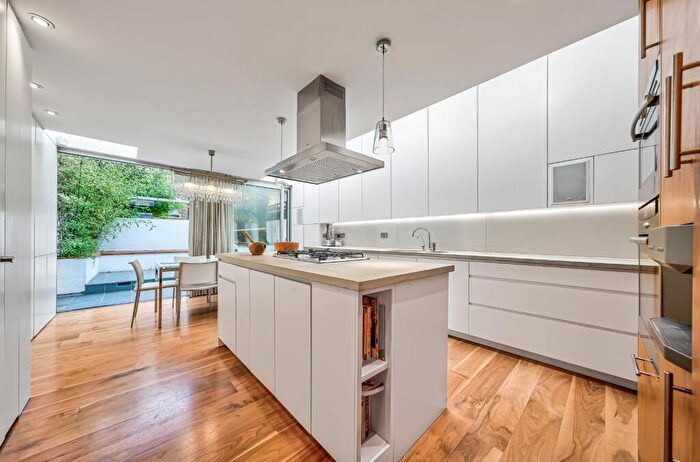
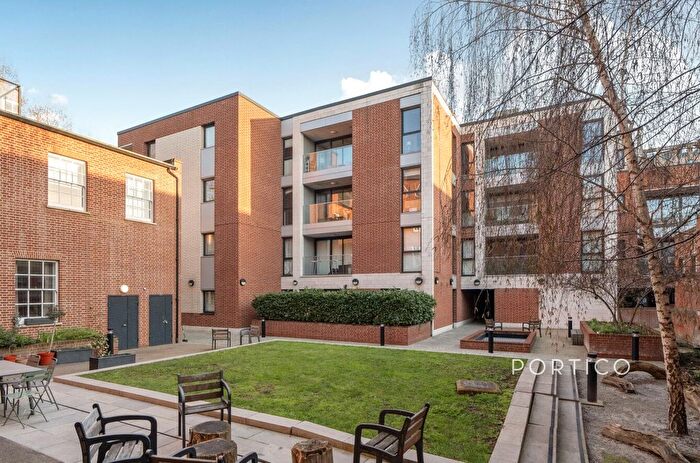
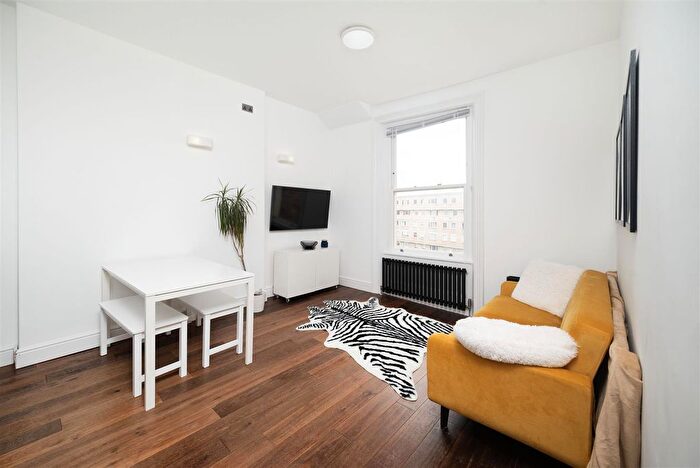
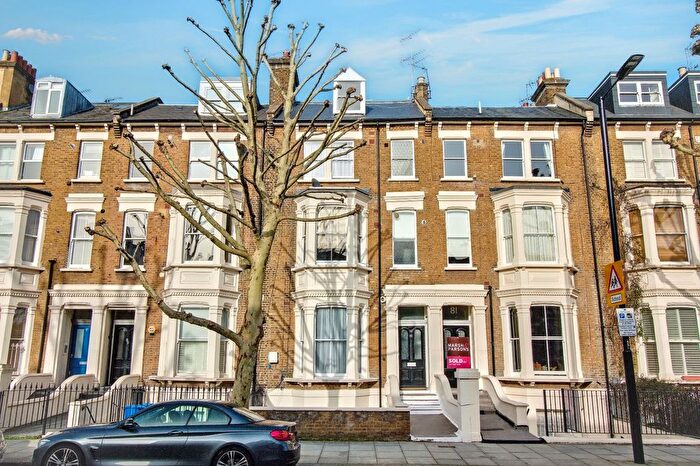
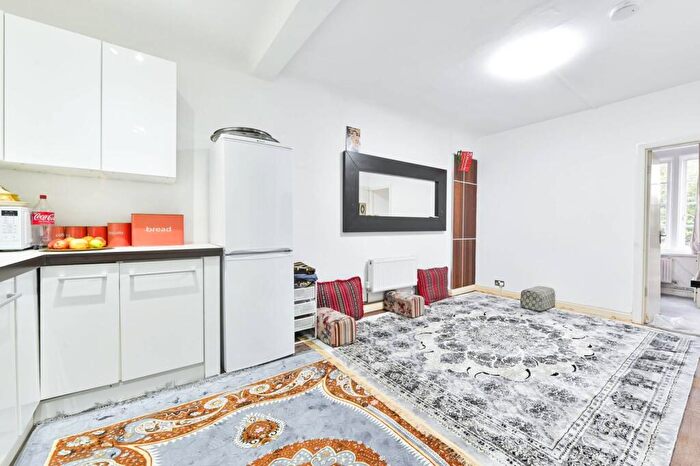
Properties for sale in Kilburn


![]()
If you are looking to sell your house, let it out, or receive a property valuation, an expert can help you.
Click the button below to get started.
Roads and Postcodes in Kilburn
Navigate through our locations to find the location of your next house in Kilburn, London for sale or to rent.
Transport near Kilburn
-
 Kilburn Park Station
 -

 Kilburn High Road Station
 -
Queens Park Station
-
Brondesbury Park Station
-
Brondesbury Station
-
Maida Vale Station
-
Kilburn Station
-
West Hampstead Station
-
West Hampstead Thameslink Station
-
South Hampstead Station
- FAQ
- Price Paid By Year
- Property Type Price
Frequently asked questions about Kilburn
What is the average price for a property for sale in Kilburn?
The average price for a property for sale in Kilburn is £716,510. This amount is 3% higher than the average price in London. There are 8,350 property listings for sale in Kilburn.
What streets have the most expensive properties for sale in Kilburn?
The streets with the most expensive properties for sale in Kilburn are Burton Road at an average of £1,500,000, Tennyson Road at an average of £1,447,222 and Donaldson Road at an average of £1,406,666.
What streets have the most affordable properties for sale in Kilburn?
The streets with the most affordable properties for sale in Kilburn are Chippenham Gardens at an average of £175,000, Canterbury Terrace at an average of £300,000 and Canterbury Road at an average of £328,333.
Which train stations are available in or near Kilburn?
Some of the train stations available in or near Kilburn are Kilburn High Road, Queens Park and Brondesbury Park.
Which tube stations are available in or near Kilburn?
Some of the tube stations available in or near Kilburn are Kilburn Park, Queens Park and Maida Vale.
Property Price Paid in Kilburn by Year
The average sold property price by year was:
| Year | Average Sold Price | Price Change |
Sold Properties
|
|---|---|---|---|
| 2025 | £664,844 | -15% |
116 Properties |
| 2024 | £765,232 | 10% |
189 Properties |
| 2023 | £689,494 | 5% |
119 Properties |
| 2022 | £654,990 | -19% |
194 Properties |
| 2021 | £776,324 | 4% |
199 Properties |
| 2020 | £748,666 | 13% |
141 Properties |
| 2019 | £651,881 | 1% |
152 Properties |
| 2018 | £646,299 | 2% |
168 Properties |
| 2017 | £631,597 | -0,1% |
263 Properties |
| 2016 | £632,515 | 9% |
341 Properties |
| 2015 | £576,739 | 9% |
277 Properties |
| 2014 | £525,955 | 12% |
231 Properties |
| 2013 | £464,599 | -3% |
225 Properties |
| 2012 | £480,085 | 14% |
134 Properties |
| 2011 | £414,850 | 11% |
149 Properties |
| 2010 | £369,734 | 8% |
198 Properties |
| 2009 | £338,918 | -21% |
166 Properties |
| 2008 | £410,977 | 11% |
93 Properties |
| 2007 | £367,070 | 18% |
259 Properties |
| 2006 | £301,390 | 2% |
243 Properties |
| 2005 | £293,951 | 9% |
183 Properties |
| 2004 | £268,126 | 7% |
222 Properties |
| 2003 | £249,987 | 7% |
195 Properties |
| 2002 | £231,919 | 11% |
273 Properties |
| 2001 | £207,267 | 10% |
240 Properties |
| 2000 | £185,614 | 22% |
227 Properties |
| 1999 | £144,760 | 1% |
241 Properties |
| 1998 | £142,671 | 27% |
216 Properties |
| 1997 | £103,731 | 11% |
257 Properties |
| 1996 | £92,237 | 12% |
186 Properties |
| 1995 | £81,264 | - |
174 Properties |
Property Price per Property Type in Kilburn
Here you can find historic sold price data in order to help with your property search.
The average Property Paid Price for specific property types in the last three years are:
| Property Type | Average Sold Price | Sold Properties |
|---|---|---|
| Semi Detached House | £944,000.00 | 5 Semi Detached Houses |
| Terraced House | £1,339,350.00 | 87 Terraced Houses |
| Flat | £546,955.00 | 331 Flats |
| Detached House | £1,515,000.00 | 1 Detached House |