
Houses for sale in Brent London Borough, England
House Prices in Brent London Borough
Properties in Brent London Borough have
an average house price of
£629k
and had 6,657 Property Transactions
within the last 3 years.¹
Brent London Borough is a location in
England with
119,071 households², where the most expensive property was sold for £5.1M.
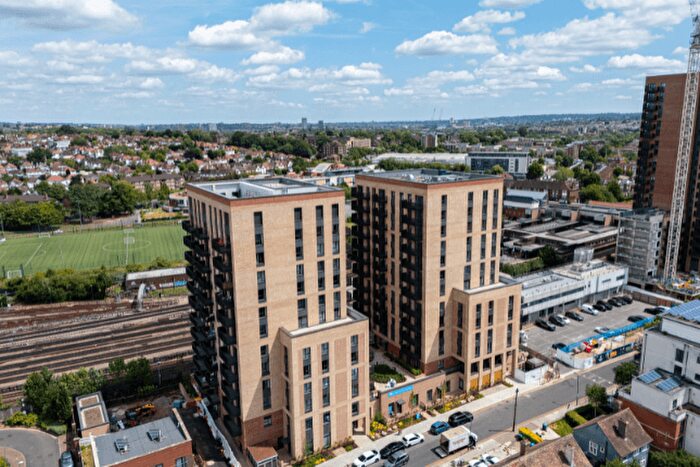
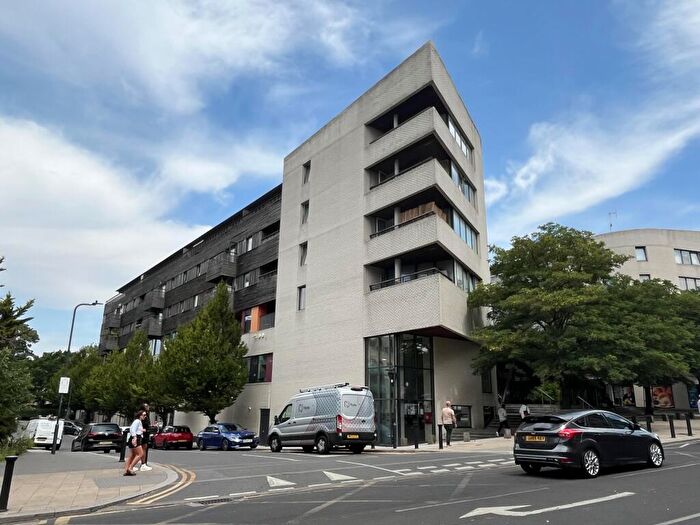
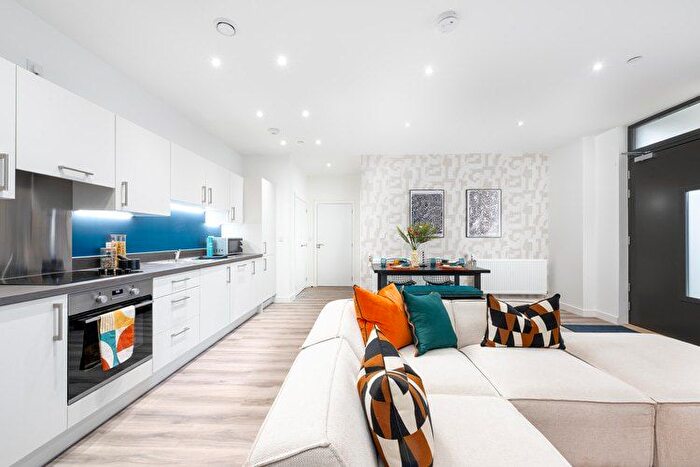
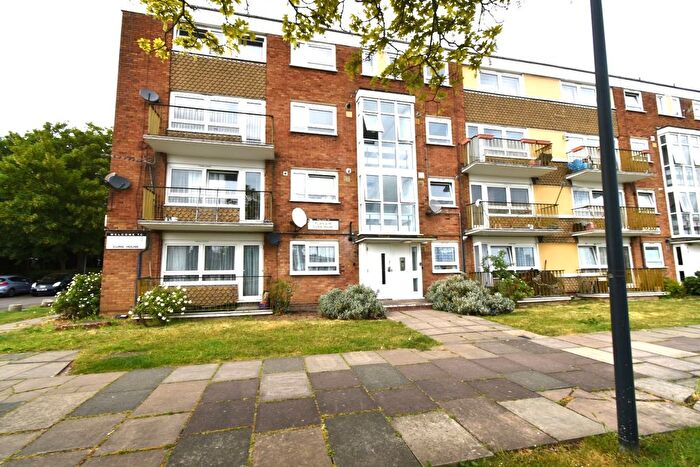
Properties for sale in Brent London Borough
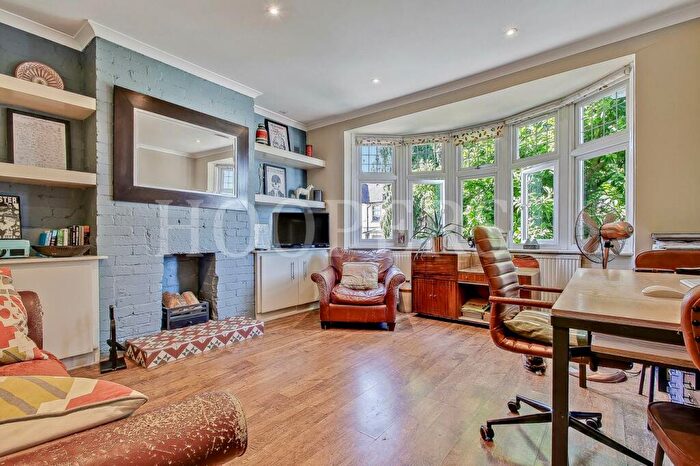


![]()
If you are looking to sell your house, let it out, or receive a property valuation, an expert can help you.
Click the button below to get started.
Towns in Brent London Borough
Navigate through our locations to find the location of your next house in Brent, England for sale or to rent.
Property price trends in Brent London Borough
According to the latest Land Registry data, the average home in Brent London Borough sold for £567,601 in 2026. That figure comes from a substantial record of 99,191 sales logged over the past 31 years.
Prices have fallen back over the last three years. Compared with 2023, when the typical sale came in around £635,640, that's a fall of roughly 10.7%.
Looking back five years, average prices are down about 6% since 2021, a drop of around £36,146 in cash terms.
Zoom out to the past decade for the fuller picture. Back in 2016, homes here averaged £510,429, so the typical sold price has climbed about 11.2% since then, roughly 1.1% a year. Stretch the view to fifteen years and that annual pace edges up closer to 3.1%.
Frequently asked questions about Brent London Borough
What is the average price for a property for sale in Brent London Borough?
The average price for a property for sale in Brent London Borough is £629,347. This amount is 75% higher than the average price in England. There are more than 10,000 property listings for sale in Brent London Borough.
What locations have the most expensive properties for sale in Brent London Borough?
The locations with the most expensive properties for sale in Brent London Borough are London at an average of £690,976 and Harrow at an average of £637,358.
What locations have the most affordable properties for sale in Brent London Borough?
The locations with the most affordable properties for sale in Brent London Borough are Wembley at an average of £480,066 and Edgware at an average of £513,775.
Which train stations are available in or near Brent London Borough?
Some of the train stations available in or near Brent London Borough are Stonebridge Park, Wembley Stadium and Harlesden.
Which tube stations are available in or near Brent London Borough?
Some of the tube stations available in or near Brent London Borough are Neasden, Dollis Hill and Wembley Park.
Property Price Paid in Brent London Borough by Year
The average sold property price by year was:
| Year | Average Sold Price | Price Change |
Sold Properties
|
|---|---|---|---|
| 2026 | £567,601 | -9% |
324 Properties |
| 2025 | £618,414 | -4% |
2,194 Properties |
| 2024 | £643,591 | 1% |
2,257 Properties |
| 2023 | £635,640 | -4% |
1,882 Properties |
| 2022 | £661,103 | 9% |
2,444 Properties |
| 2021 | £603,747 | 2% |
2,981 Properties |
| 2020 | £592,094 | 3% |
2,048 Properties |
| 2019 | £572,248 | 4% |
2,066 Properties |
| 2018 | £550,435 | -2% |
2,508 Properties |
| 2017 | £559,902 | 9% |
2,646 Properties |
Property Price per Property Type in Brent London Borough
Here you can find historic sold price data in order to help with your property search.
The average Property Paid Price for specific property types in the last three years are:
| Property Type | Average Sold Price | Sold Properties |
|---|---|---|
| Semi Detached House | £772,017.00 | 1,291 Semi Detached Houses |
| Terraced House | £875,990.00 | 1,586 Terraced Houses |
| Detached House | £1,216,697.00 | 269 Detached Houses |
| Flat | £420,472.00 | 3,511 Flats |
Transport in Brent London Borough
Please see below transportation links in this area:


