
Houses for sale & to rent in Mapesbury, London
House Prices in Mapesbury
Properties in this part of Mapesbury within London have an average house price of £794,801.00 and had 414 Property Transactions within the last 3 years¹. This area has 6,289 households² , where the most expensive property was sold for £3,900,000.00.
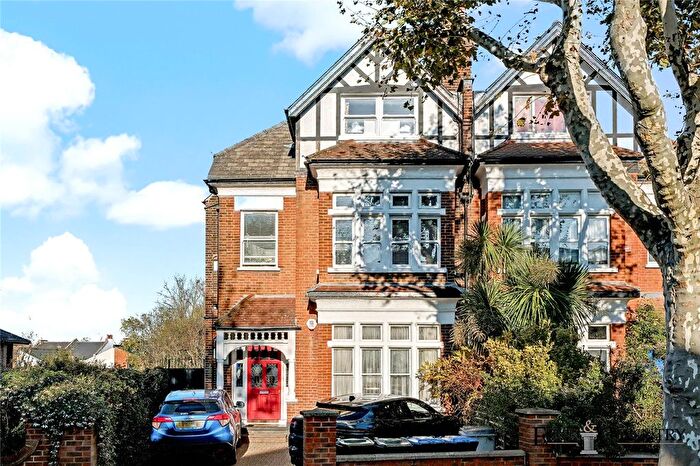
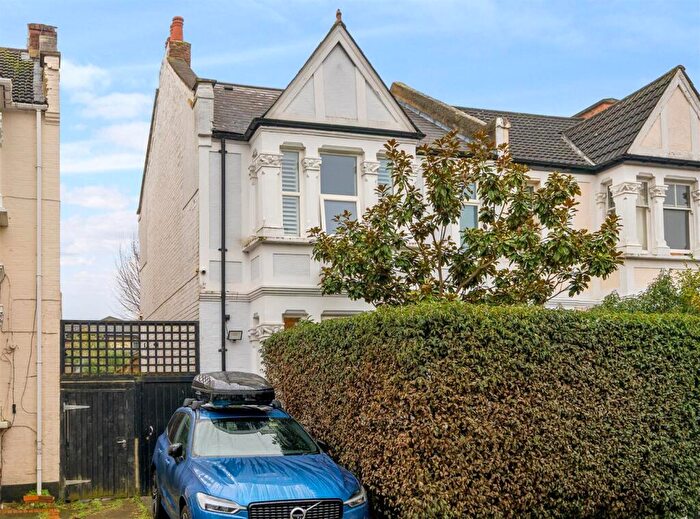
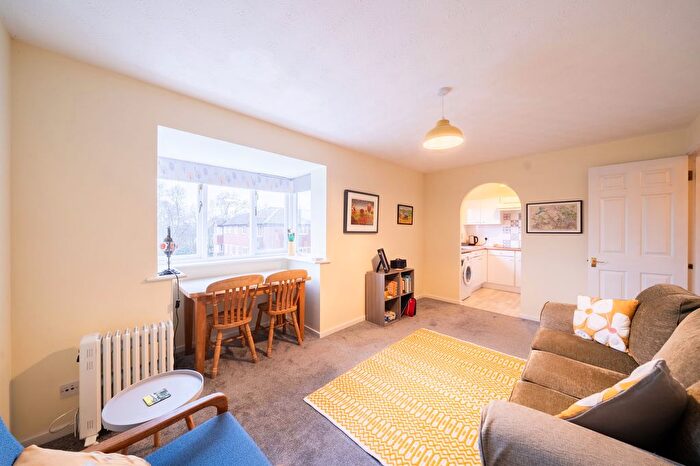
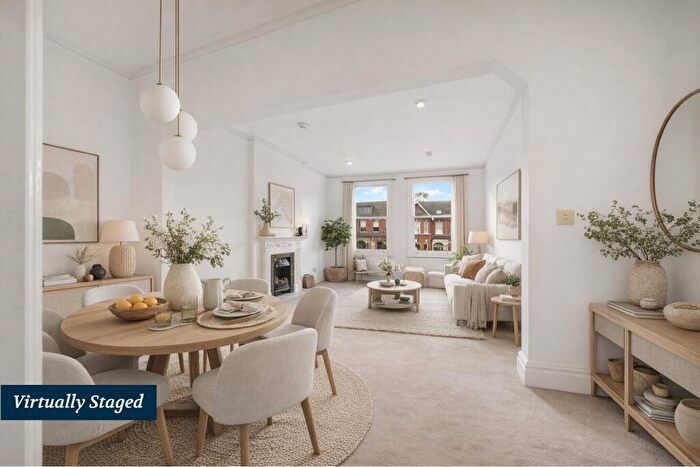
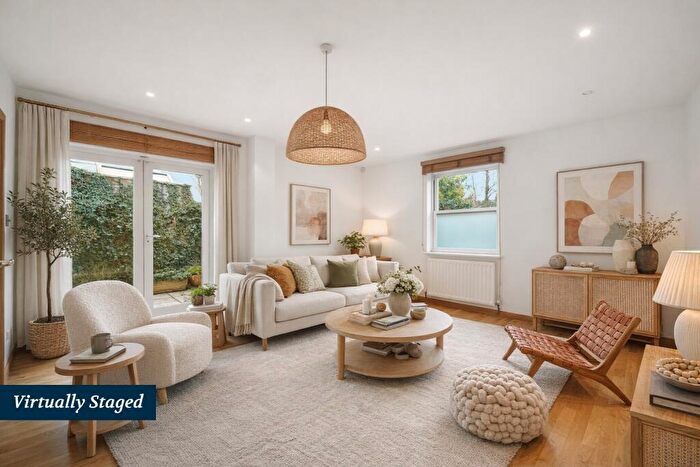
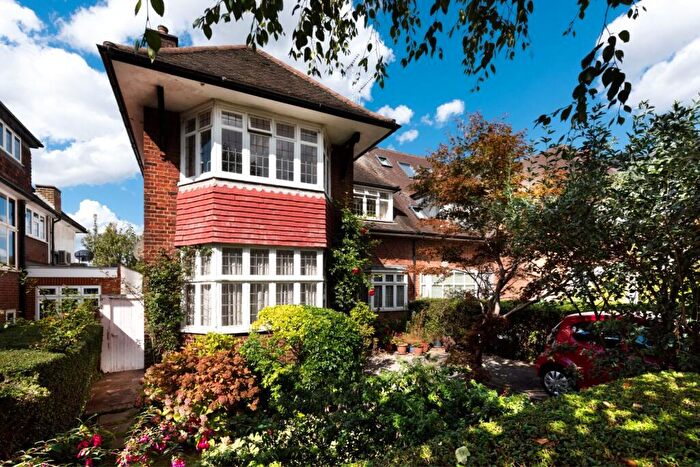
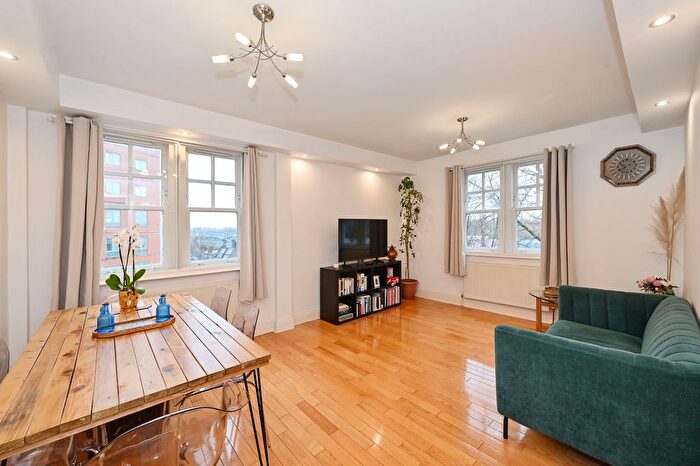
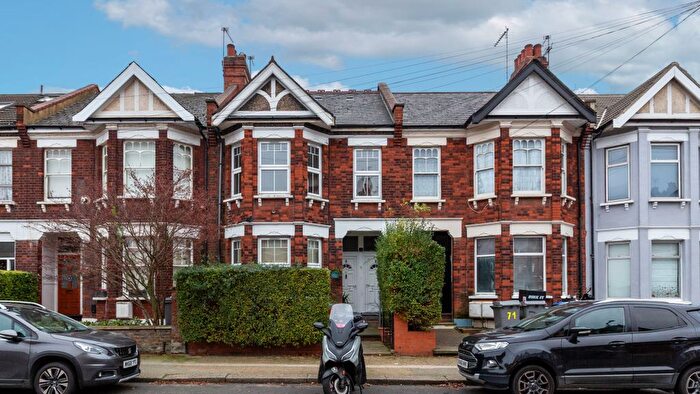
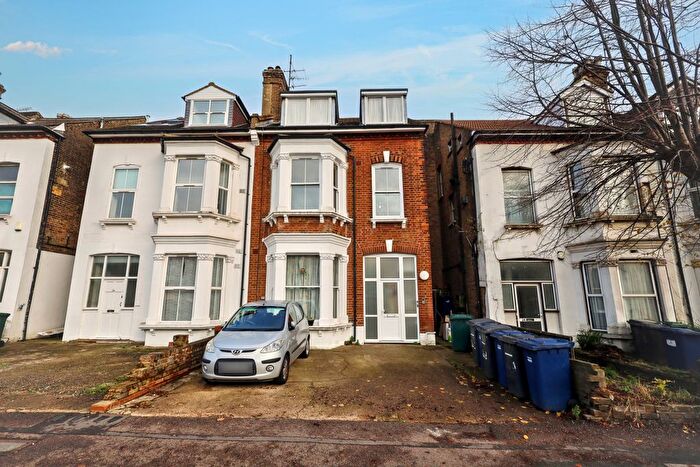
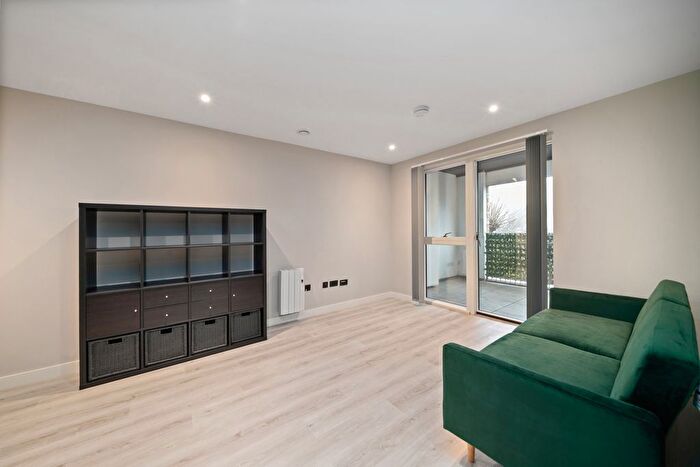
Properties for sale in Mapesbury
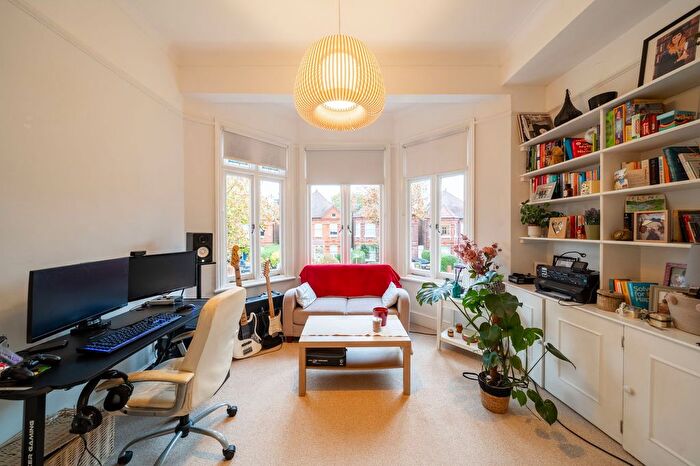
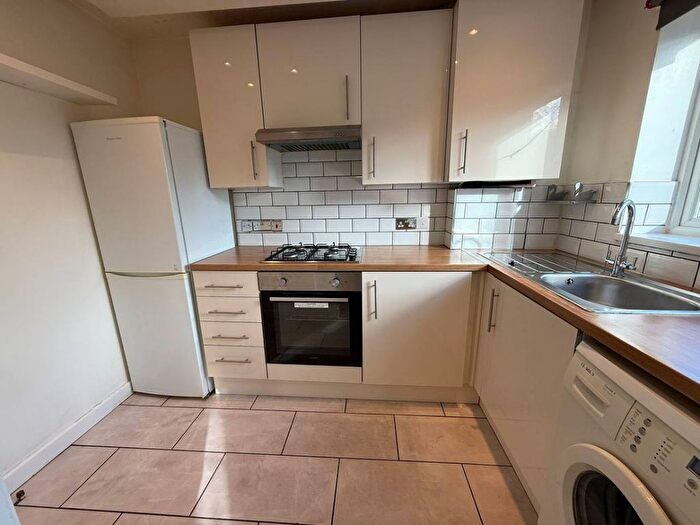
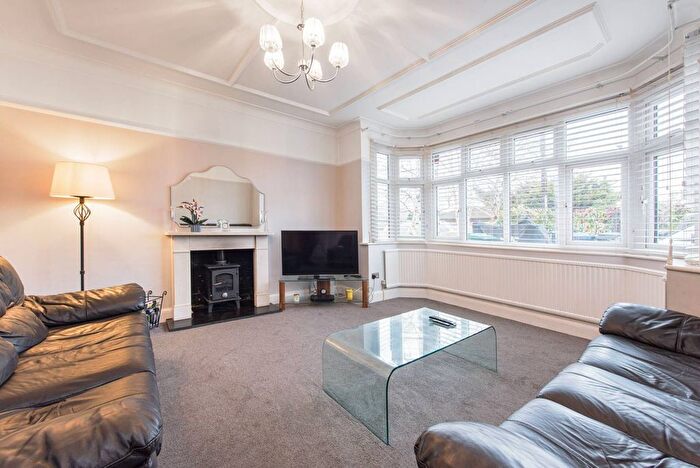
![]()
If you are looking to sell your house, let it out, or receive a property valuation, an expert can help you.
Click the button below to get started.


Roads and Postcodes in Mapesbury
Navigate through our locations to find the location of your next house in Mapesbury, London for sale or to rent.
Transport near Mapesbury
-
 Willesden Green Station
 -
 Cricklewood Station
 -
Kilburn Station
-
Dollis Hill Station
-
 Brondesbury Station
 -
Brondesbury Park Station
-
West Hampstead Thameslink Station
-
West Hampstead Station
-
Kensal Rise Station
-
Neasden Station
- FAQ
- Price Paid By Year
- Property Type Price
Frequently asked questions about Mapesbury
What is the average price for a property for sale in Mapesbury?
The average price for a property for sale in Mapesbury is £794,801. This amount is 12% higher than the average price in London. There are 5,182 property listings for sale in Mapesbury.
What streets have the most expensive properties for sale in Mapesbury?
The streets with the most expensive properties for sale in Mapesbury are Wren Avenue at an average of £1,599,950, St Gabriels Road at an average of £1,564,041 and Meredith Avenue at an average of £1,452,500.
What streets have the most affordable properties for sale in Mapesbury?
The streets with the most affordable properties for sale in Mapesbury are Rusper Close at an average of £181,000, St Michaels Road at an average of £261,875 and Station Parade at an average of £315,500.
Which train stations are available in or near Mapesbury?
Some of the train stations available in or near Mapesbury are Cricklewood, Brondesbury and Brondesbury Park.
Which tube stations are available in or near Mapesbury?
Some of the tube stations available in or near Mapesbury are Willesden Green, Kilburn and Dollis Hill.
Property Price Paid in Mapesbury by Year
The average sold property price by year was:
| Year | Average Sold Price | Price Change |
Sold Properties
|
|---|---|---|---|
| 2025 | £796,915 | 1% |
68 Properties |
| 2024 | £790,075 | 5% |
93 Properties |
| 2023 | £754,170 | -11% |
120 Properties |
| 2022 | £833,685 | 16% |
133 Properties |
| 2021 | £702,339 | -2% |
164 Properties |
| 2020 | £716,395 | -3% |
97 Properties |
| 2019 | £737,072 | 6% |
125 Properties |
| 2018 | £696,418 | 6% |
122 Properties |
| 2017 | £652,671 | -4% |
106 Properties |
| 2016 | £680,422 | 10% |
157 Properties |
| 2015 | £609,860 | 7% |
184 Properties |
| 2014 | £570,209 | 11% |
210 Properties |
| 2013 | £508,308 | 8% |
178 Properties |
| 2012 | £466,295 | 3% |
133 Properties |
| 2011 | £452,357 | 1% |
128 Properties |
| 2010 | £445,951 | -2% |
152 Properties |
| 2009 | £453,622 | 12% |
93 Properties |
| 2008 | £399,120 | 1% |
99 Properties |
| 2007 | £393,172 | 12% |
258 Properties |
| 2006 | £345,939 | 6% |
250 Properties |
| 2005 | £325,394 | 4% |
197 Properties |
| 2004 | £310,849 | 12% |
233 Properties |
| 2003 | £274,216 | 2% |
226 Properties |
| 2002 | £269,017 | 18% |
261 Properties |
| 2001 | £220,135 | 10% |
299 Properties |
| 2000 | £198,759 | 17% |
276 Properties |
| 1999 | £164,556 | 17% |
363 Properties |
| 1998 | £136,825 | 9% |
294 Properties |
| 1997 | £124,139 | 19% |
289 Properties |
| 1996 | £100,187 | 3% |
212 Properties |
| 1995 | £97,555 | - |
217 Properties |
Property Price per Property Type in Mapesbury
Here you can find historic sold price data in order to help with your property search.
The average Property Paid Price for specific property types in the last three years are:
| Property Type | Average Sold Price | Sold Properties |
|---|---|---|
| Flat | £482,774.00 | 268 Flats |
| Semi Detached House | £1,340,646.00 | 51 Semi Detached Houses |
| Detached House | £2,361,322.00 | 31 Detached Houses |
| Terraced House | £907,661.00 | 64 Terraced Houses |