
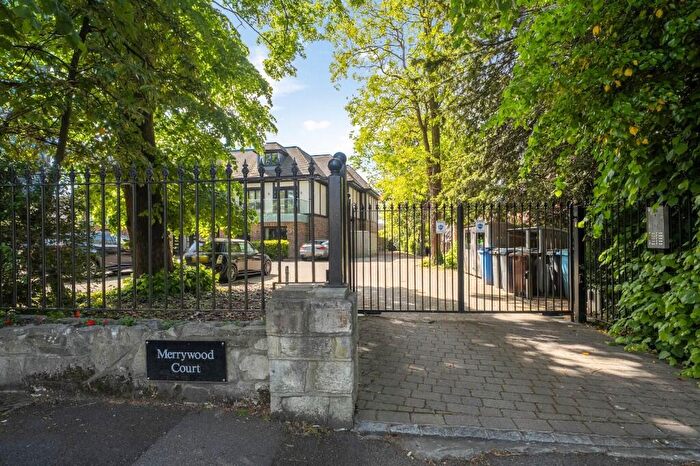
Houses for sale & to rent in Bickley, Chislehurst
House Prices in Bickley
Properties in this part of Bickley within Chislehurst have an average house price of £1.29M and had 22 Property Transactions within the last 3 years¹. This area has 261 households² , where the most expensive property was sold for £2.75M.
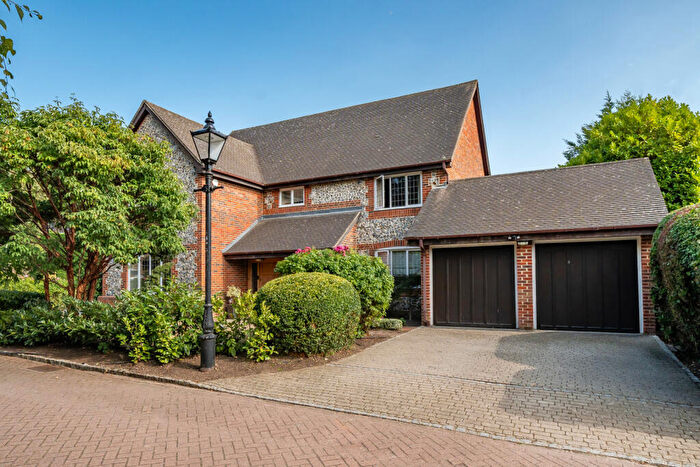
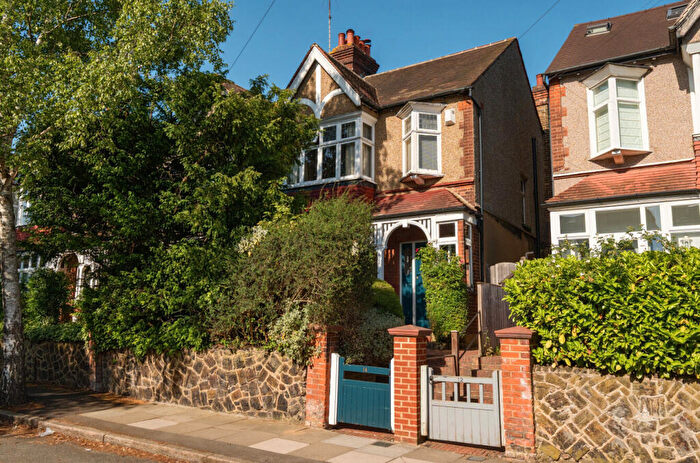
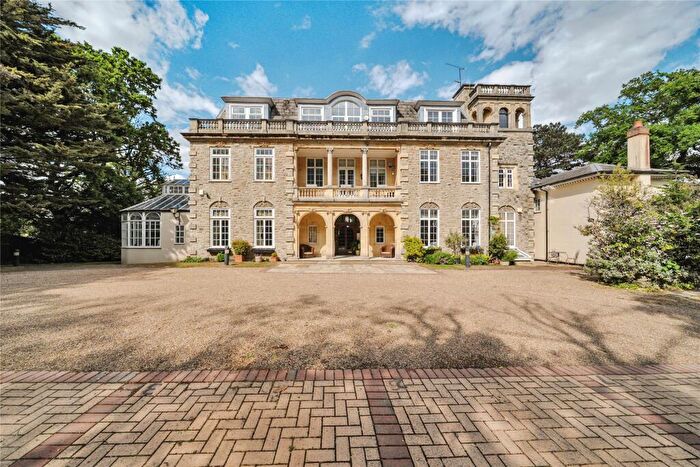
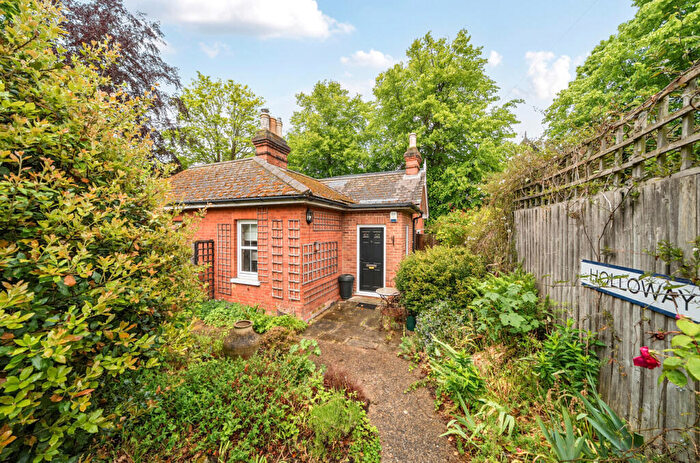
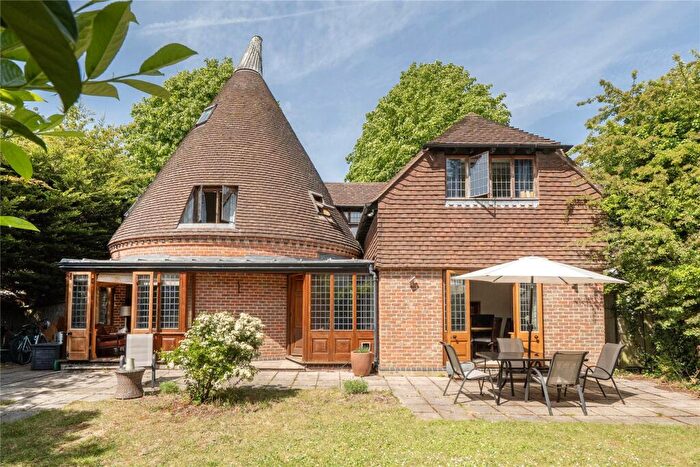
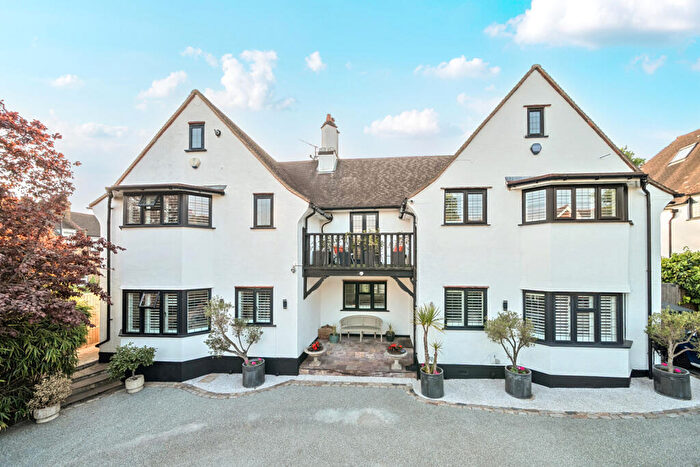
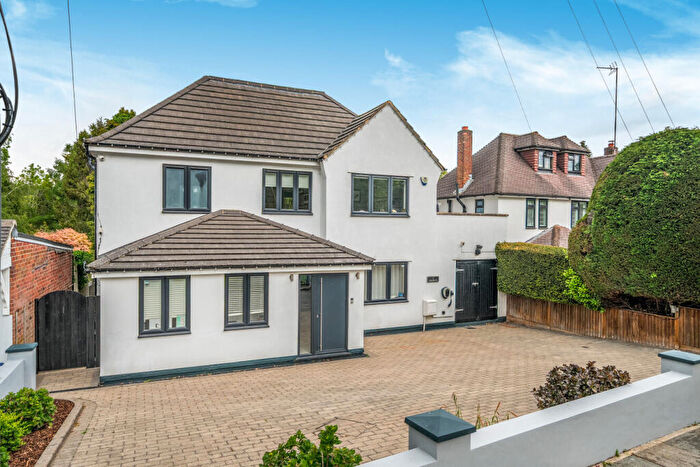
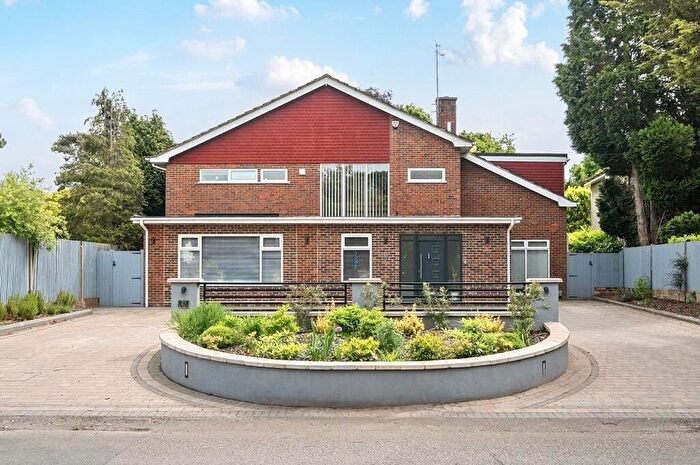
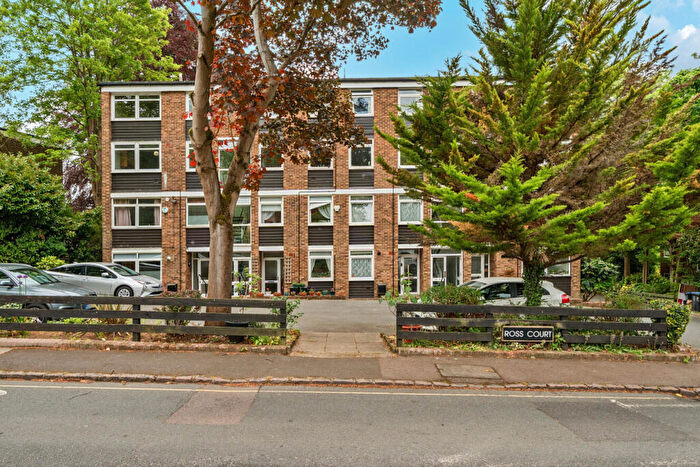
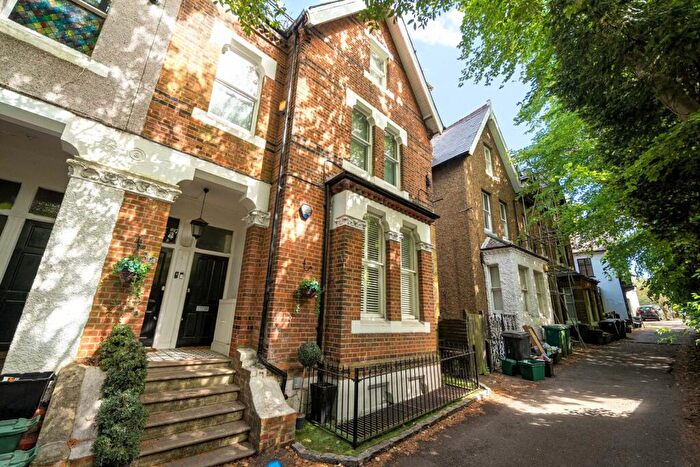
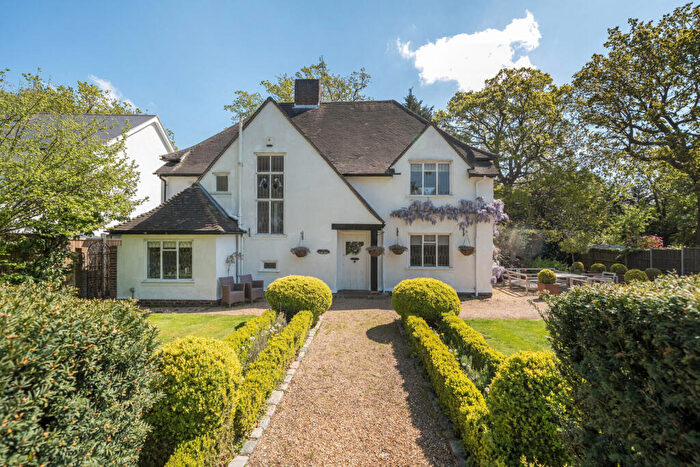
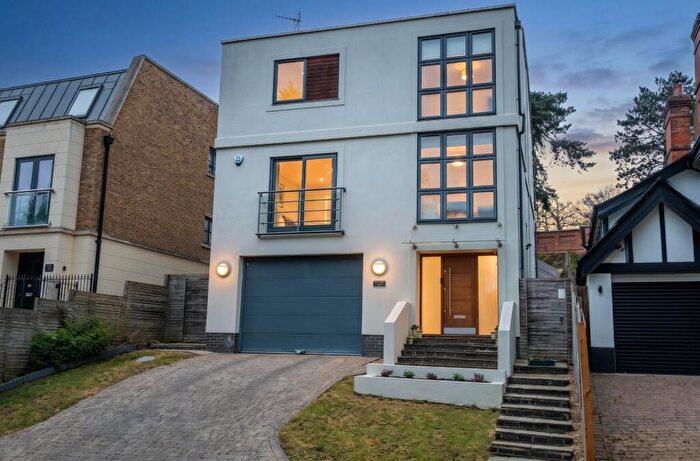
Properties for sale in Bickley
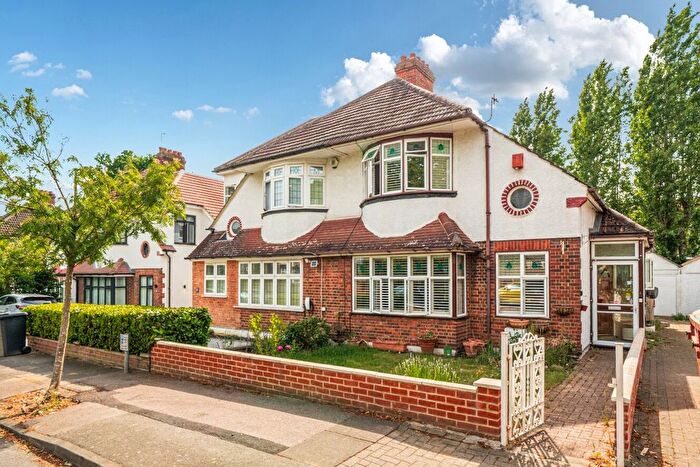
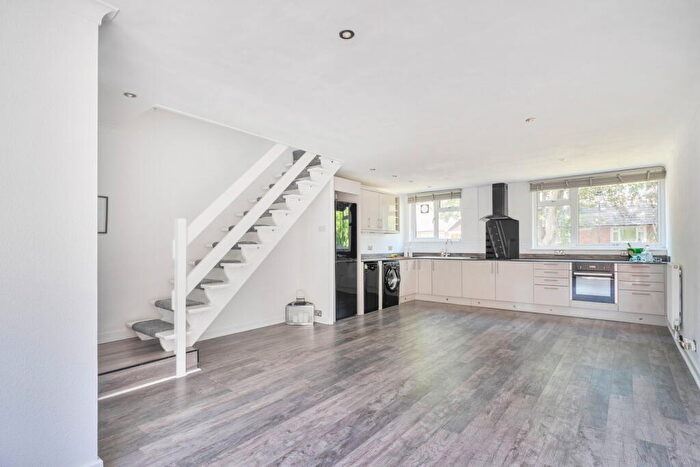
![]()
If you are looking to sell your house, let it out, or receive a property valuation, an expert can help you.
Click the button below to get started.
Roads and Postcodes in Bickley
Navigate through our locations to find the location of your next house in Bickley, Chislehurst for sale or to rent.
| Streets | Postcodes |
|---|---|
| Bonar Place | BR7 5RJ |
| Bruton Close | BR7 5SF |
| Bullers Wood Drive | BR7 5LS |
| Chislehurst Road | BR7 5LD BR7 5LE |
| Elmstead Lane | BR7 5RL |
| Highgrove Close | BR7 5SA |
| Hunts Mead Close | BR7 5SE |
| Logs Hill | BR7 5LN BR7 5LW |
| Logs Hill Close | BR7 5LH BR7 5LP |
| Merlewood Drive | BR7 5LQ |
| Merrydown Way | BR7 5RS |
| Oakhurst Close | BR7 5LF |
| Priory Close | BR7 5LB |
| Squires Wood Drive | BR7 5RT |
| St Nicolas Lane | BR7 5LL BR7 5LJ |
| Sundridge Avenue | BR7 5LU |
| Tudor Close | BR7 5LG |
| Woodknoll Drive | BR7 5QT |
| Yester Drive | BR7 5LR |
| Yester Road | BR7 5LT |
Transport near Bickley
-
 Elmstead Woods Station
 -
Chislehurst Station
-
Bickley Station
-
Sundridge Park Station
-
Bromley North Station
-
Bromley South Station
-
Grove Park Station
-
Petts Wood Station
-
Shortlands Station
-
Mottingham Station
- FAQ
- Price Paid By Year
- Property Type Price
Frequently asked questions about Bickley
What is the average price for a property for sale in Bickley?
The average price for a property for sale in Bickley is £1,286,029. This amount is 71% higher than the average price in Chislehurst. There are 903 property listings for sale in Bickley.
What streets have the most expensive properties for sale in Bickley?
The streets with the most expensive properties for sale in Bickley are Chislehurst Road at an average of £1,537,500, Bruton Close at an average of £1,360,000 and St Nicolas Lane at an average of £1,280,000.
What streets have the most affordable properties for sale in Bickley?
The streets with the most affordable properties for sale in Bickley are Yester Road at an average of £760,000, Highgrove Close at an average of £925,000 and Logs Hill at an average of £1,126,530.
Which train stations are available in or near Bickley?
Some of the train stations available in or near Bickley are Elmstead Woods, Chislehurst and Bickley.
Property Price Paid in Bickley by Year
The average sold property price by year was:
| Year | Average Sold Price | Price Change |
Sold Properties
|
|---|---|---|---|
| 2026 | £675,000 | -81% |
1 Property |
| 2025 | £1,225,000 | -6% |
4 Properties |
| 2024 | £1,298,333 | -5% |
6 Properties |
| 2023 | £1,357,059 | 4% |
11 Properties |
| 2022 | £1,305,083 | 26% |
12 Properties |
| 2021 | £959,806 | -12% |
31 Properties |
| 2020 | £1,079,100 | -13% |
10 Properties |
| 2019 | £1,216,107 | 11% |
14 Properties |
| 2018 | £1,081,500 | 26% |
10 Properties |
| 2017 | £802,071 | -25% |
14 Properties |
| 2016 | £1,001,730 | -1% |
13 Properties |
| 2015 | £1,011,875 | 6% |
8 Properties |
| 2014 | £952,916 | 19% |
12 Properties |
| 2013 | £774,842 | -39% |
19 Properties |
| 2012 | £1,077,937 | 45% |
8 Properties |
| 2011 | £596,800 | -3% |
5 Properties |
| 2010 | £612,500 | 4% |
4 Properties |
| 2009 | £588,830 | -129% |
10 Properties |
| 2008 | £1,350,000 | 55% |
1 Property |
| 2007 | £603,342 | 11% |
21 Properties |
| 2006 | £537,392 | -21% |
14 Properties |
| 2005 | £649,961 | -28% |
13 Properties |
| 2004 | £834,000 | 31% |
8 Properties |
| 2003 | £574,173 | 16% |
16 Properties |
| 2002 | £484,250 | 9% |
10 Properties |
| 2001 | £440,604 | -6% |
14 Properties |
| 2000 | £467,139 | 7% |
14 Properties |
| 1999 | £434,366 | 27% |
15 Properties |
| 1998 | £316,500 | 5% |
9 Properties |
| 1997 | £301,781 | 23% |
16 Properties |
| 1996 | £232,315 | 42% |
19 Properties |
| 1995 | £135,875 | - |
4 Properties |
Property Price per Property Type in Bickley
Here you can find historic sold price data in order to help with your property search.
The average Property Paid Price for specific property types in the last three years are:
| Property Type | Average Sold Price | Sold Properties |
|---|---|---|
| Flat | £727,500.00 | 4 Flats |
| Detached House | £1,410,147.00 | 18 Detached Houses |