Houses for sale & to rent in Mottingham And Chislehurst North, Chislehurst
House Prices in Mottingham And Chislehurst North
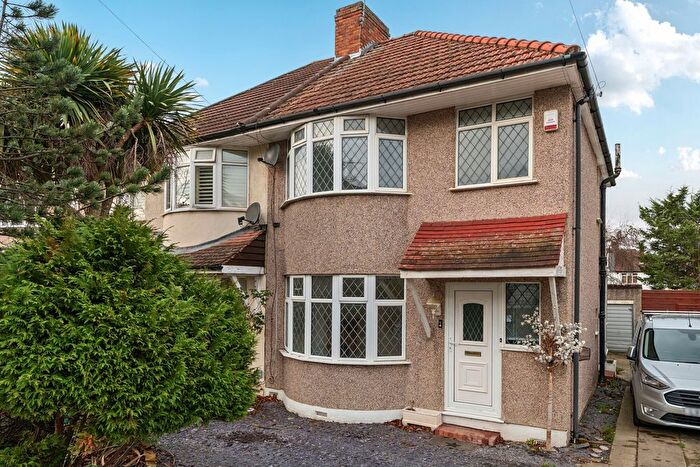
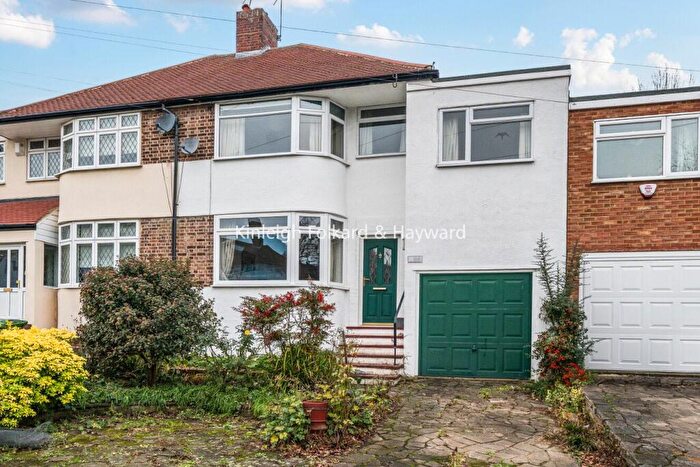
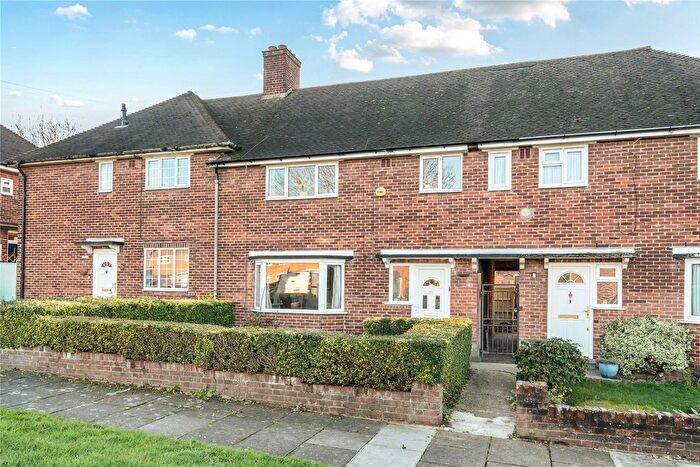
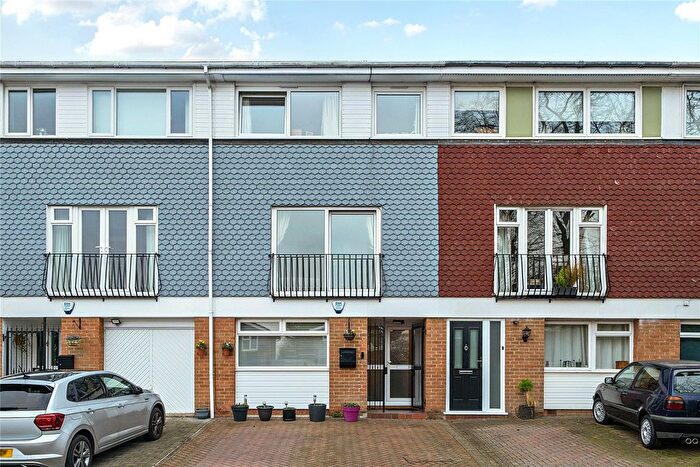
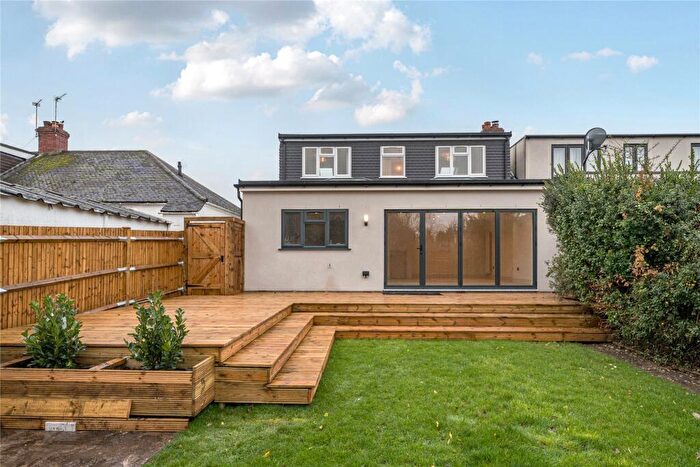
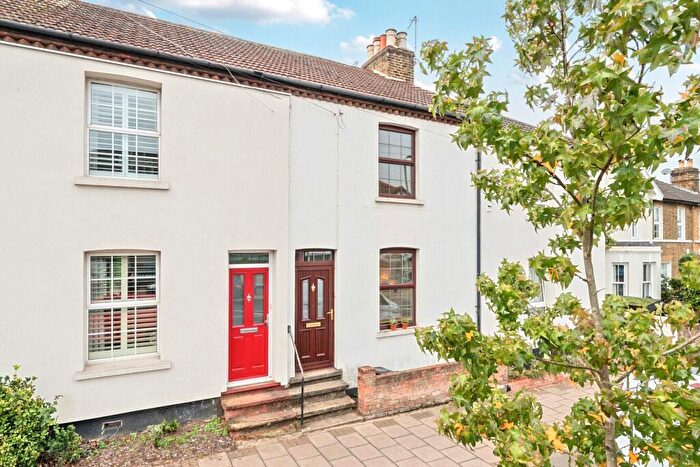
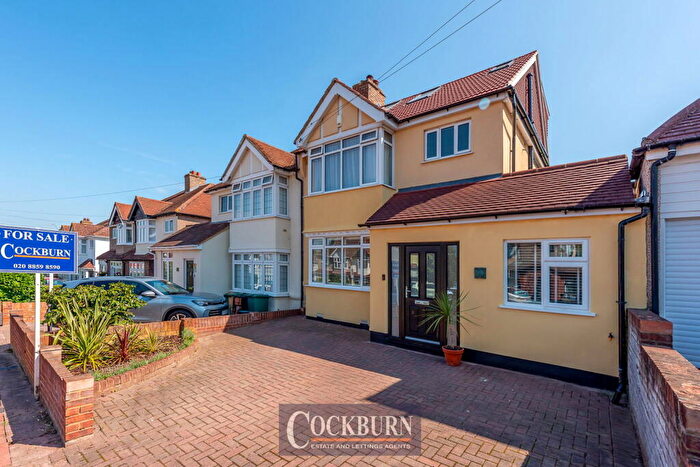
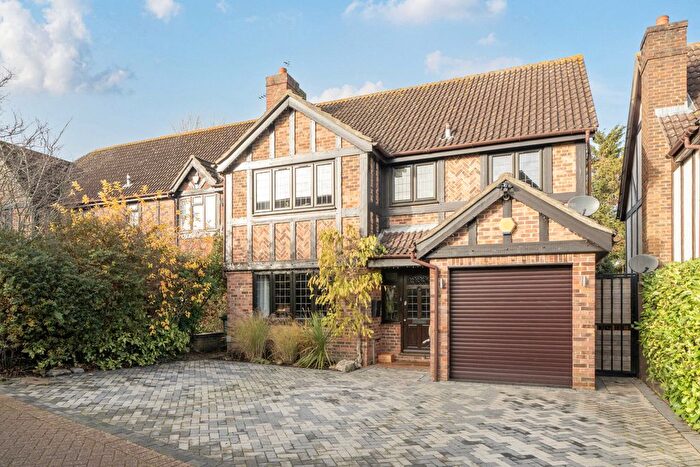
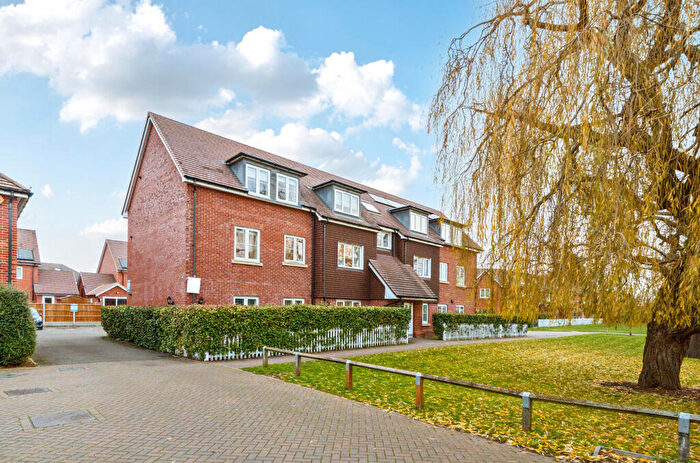
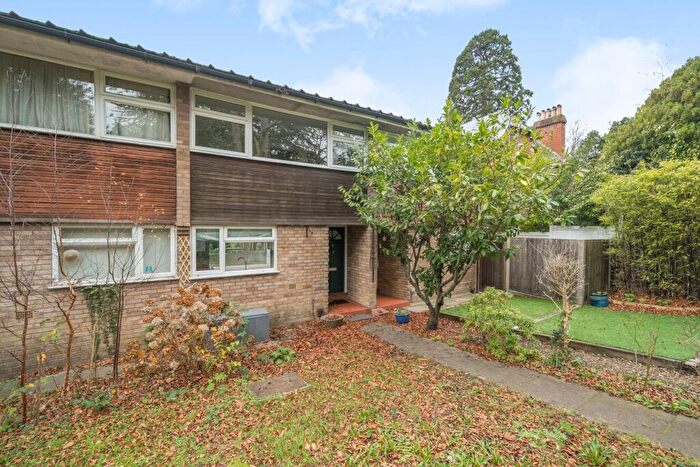
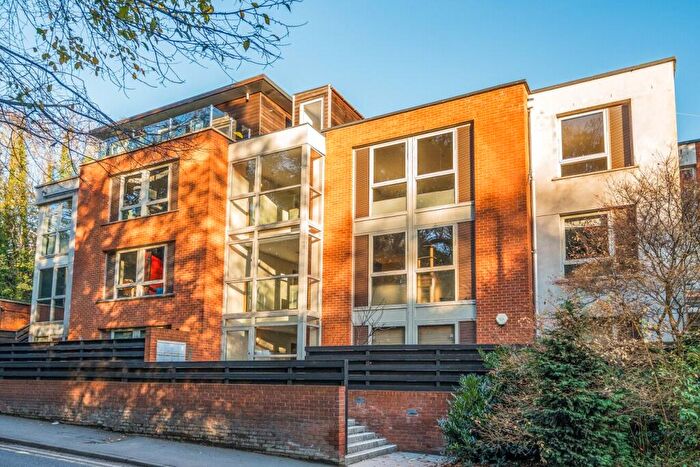
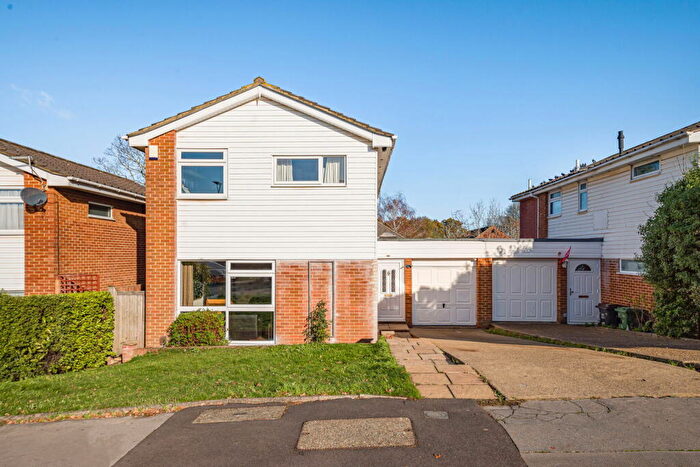
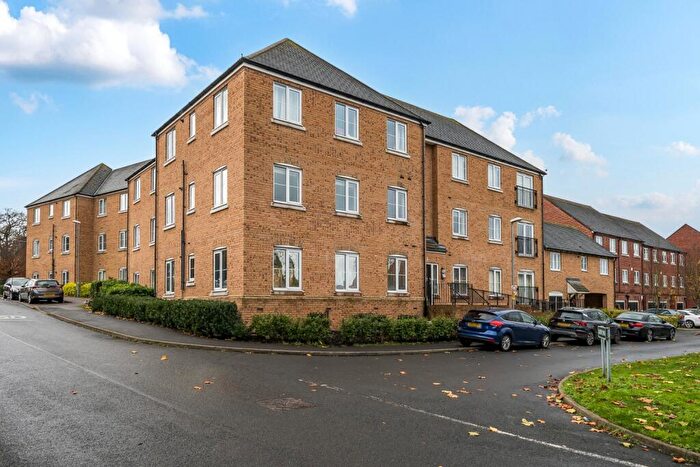
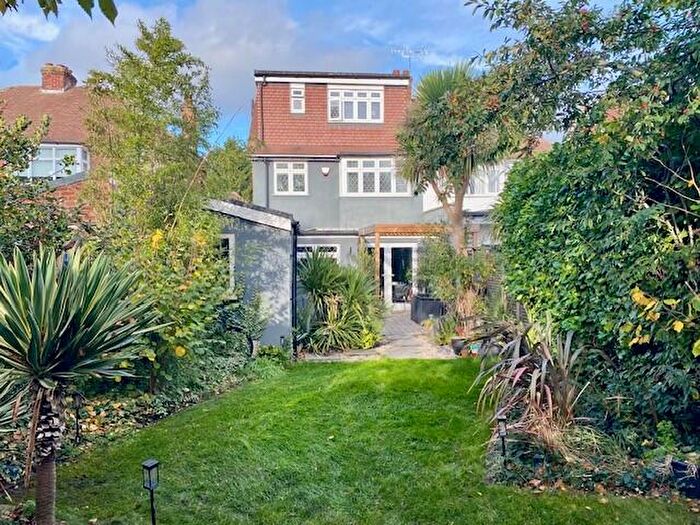
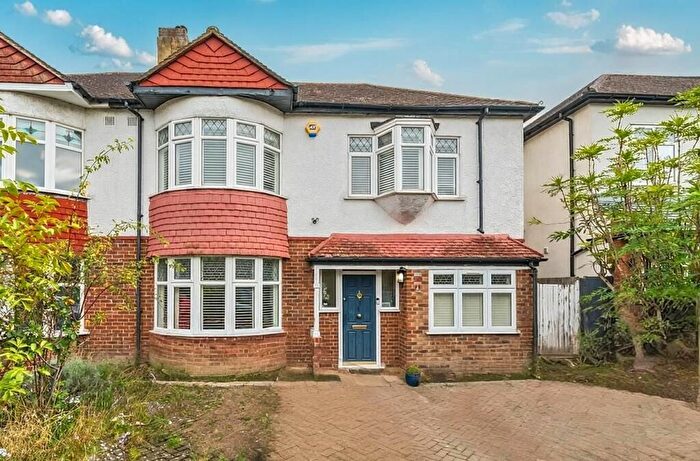
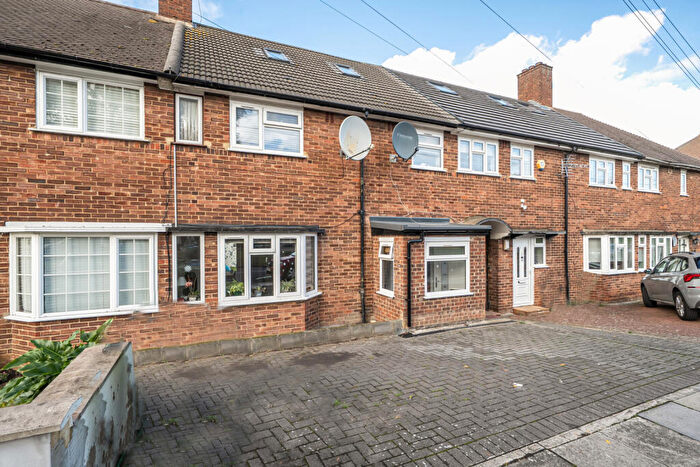
Properties in this part of Mottingham And Chislehurst North within Chislehurst have an average house price of £572,219.00 and had 79 Property Transactions within the last 3 years¹. This area has 630 households² , where the most expensive property was sold for £850,000.00.
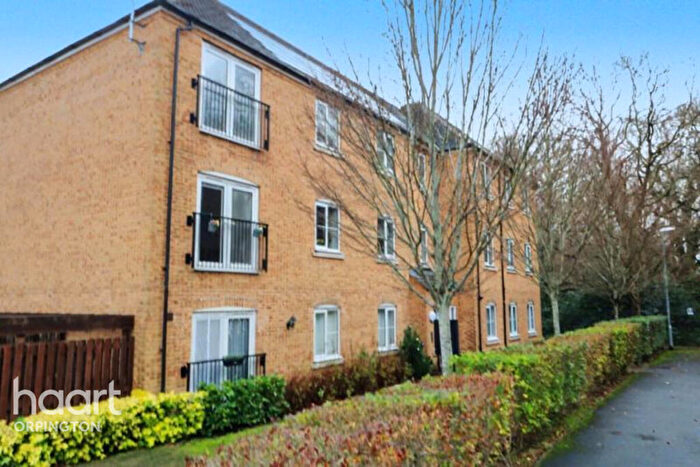
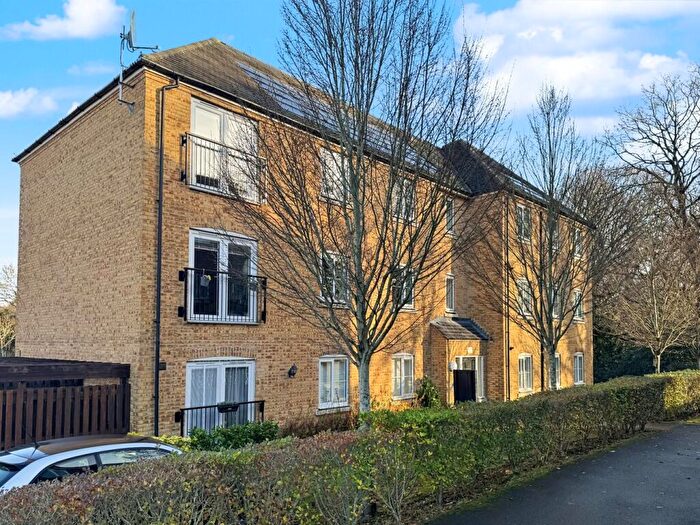
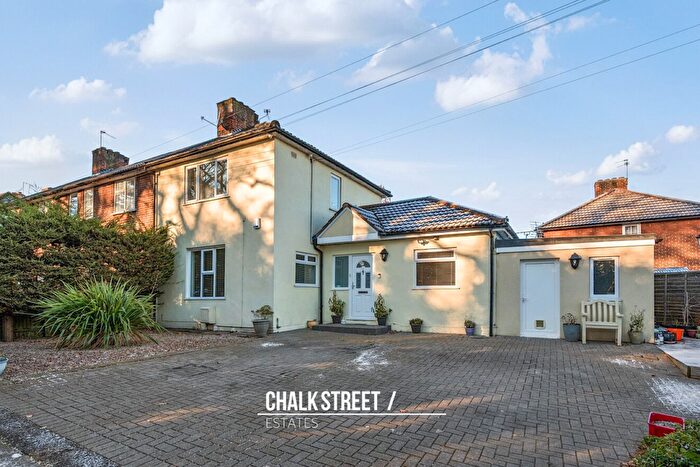
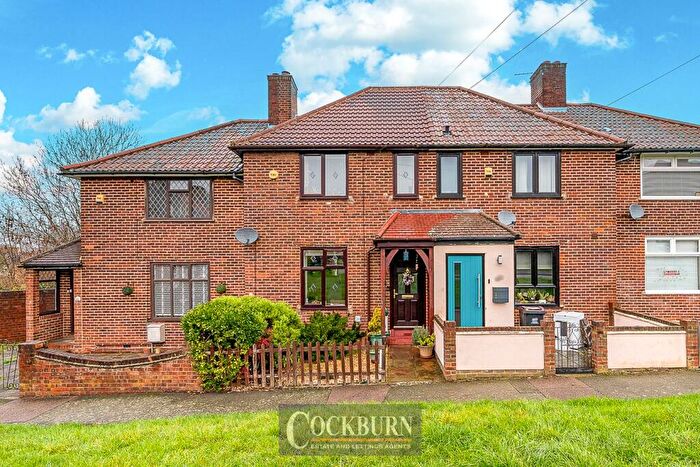
Properties for sale in Mottingham And Chislehurst North
Roads and Postcodes in Mottingham And Chislehurst North
Navigate through our locations to find the location of your next house in Mottingham And Chislehurst North, Chislehurst for sale or to rent.
| Streets | Postcodes |
|---|---|
| Broadheath Drive | BR7 6EH BR7 6EU |
| Cranmore Road | BR7 6EP BR7 6ER BR7 6ES BR7 6ET |
| Croft Close | BR7 6EX BR7 6EY BR7 6EZ |
| Elmstead Avenue | BR7 6EE BR7 6EF BR7 6EG BR7 6EQ |
| Elmstead Lane | BR7 5EN BR7 5EW |
| Fenton Close | BR7 6ED |
| Jay Gardens | BR7 6TU |
| Louis Gardens | BR7 6AL |
| Oakdene Avenue | BR7 6DY BR7 6DZ BR7 6EA BR7 6EB |
| Old Manor Way | BR7 5XS |
| Walden Avenue | BR7 6EJ BR7 6EL BR7 6EN BR7 6EW |
| White Horse Hill | BR7 6DH |
Transport near Mottingham And Chislehurst North
-
Elmstead Woods Station
-
Mottingham Station
-
New Eltham Station
-
Chislehurst Station
-
Grove Park Station
-
Sundridge Park Station
-
Bickley Station
-
Bromley North Station
-
Eltham Station
-
Sidcup Station
- FAQ
- Price Paid By Year
- Property Type Price
Frequently asked questions about Mottingham And Chislehurst North
What is the average price for a property for sale in Mottingham And Chislehurst North?
The average price for a property for sale in Mottingham And Chislehurst North is £572,219. This amount is 24% lower than the average price in Chislehurst. There are 1,469 property listings for sale in Mottingham And Chislehurst North.
What streets have the most expensive properties for sale in Mottingham And Chislehurst North?
The streets with the most expensive properties for sale in Mottingham And Chislehurst North are Broadheath Drive at an average of £634,870, White Horse Hill at an average of £633,750 and Oakdene Avenue at an average of £629,500.
What streets have the most affordable properties for sale in Mottingham And Chislehurst North?
The streets with the most affordable properties for sale in Mottingham And Chislehurst North are Croft Close at an average of £292,500, Jay Gardens at an average of £415,000 and Elmstead Lane at an average of £418,708.
Which train stations are available in or near Mottingham And Chislehurst North?
Some of the train stations available in or near Mottingham And Chislehurst North are Elmstead Woods, Mottingham and New Eltham.
Property Price Paid in Mottingham And Chislehurst North by Year
The average sold property price by year was:
| Year | Average Sold Price | Price Change |
Sold Properties
|
|---|---|---|---|
| 2025 | £567,400 | 5% |
10 Properties |
| 2024 | £537,361 | -3% |
18 Properties |
| 2023 | £555,516 | -13% |
30 Properties |
| 2022 | £628,254 | 20% |
21 Properties |
| 2021 | £504,142 | 4% |
35 Properties |
| 2020 | £486,047 | 14% |
21 Properties |
| 2019 | £417,066 | -5% |
25 Properties |
| 2018 | £439,471 | -4% |
26 Properties |
| 2017 | £458,316 | 6% |
30 Properties |
| 2016 | £429,550 | 6% |
20 Properties |
| 2015 | £405,192 | 9% |
26 Properties |
| 2014 | £368,171 | 9% |
23 Properties |
| 2013 | £333,843 | 11% |
29 Properties |
| 2012 | £297,289 | 7% |
33 Properties |
| 2011 | £275,690 | -2% |
22 Properties |
| 2010 | £281,225 | 13% |
29 Properties |
| 2009 | £245,543 | -9% |
23 Properties |
| 2008 | £268,792 | -3% |
22 Properties |
| 2007 | £276,419 | 9% |
44 Properties |
| 2006 | £251,922 | - |
44 Properties |
| 2005 | £251,971 | 7% |
37 Properties |
| 2004 | £235,464 | 3% |
31 Properties |
| 2003 | £228,095 | 22% |
35 Properties |
| 2002 | £178,100 | 10% |
42 Properties |
| 2001 | £160,217 | 17% |
34 Properties |
| 2000 | £132,245 | -4% |
37 Properties |
| 1999 | £137,483 | 19% |
37 Properties |
| 1998 | £111,229 | 19% |
32 Properties |
| 1997 | £90,140 | -5% |
49 Properties |
| 1996 | £94,981 | 16% |
46 Properties |
| 1995 | £79,502 | - |
25 Properties |
Property Price per Property Type in Mottingham And Chislehurst North
Here you can find historic sold price data in order to help with your property search.
The average Property Paid Price for specific property types in the last three years are:
| Property Type | Average Sold Price | Sold Properties |
|---|---|---|
| Semi Detached House | £593,415.00 | 47 Semi Detached Houses |
| Terraced House | £544,752.00 | 19 Terraced Houses |
| Flat | £307,000.00 | 6 Flats |
| Detached House | £731,785.00 | 7 Detached Houses |

