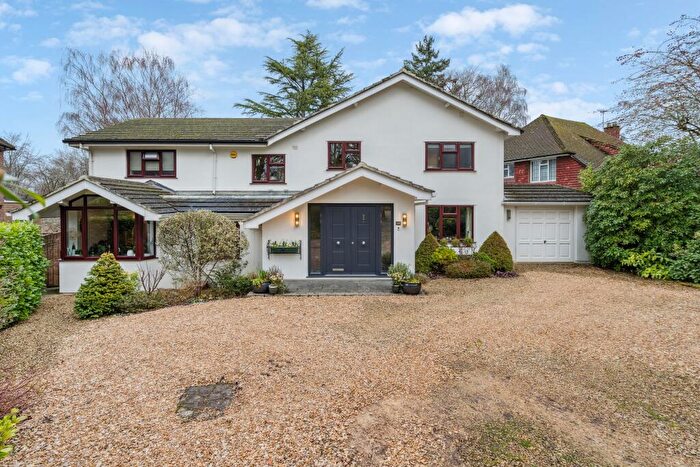
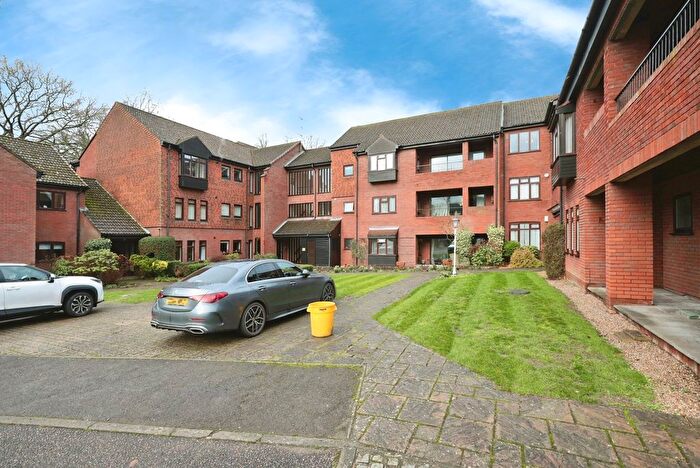
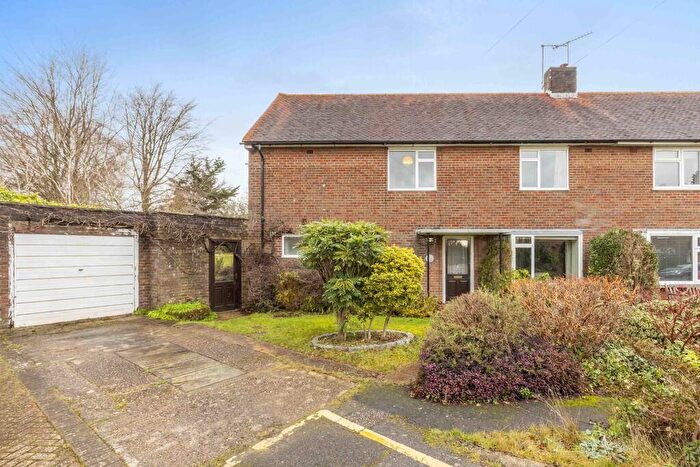
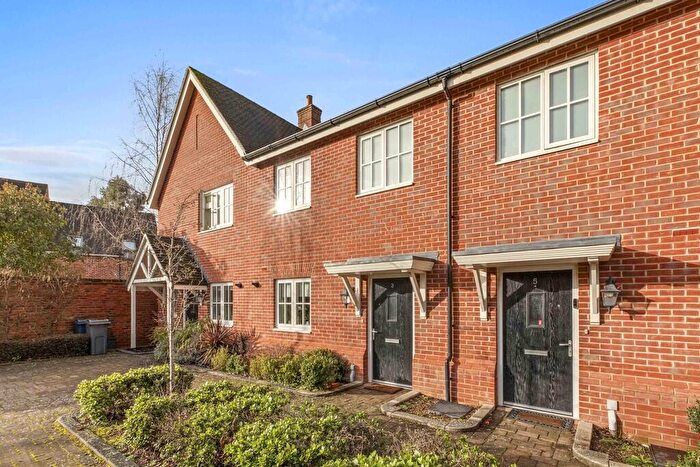
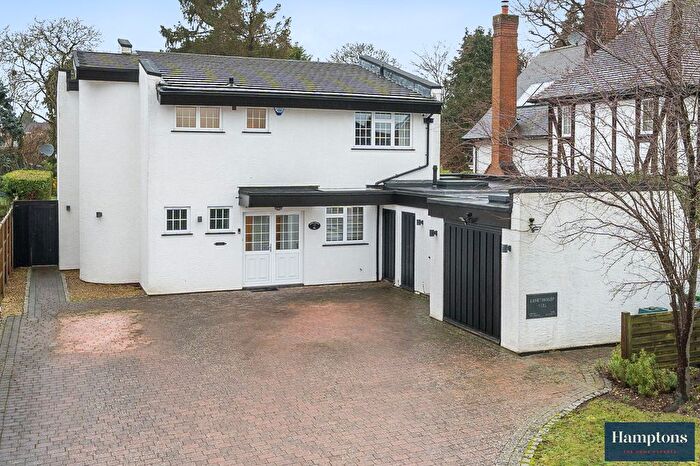
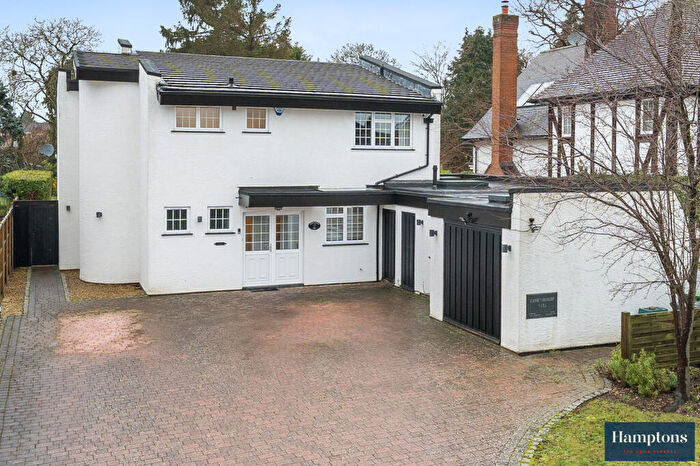
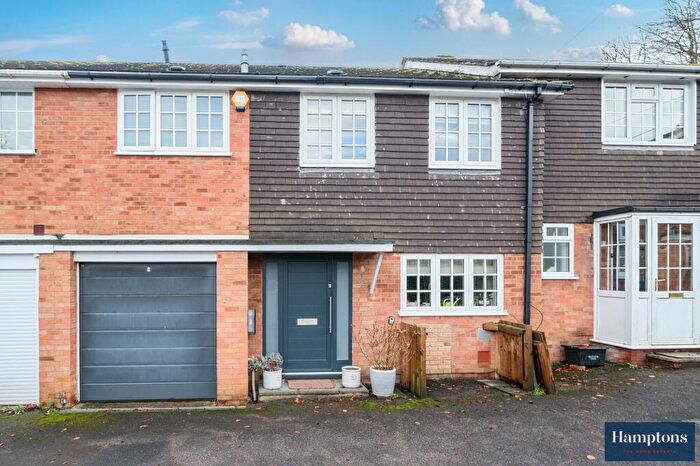
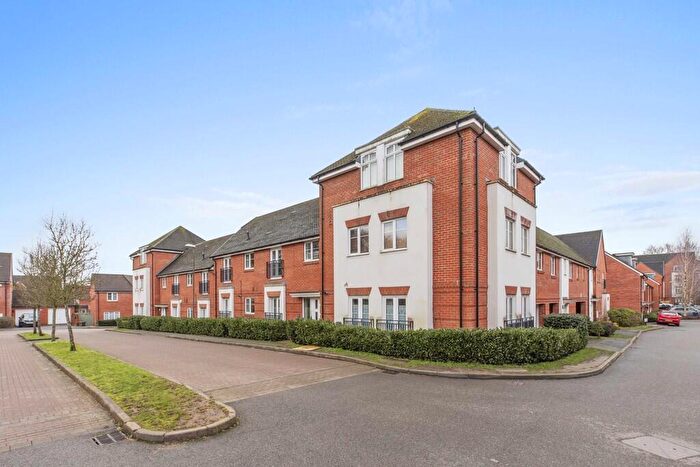
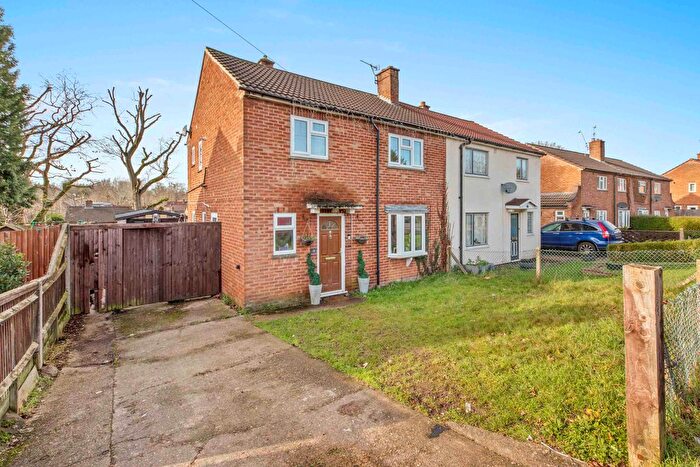
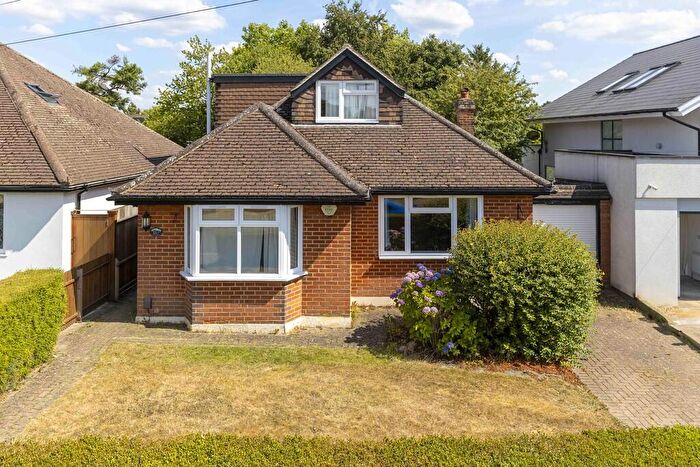
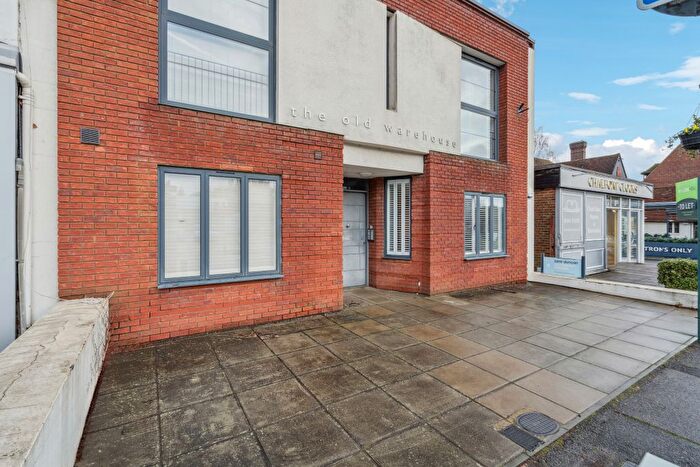
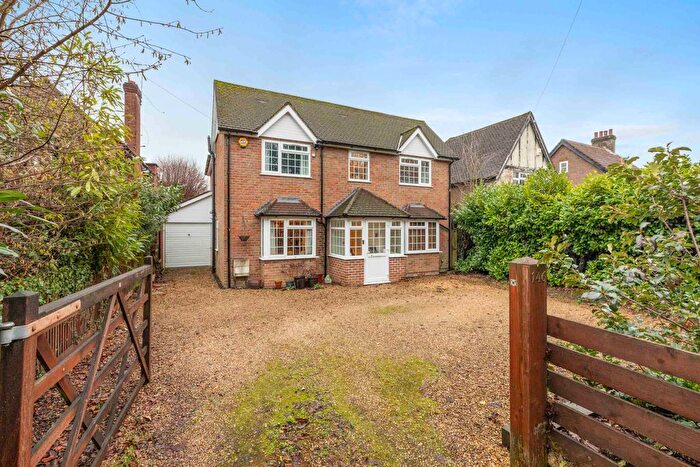
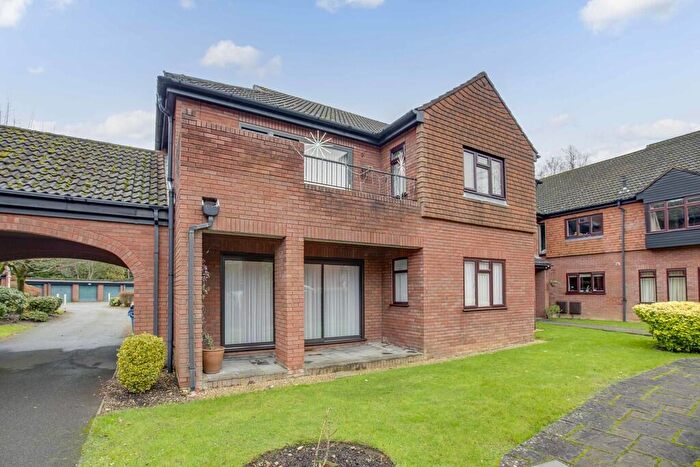
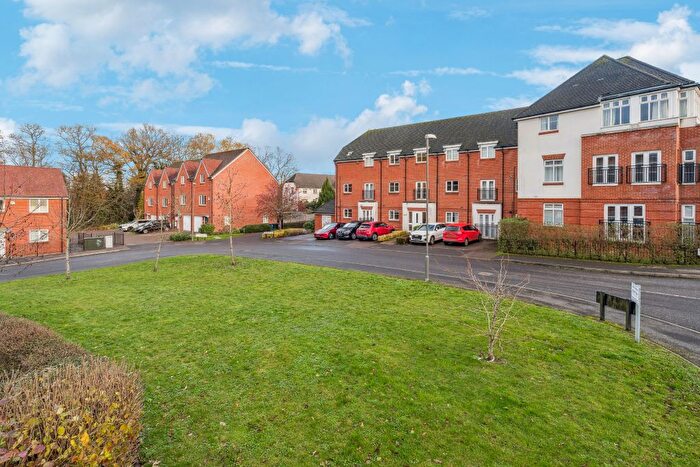
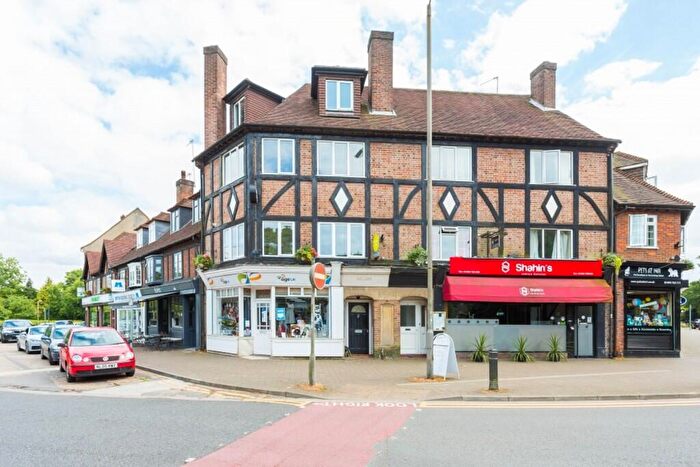
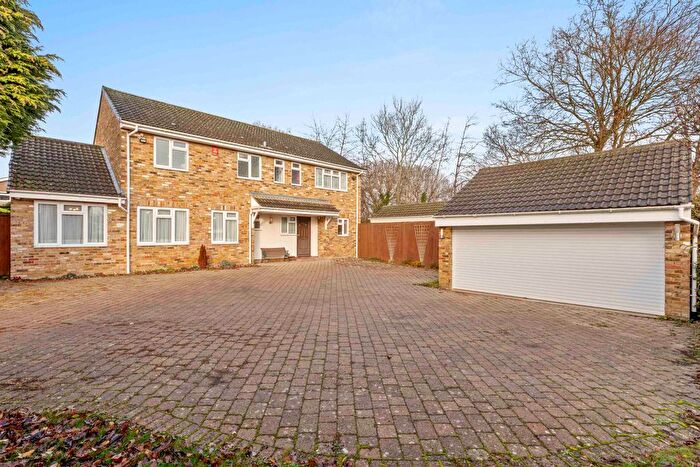
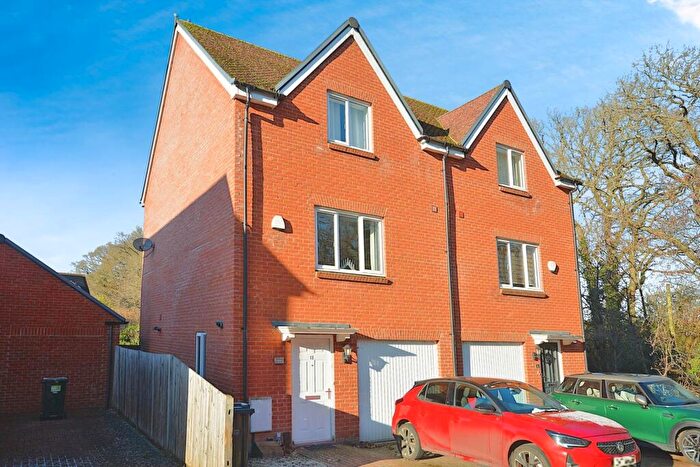
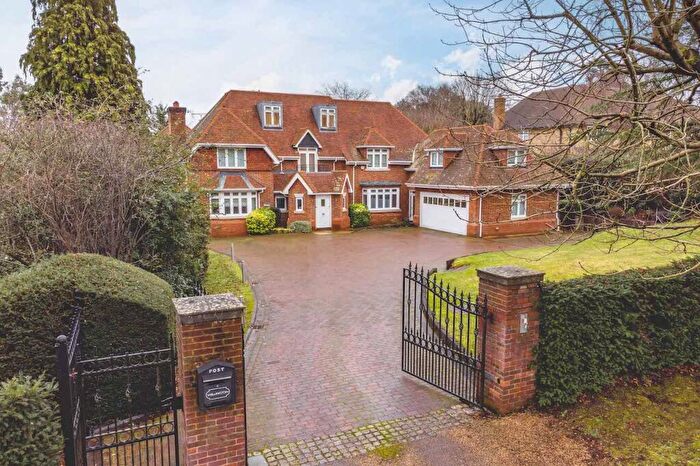
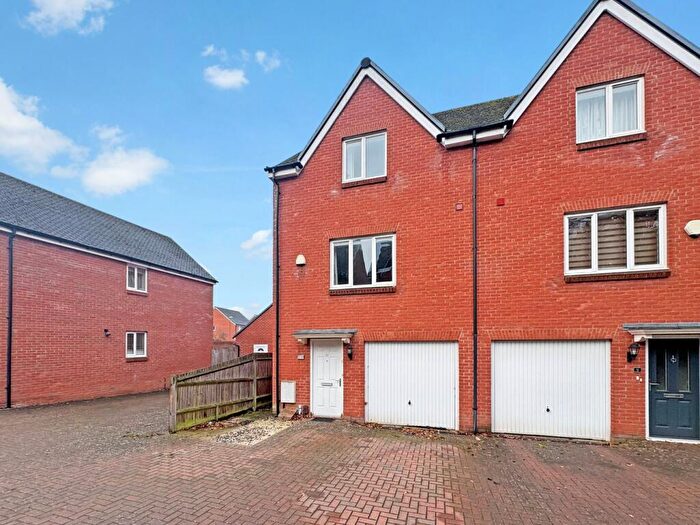
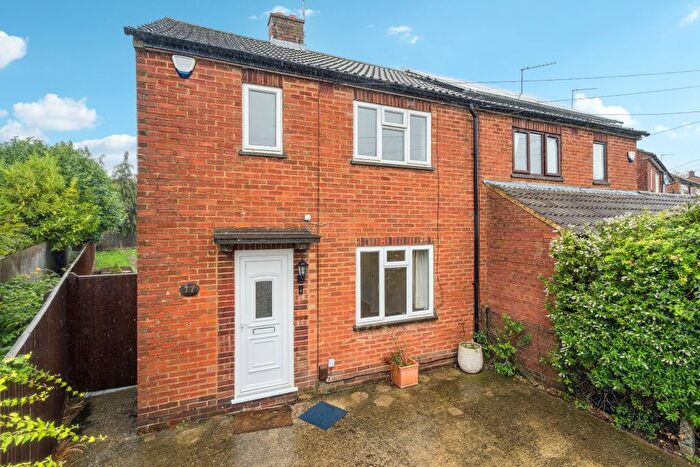
Houses for sale & to rent in Little Chalfont, Amersham
House Prices in Little Chalfont
Properties in Little Chalfont have an average house price of £707,307.00 and had 174 Property Transactions within the last 3 years¹.
Little Chalfont is an area in Amersham, Buckinghamshire with 1,683 households², where the most expensive property was sold for £1,800,000.00.
Properties for sale in Little Chalfont
Roads and Postcodes in Little Chalfont
Navigate through our locations to find the location of your next house in Little Chalfont, Amersham for sale or to rent.
| Streets | Postcodes |
|---|---|
| Amersham Road | HP6 6SE HP6 6SL HP6 6SN HP6 6SP HP6 6SW |
| Amersham Way | HP6 6SF HP6 6SG |
| Appleton Close | HP7 9QQ |
| Arbour View | HP7 9PD |
| Ashmead Place | HP7 9NZ |
| Bedford Avenue | HP6 6PS HP6 6PT HP6 6PX |
| Beech Park | HP6 6PY |
| Beechwood Avenue | HP6 6PH HP6 6PL HP6 6PN |
| Beechwood Close | HP6 6QU HP6 6QX |
| Beel Close | HP7 9NS |
| Bell Lane | HP6 6PD HP6 6PF HP6 6PG HP7 9PE HP7 9PF |
| Boughton Way | HP6 6PU |
| Cavendish Close | HP6 6QD HP6 6QE |
| Chalfont Avenue | HP6 6RD HP6 6RF |
| Chalfont Station Road | HP7 9PN |
| Chalk Stream Rise | HP6 6FS |
| Chandos Close | HP6 6PJ |
| Charsley Close | HP6 6QH HP6 6QQ |
| Chenies Avenue | HP6 6PP HP6 6PR HP6 6PW |
| Chenies Parade | HP7 9PH |
| Cherryfields | HP6 6FL |
| Chessfield Park | HP6 6RU HP6 6RX |
| Chilcote Lane | HP7 9LR |
| Chiltern Heights | HP7 9RX |
| Church Grove | HP6 6SH HP6 6SJ |
| Clayton Walk | HP7 9NT |
| Cokes Lane | HP7 9QD |
| Cumberland Close | HP7 9NH HP7 9NJ |
| Derwent Close | HP7 9PG |
| Elizabeth Avenue | HP6 6QB HP6 6QG HP6 6QJ HP6 6QT HP6 6RG HP6 6RQ HP6 6RS |
| Farm Close | HP6 6RH |
| Finch Lane | HP7 9LU HP7 9NB HP7 9NE |
| Kenway Drive | HP7 9NN |
| Kiln Avenue | HP6 6QW |
| Latimer Close | HP6 6QS |
| Linfields | HP7 9QH |
| Linnet Avenue | HP6 6FR |
| Loudhams Road | HP7 9NX HP7 9NY |
| Marygold Walk | HP6 6QF |
| Meadow View | HP6 6FQ |
| Nightingales Corner | HP7 9PY HP7 9PZ |
| Oakington Avenue | HP6 6SR HP6 6ST HP6 6SX HP6 6SY |
| Old Saw Mill Place | HP6 6FF HP6 6FJ |
| Oldfield Close | HP6 6SU |
| Pavilion Way | HP6 6PZ HP6 6QA |
| Russell Close | HP6 6RE |
| Sandycroft Road | HP6 6QL HP6 6QN HP6 6QP HP6 6QR |
| Snells Lane | HP7 9QJ HP7 9QN HP7 9QW |
| Snells Wood Court | HP7 9QT |
| St Nicholas Close | HP7 9NP HP7 9NW |
| The Bramblings | HP6 6FN HP6 6FP |
| The Larches | HP6 6YH |
| The Retreat | HP6 6SS |
| Village Way | HP7 9PU HP7 9PX |
| Westwood Close | HP6 6RP |
| Westwood Drive | HP6 6RJ HP6 6RL HP6 6RN HP6 6RR HP6 6RW |
| White Lion Road | HP7 9LJ HP7 9LW HP7 9NL HP7 9NQ HP7 9NU |
| Yarrowside | HP7 9QL |
Transport near Little Chalfont
- FAQ
- Price Paid By Year
- Property Type Price
Frequently asked questions about Little Chalfont
What is the average price for a property for sale in Little Chalfont?
The average price for a property for sale in Little Chalfont is £707,307. This amount is 6% lower than the average price in Amersham. There are 223 property listings for sale in Little Chalfont.
What streets have the most expensive properties for sale in Little Chalfont?
The streets with the most expensive properties for sale in Little Chalfont are Beechwood Avenue at an average of £1,524,916, Chenies Avenue at an average of £1,262,625 and Church Grove at an average of £1,105,500.
What streets have the most affordable properties for sale in Little Chalfont?
The streets with the most affordable properties for sale in Little Chalfont are Derwent Close at an average of £254,333, Pavilion Way at an average of £262,333 and Chenies Parade at an average of £268,000.
Which train stations are available in or near Little Chalfont?
Some of the train stations available in or near Little Chalfont are Chalfont and Latimer, Amersham and Chorleywood.
Which tube stations are available in or near Little Chalfont?
Some of the tube stations available in or near Little Chalfont are Chalfont and Latimer, Amersham and Chorleywood.
Property Price Paid in Little Chalfont by Year
The average sold property price by year was:
| Year | Average Sold Price | Price Change |
Sold Properties
|
|---|---|---|---|
| 2025 | £680,302 | -8% |
55 Properties |
| 2024 | £733,494 | 4% |
69 Properties |
| 2023 | £700,876 | -18% |
50 Properties |
| 2022 | £826,432 | 22% |
64 Properties |
| 2021 | £643,870 | -3% |
121 Properties |
| 2020 | £661,381 | 12% |
66 Properties |
| 2019 | £581,374 | -10% |
70 Properties |
| 2018 | £637,505 | 7% |
72 Properties |
| 2017 | £589,721 | 13% |
89 Properties |
| 2016 | £515,461 | 2% |
91 Properties |
| 2015 | £503,679 | 7% |
68 Properties |
| 2014 | £466,523 | 20% |
66 Properties |
| 2013 | £373,894 | 1% |
113 Properties |
| 2012 | £371,145 | -20% |
132 Properties |
| 2011 | £445,681 | 12% |
58 Properties |
| 2010 | £393,278 | -1% |
53 Properties |
| 2009 | £397,541 | -4% |
44 Properties |
| 2008 | £414,565 | -0,3% |
44 Properties |
| 2007 | £415,602 | 12% |
81 Properties |
| 2006 | £367,620 | 4% |
103 Properties |
| 2005 | £351,166 | 2% |
94 Properties |
| 2004 | £342,836 | 22% |
78 Properties |
| 2003 | £268,942 | -13% |
55 Properties |
| 2002 | £304,739 | 21% |
81 Properties |
| 2001 | £240,090 | -3% |
90 Properties |
| 2000 | £247,314 | 18% |
79 Properties |
| 1999 | £202,507 | 23% |
89 Properties |
| 1998 | £156,291 | 14% |
80 Properties |
| 1997 | £135,162 | 9% |
86 Properties |
| 1996 | £122,790 | -6% |
69 Properties |
| 1995 | £129,730 | - |
55 Properties |
Property Price per Property Type in Little Chalfont
Here you can find historic sold price data in order to help with your property search.
The average Property Paid Price for specific property types in the last three years are:
| Property Type | Average Sold Price | Sold Properties |
|---|---|---|
| Semi Detached House | £709,009.00 | 48 Semi Detached Houses |
| Detached House | £989,636.00 | 61 Detached Houses |
| Terraced House | £570,982.00 | 26 Terraced Houses |
| Flat | £354,505.00 | 39 Flats |

