
Houses for sale in Buckinghamshire, England
House Prices in Buckinghamshire
Properties in Buckinghamshire have
an average house price of
£562k
and had 22,201 Property Transactions
within the last 3 years.¹
Buckinghamshire is a location in
England with
221,451 households², where the most expensive property was sold for £100M.
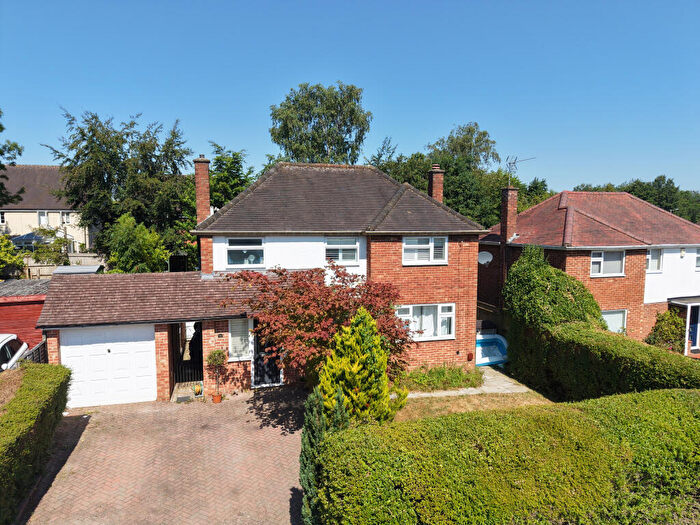
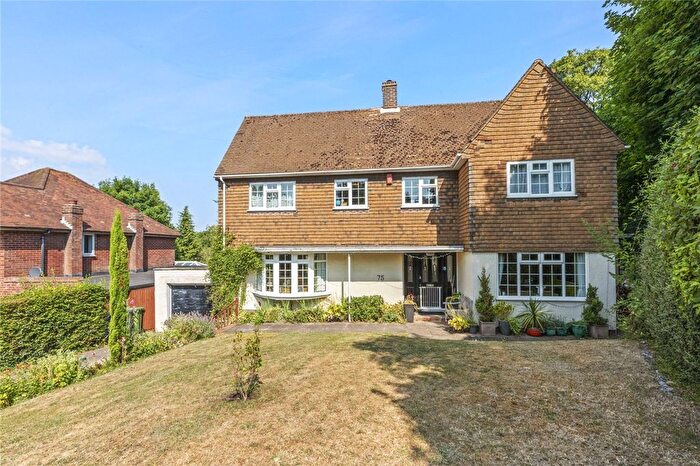
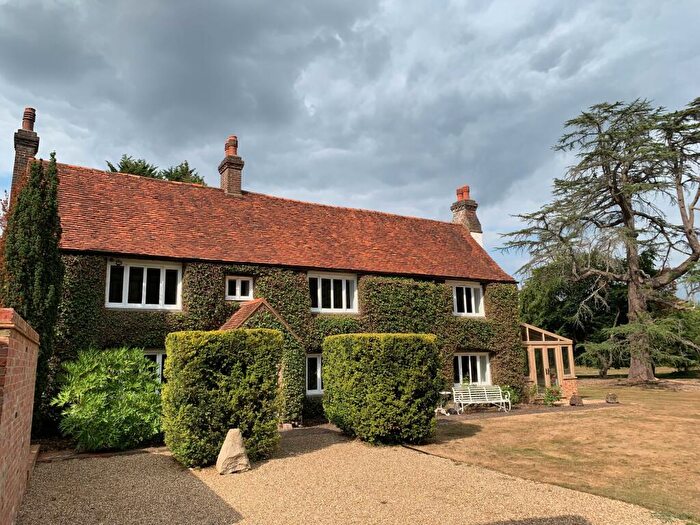
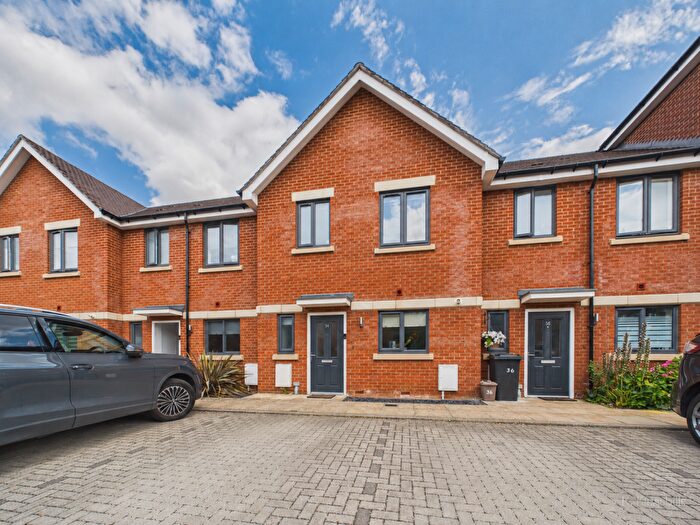
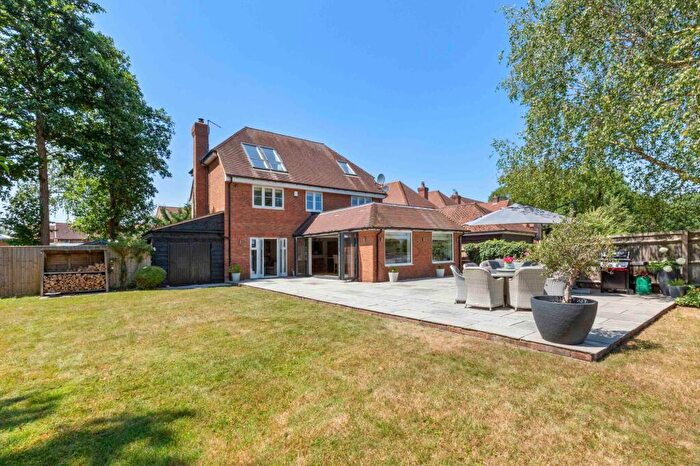
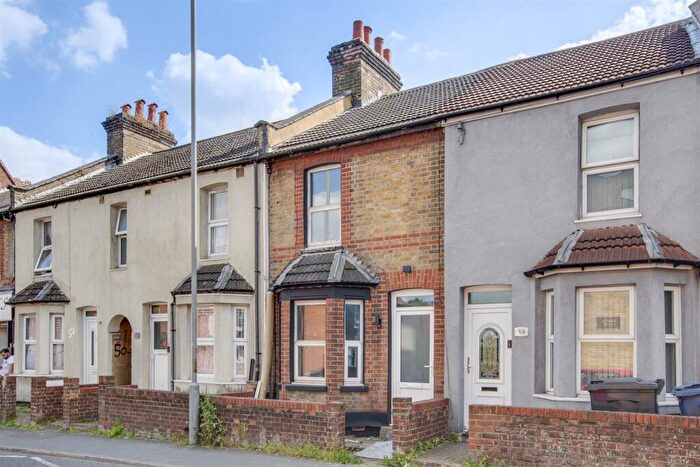
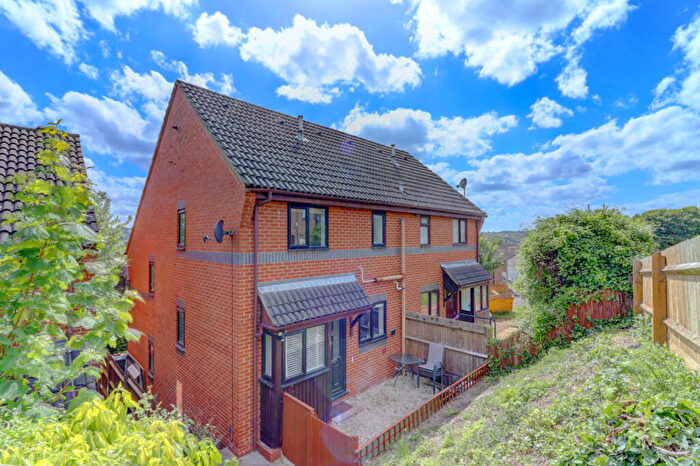
Properties for sale in Buckinghamshire
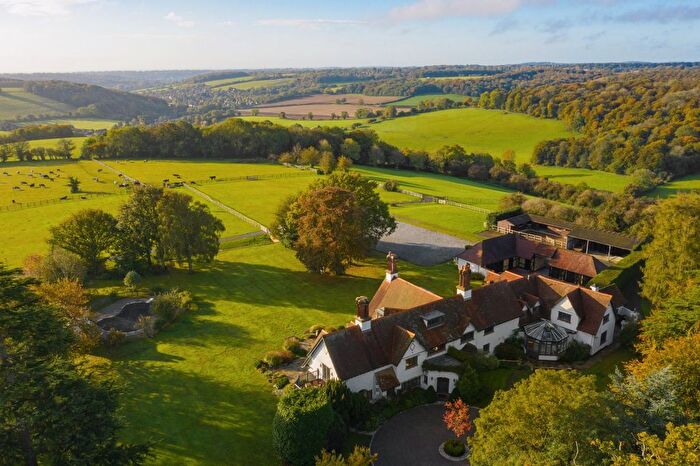
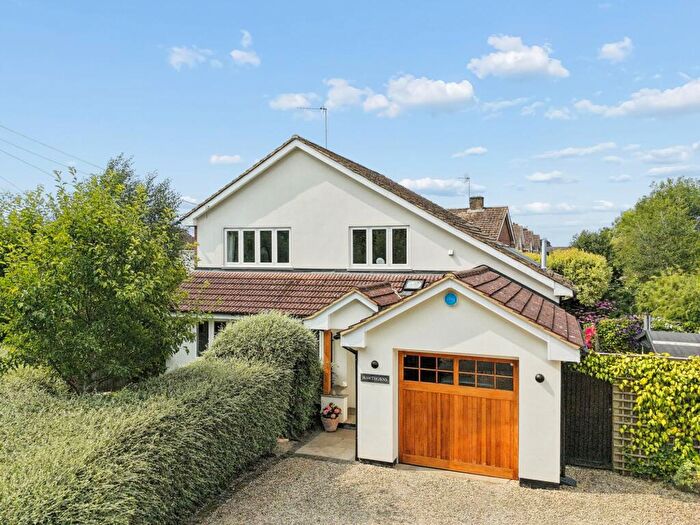
![]()
If you are looking to sell your house, let it out, or receive a property valuation, an expert can help you.
Click the button below to get started.


Towns in Buckinghamshire
Navigate through our locations to find the location of your next house in Buckinghamshire, England for sale or to rent.
- Chalfont St Giles
- Gerrards Cross
- Thame
- Slough
- High Wycombe
- Uxbridge
- Buckingham
- Tring
- Olney
- Towcester
- Dunstable
- Henley-on-thames
- Windsor
- Amersham
- Princes Risborough
- Iver
- Chinnor
- Aylesbury
- Leighton Buzzard
- Kidlington
- Beaconsfield
- Milton Keynes
- Chesham
- Marlow
- Newport Pagnell
- Maidenhead
- Berkhamsted
- Great Missenden
- Rickmansworth
- Brackley
- Bicester
- Bourne End
Property price trends in Buckinghamshire
According to the latest Land Registry data, the average home in Buckinghamshire sold for £507,063 in 2026. That figure comes from a substantial record of 292,848 sales logged over the past 31 years.
Prices have fallen back over the last three years. Compared with 2023, when the typical sale came in around £555,504, that's a fall of roughly 8.7%.
Looking back five years, average prices are down about 6.4% since 2021, a drop of around £34,945 in cash terms.
Zoom out to the past decade for the fuller picture. Back in 2016, homes here averaged £441,698, so the typical sold price has climbed about 14.8% since then, roughly 1.4% a year. Stretch the view to fifteen years and that annual pace edges up closer to 2.4%.
Frequently asked questions about Buckinghamshire
What is the average price for a property for sale in Buckinghamshire?
The average price for a property for sale in Buckinghamshire is £562,469. This amount is 57% higher than the average price in England. There are more than 10,000 property listings for sale in Buckinghamshire.
What locations have the most expensive properties for sale in Buckinghamshire?
The locations with the most expensive properties for sale in Buckinghamshire are Henley-on-thames at an average of £1,536,095, Beaconsfield at an average of £1,219,110 and Chinnor at an average of £1,150,000.
What locations have the most affordable properties for sale in Buckinghamshire?
The locations with the most affordable properties for sale in Buckinghamshire are Aylesbury at an average of £404,940, Buckingham at an average of £420,956 and Brackley at an average of £458,424.
Which train stations are available in or near Buckinghamshire?
Some of the train stations available in or near Buckinghamshire are Great Missenden, Wendover and Little Kimble.
Property Price Paid in Buckinghamshire by Year
The average sold property price by year was:
| Year | Average Sold Price | Price Change |
Sold Properties
|
|---|---|---|---|
| 2026 | £507,063 | -14% |
1,282 Properties |
| 2025 | £578,207 | 3% |
7,449 Properties |
| 2024 | £562,132 | 1% |
7,185 Properties |
| 2023 | £555,504 | -4% |
6,285 Properties |
| 2022 | £576,565 | 6% |
8,578 Properties |
| 2021 | £542,008 | 6% |
11,403 Properties |
| 2020 | £506,851 | 6% |
7,771 Properties |
| 2019 | £476,003 | - |
8,686 Properties |
| 2018 | £476,099 | -2% |
8,720 Properties |
| 2017 | £484,052 | 9% |
9,095 Properties |
Property Price per Property Type in Buckinghamshire
Here you can find historic sold price data in order to help with your property search.
The average Property Paid Price for specific property types in the last three years are:
| Property Type | Average Sold Price | Sold Properties |
|---|---|---|
| Semi Detached House | £491,547.00 | 6,372 Semi Detached Houses |
| Terraced House | £404,463.00 | 4,757 Terraced Houses |
| Detached House | £907,599.00 | 6,914 Detached Houses |
| Flat | £278,035.00 | 4,158 Flats |
Transport in Buckinghamshire
Please see below transportation links in this area:
