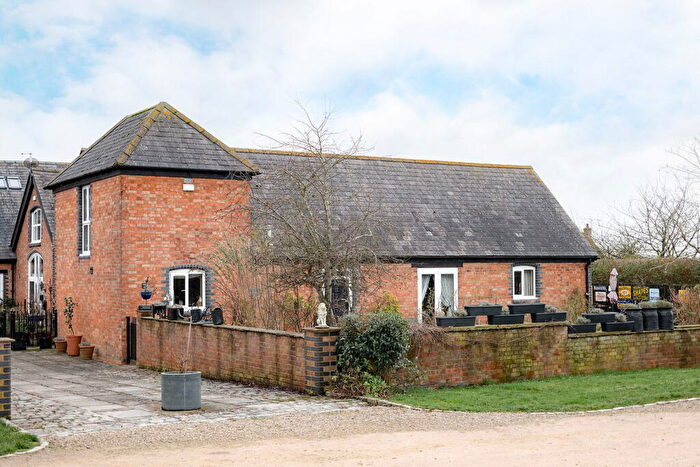
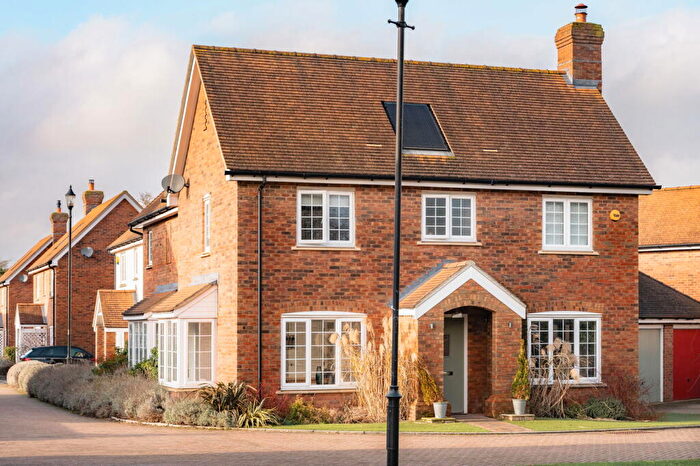
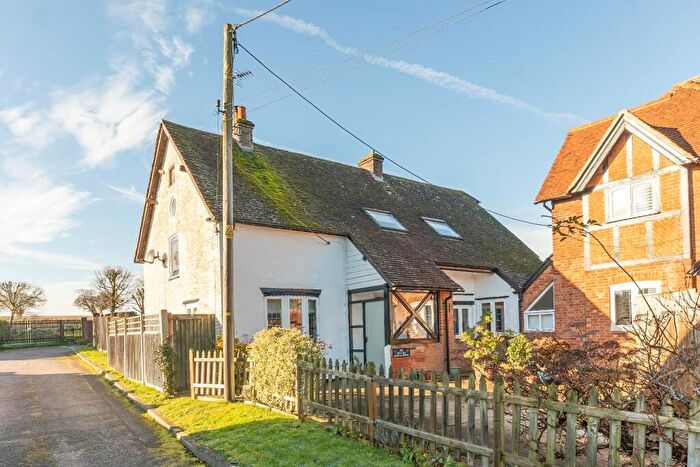
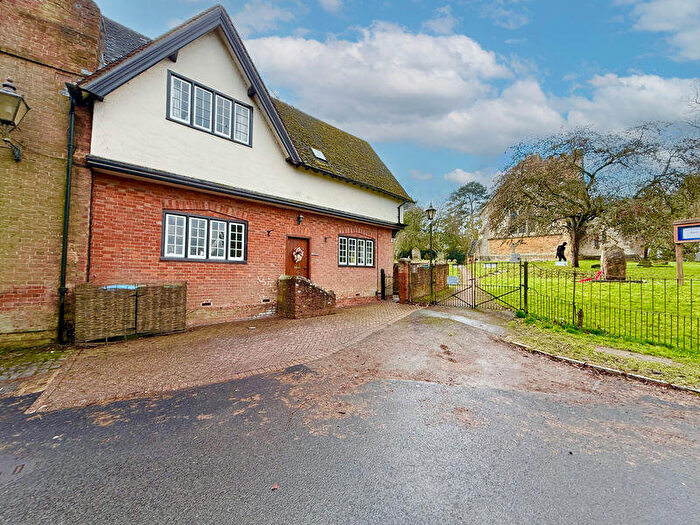
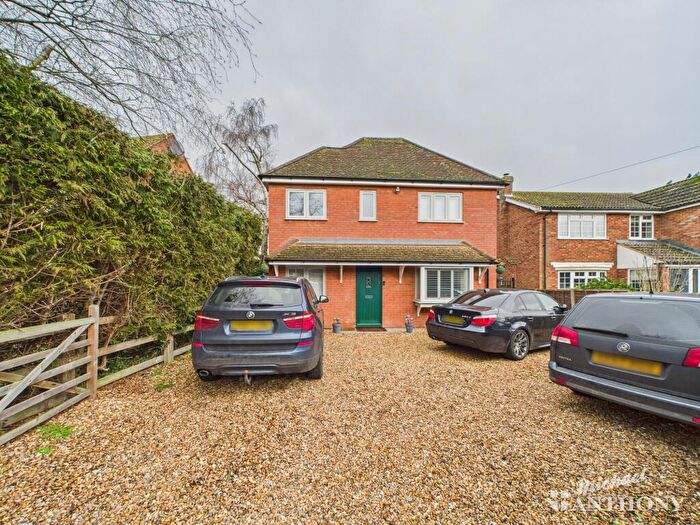
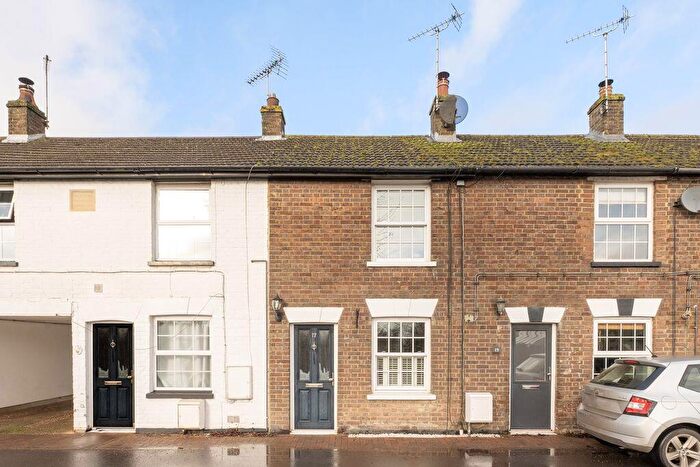
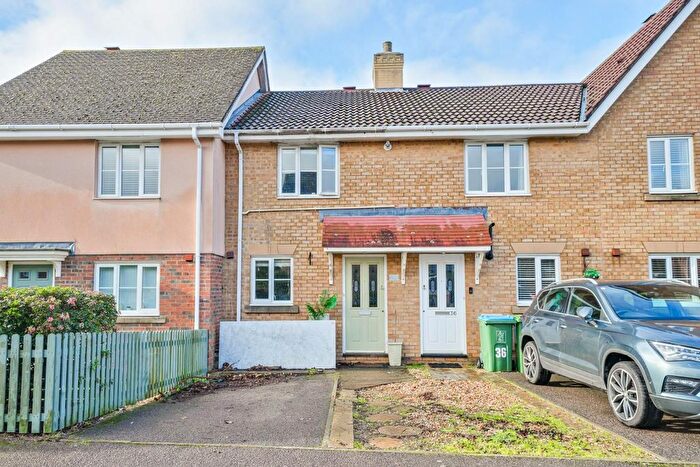
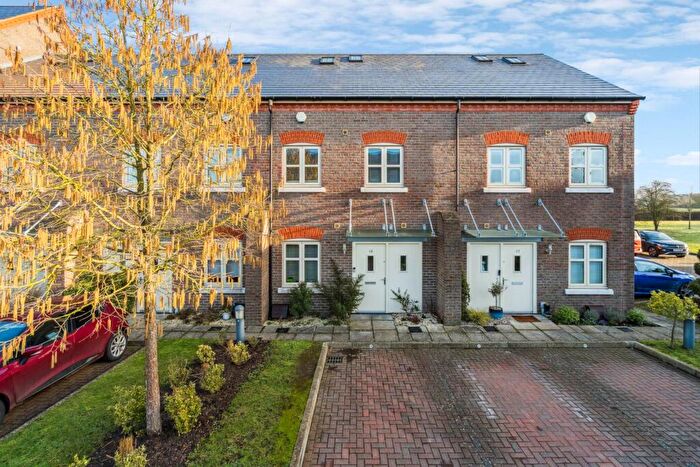
Houses for sale & to rent in Cheddington, Leighton Buzzard
House Prices in Cheddington
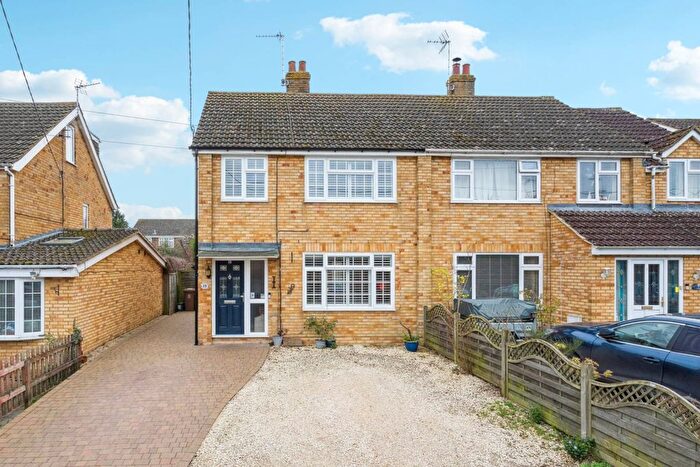
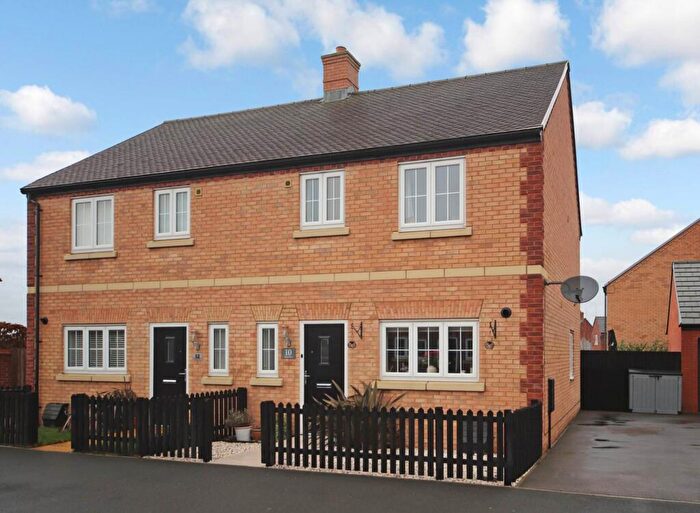
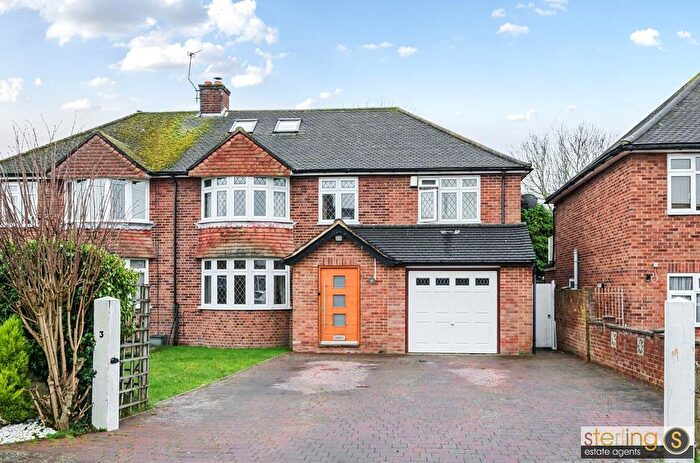
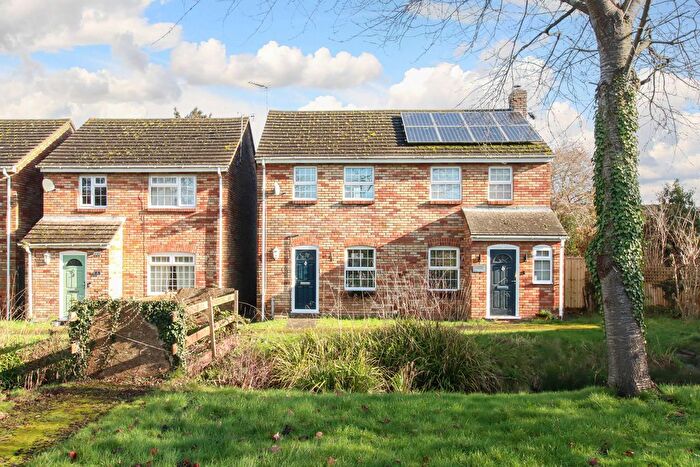
Properties in Cheddington have an average house price of £461,843.00 and had 103 Property Transactions within the last 3 years¹.
Cheddington is an area in Leighton Buzzard, Buckinghamshire with 940 households², where the most expensive property was sold for £1,100,000.00.
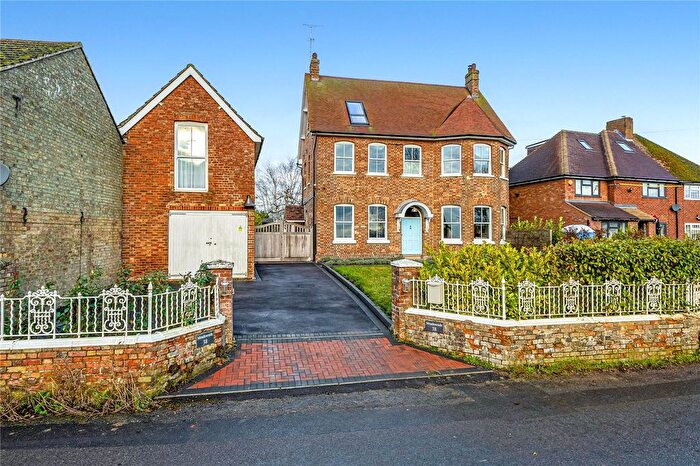
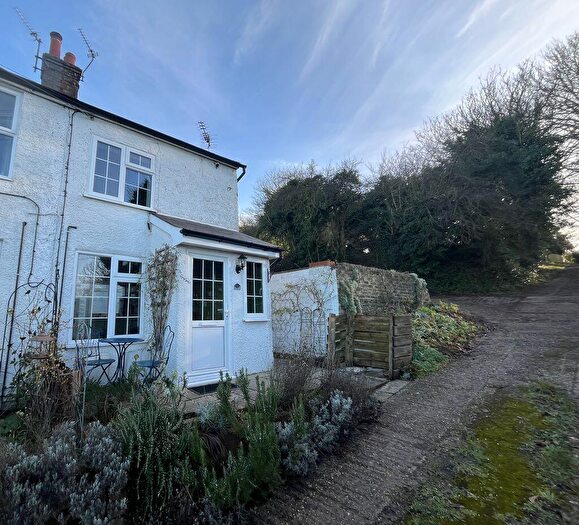
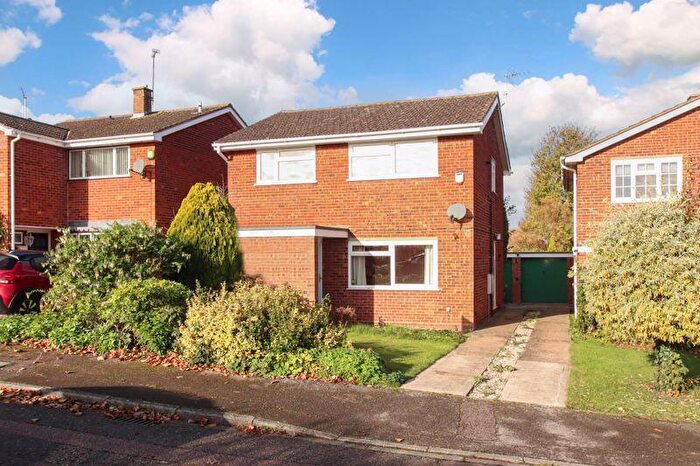
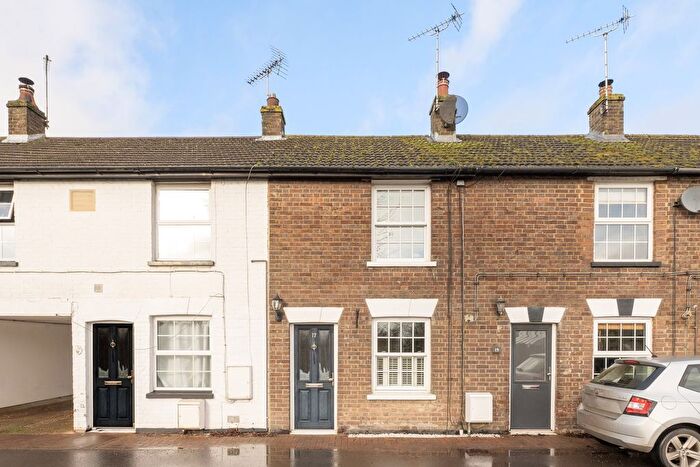
Properties for sale in Cheddington
Roads and Postcodes in Cheddington
Navigate through our locations to find the location of your next house in Cheddington, Leighton Buzzard for sale or to rent.
| Streets | Postcodes |
|---|---|
| Ashley Close | LU7 0UR |
| Barkham Close | LU7 0RT |
| Berryfields | LU7 0ST |
| Blenheim Close | LU7 0SE |
| Breachwell Place | LU7 0SF |
| Brewery Cottages | LU7 9BU |
| Brocas Way | LU7 0QP |
| Brownlow Lane | LU7 0SS |
| Bury Farm Close | LU7 9DS |
| Chaseside Close | LU7 0SA |
| Church Hill | LU7 0SX LU7 0SY |
| Church Lane | LU7 0RU |
| Church Road | LU7 9BX LU7 9DR |
| Cooks Wharf | LU7 0SZ LU7 9AD |
| Croft Meadows | LU7 0XH |
| Goodwins Mead | LU7 0RZ |
| Goose Acre | LU7 0SR |
| Grove | LU7 0QU |
| High Street | LU7 0RG LU7 0RQ LU7 9AA |
| Hillside | LU7 0SP |
| Horseshoe Close | LU7 0SB |
| Horton Road | LU7 0QS LU7 0QW LU7 9DB |
| Keepers Close | LU7 0EH |
| Lammas Road | LU7 0RY |
| Leeches Way | LU7 0SJ |
| Lodge Close | LU7 0US |
| Long Ley | LU7 0SU |
| Long Marston Road | LU7 0RS |
| Manor Pound Road | LU7 0SL |
| Manor Road | LU7 0RP LU7 0RW |
| Mentmore Road | LU7 0SD |
| Mill Road | LU7 9BT |
| New Street | LU7 0RL |
| Old Farm Close | LU7 0UF |
| Paines Orchard | LU7 0SN |
| Partridge Close | LU7 0FP |
| Rectory Close | LU7 9BZ |
| Spinney Cottages | LU7 9BY |
| Station Cottages | LU7 0SQ |
| Station Road | LU7 0SG LU7 0SH |
| Sunnybank | LU7 0RN |
| The Baulk | LU7 0RR |
| The Green | LU7 0RJ |
| The Slipe | LU7 0RH |
| Theedway | LU7 9RP |
| Tornay Court | LU7 9DA |
| Town Farm | LU7 0TT |
| LU7 0QN LU7 0QR |
Transport near Cheddington
- FAQ
- Price Paid By Year
- Property Type Price
Frequently asked questions about Cheddington
What is the average price for a property for sale in Cheddington?
The average price for a property for sale in Cheddington is £461,843. This amount is 7% lower than the average price in Leighton Buzzard. There are 577 property listings for sale in Cheddington.
What streets have the most expensive properties for sale in Cheddington?
The streets with the most expensive properties for sale in Cheddington are Town Farm at an average of £975,000, Croft Meadows at an average of £870,000 and Station Road at an average of £860,000.
What streets have the most affordable properties for sale in Cheddington?
The streets with the most affordable properties for sale in Cheddington are Tornay Court at an average of £248,750, Spinney Cottages at an average of £290,000 and Theedway at an average of £330,346.
Which train stations are available in or near Cheddington?
Some of the train stations available in or near Cheddington are Cheddington, Tring and Leighton Buzzard.
Property Price Paid in Cheddington by Year
The average sold property price by year was:
| Year | Average Sold Price | Price Change |
Sold Properties
|
|---|---|---|---|
| 2025 | £463,272 | -3% |
33 Properties |
| 2024 | £477,948 | 8% |
40 Properties |
| 2023 | £438,796 | -3% |
30 Properties |
| 2022 | £452,378 | 6% |
42 Properties |
| 2021 | £425,228 | -5% |
70 Properties |
| 2020 | £447,963 | 9% |
47 Properties |
| 2019 | £405,890 | 4% |
38 Properties |
| 2018 | £389,594 | 8% |
48 Properties |
| 2017 | £359,604 | -4% |
48 Properties |
| 2016 | £373,540 | 16% |
50 Properties |
| 2015 | £312,755 | -3% |
69 Properties |
| 2014 | £321,657 | 11% |
73 Properties |
| 2013 | £287,673 | -6% |
45 Properties |
| 2012 | £304,038 | 9% |
26 Properties |
| 2011 | £276,165 | -13% |
36 Properties |
| 2010 | £313,000 | 14% |
28 Properties |
| 2009 | £270,049 | -15% |
29 Properties |
| 2008 | £310,842 | -16% |
26 Properties |
| 2007 | £359,460 | 18% |
51 Properties |
| 2006 | £296,342 | 15% |
70 Properties |
| 2005 | £251,720 | -15% |
49 Properties |
| 2004 | £288,526 | 13% |
63 Properties |
| 2003 | £249,594 | 16% |
48 Properties |
| 2002 | £209,054 | 21% |
74 Properties |
| 2001 | £165,842 | 3% |
61 Properties |
| 2000 | £160,485 | 3% |
62 Properties |
| 1999 | £155,820 | 18% |
81 Properties |
| 1998 | £127,425 | 1% |
57 Properties |
| 1997 | £125,595 | 19% |
61 Properties |
| 1996 | £102,292 | 13% |
78 Properties |
| 1995 | £88,727 | - |
43 Properties |
Property Price per Property Type in Cheddington
Here you can find historic sold price data in order to help with your property search.
The average Property Paid Price for specific property types in the last three years are:
| Property Type | Average Sold Price | Sold Properties |
|---|---|---|
| Semi Detached House | £433,793.00 | 37 Semi Detached Houses |
| Detached House | £608,471.00 | 35 Detached Houses |
| Terraced House | £344,648.00 | 27 Terraced Houses |
| Flat | £229,375.00 | 4 Flats |

