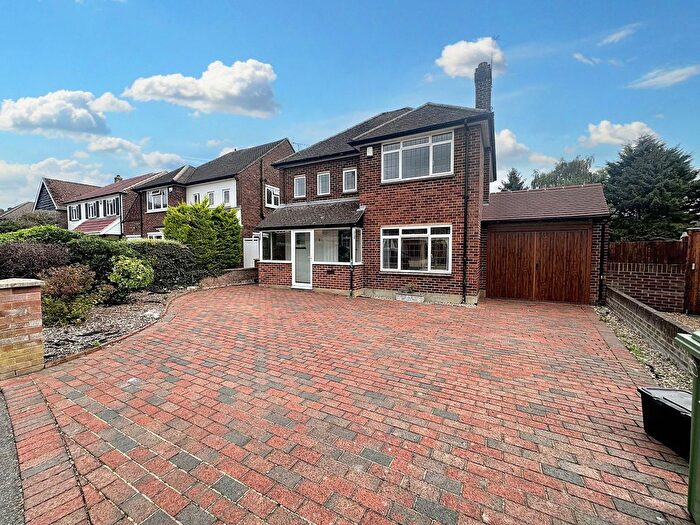
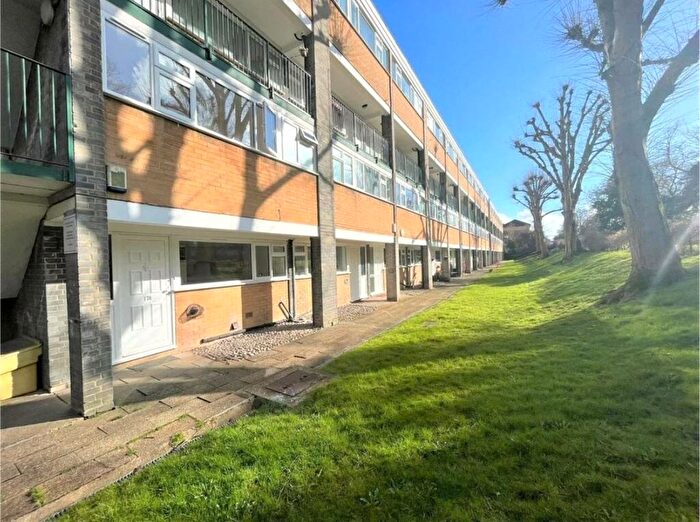
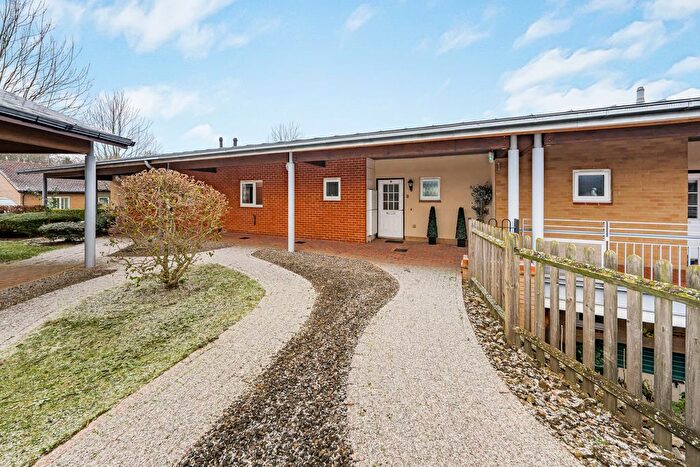
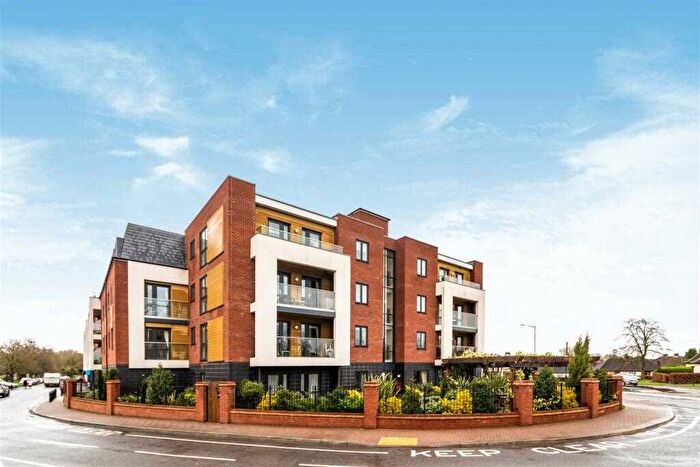
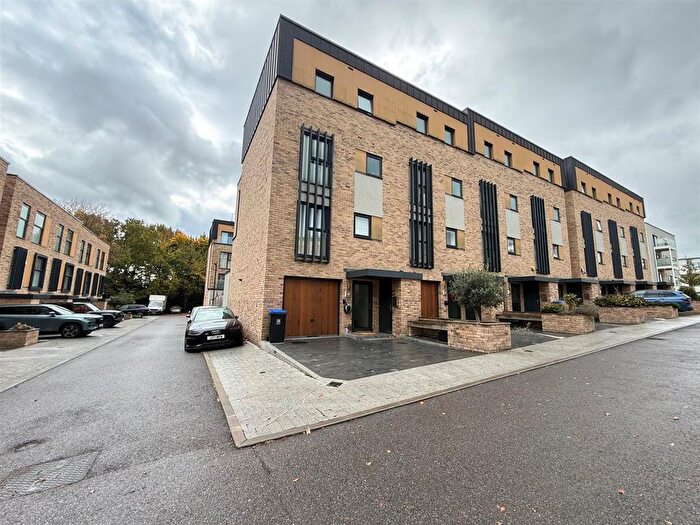
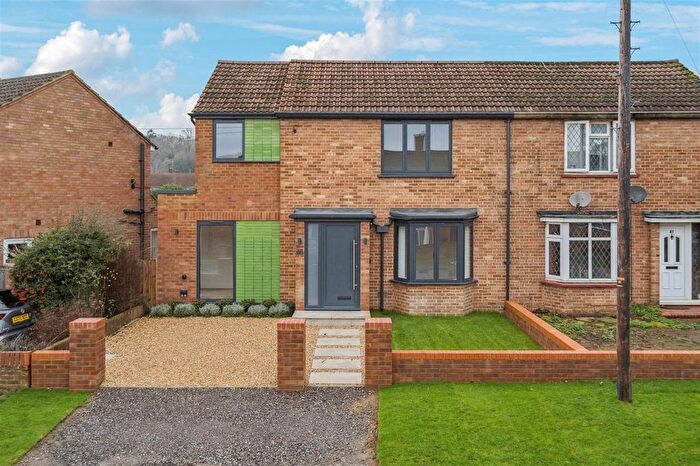
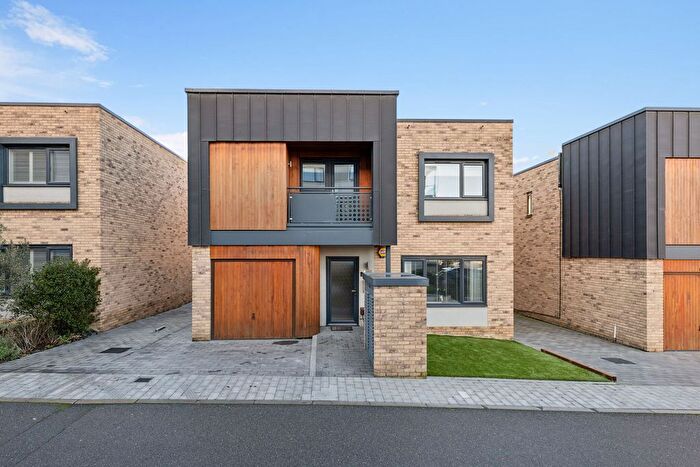
Houses for sale & to rent in Denham North, Uxbridge
House Prices in Denham North
Properties in Denham North have an average house price of £538,727.00 and had 125 Property Transactions within the last 3 years¹.
Denham North is an area in Uxbridge, Buckinghamshire with 1,240 households², where the most expensive property was sold for £1,280,000.00.
Properties for sale in Denham North
Previously listed properties in Denham North
Roads and Postcodes in Denham North
Navigate through our locations to find the location of your next house in Denham North, Uxbridge for sale or to rent.
| Streets | Postcodes |
|---|---|
| Albert Mews | UB9 5PE |
| Ashcroft Drive | UB9 5JF UB9 5JG |
| Bowyer Crescent | UB9 5JE |
| Broadway | UB9 5HB |
| Chairmans Walk | UB9 5PP |
| Denham Green Close | UB9 5NA UB9 5NB |
| Denham Green Lane | UB9 5LD UB9 5LE UB9 5LF UB9 5LG UB9 5LH UB9 5LQ |
| Edinburgh Gate | UB9 5GB |
| Green Tiles | UB9 5HX |
| Green Tiles Lane | UB9 5EU UB9 5HT UB9 5HU |
| James Martin Close | UB9 5NN |
| John Mills Court | UB9 5GF |
| Link Way | UB9 5NL |
| Marish Lane | UB9 5DL |
| Mirrie Lane | UB9 5DS |
| Moorfield Road | UB9 5NE UB9 5NF UB9 5NR |
| Nightingale Way | UB9 5JH UB9 5JJ UB9 5JL |
| North Orbital Road | UB9 5EY UB9 5EZ UB9 5HA |
| Olivier Court | UB9 5NS |
| Patrons Way East | UB9 5NP |
| Patrons Way West | UB9 5GD UB9 5GE UB9 5PB UB9 5PH UB9 5PJ UB9 5PL UB9 5PN |
| Penn Drive | UB9 5JP UB9 5JR |
| Pollard Avenue | UB9 5JN |
| Queen Mothers Drive | UB9 5GA |
| Ranston Close | UB9 5JX |
| Redgrave Court | UB9 5NT |
| Savay Close | UB9 5NQ |
| Savay Lane | UB9 5NH UB9 5NJ |
| Sheepcote Gardens | UB9 5LJ |
| Slade Oak Lane | UB9 5DN UB9 5DW |
| St Francis Road | UB9 5JS |
| St Marys Road | UB9 5JU |
| Station Parade | UB9 5ET |
| Stewart Court | UB9 5GH |
| The Eagles | UB9 5NY |
| Tilehouse Lane | UB9 5DA UB9 5DD UB9 5DE UB9 5DF UB9 5DG |
| Tilehouse Way | UB9 5HY UB9 5HZ UB9 5JA UB9 5JB UB9 5JD UB9 5JQ |
| Trustees Close | UB9 5GG |
| Woodhurst Drive | UB9 5LL |
Transport near Denham North
-
Denham Station
-
Denham Golf Club Station
-
Gerrards Cross Station
-
Uxbridge Station
-
West Ruislip Station
- FAQ
- Price Paid By Year
- Property Type Price
Frequently asked questions about Denham North
What is the average price for a property for sale in Denham North?
The average price for a property for sale in Denham North is £538,727. This amount is 11% lower than the average price in Uxbridge. There are 332 property listings for sale in Denham North.
What streets have the most expensive properties for sale in Denham North?
The streets with the most expensive properties for sale in Denham North are Pollard Avenue at an average of £1,050,000, Savay Lane at an average of £917,500 and Denham Green Lane at an average of £796,785.
What streets have the most affordable properties for sale in Denham North?
The streets with the most affordable properties for sale in Denham North are Ranston Close at an average of £160,000, Broadway at an average of £265,000 and North Orbital Road at an average of £274,642.
Which train stations are available in or near Denham North?
Some of the train stations available in or near Denham North are Denham, Denham Golf Club and Gerrards Cross.
Which tube stations are available in or near Denham North?
Some of the tube stations available in or near Denham North are Uxbridge and West Ruislip.
Property Price Paid in Denham North by Year
The average sold property price by year was:
| Year | Average Sold Price | Price Change |
Sold Properties
|
|---|---|---|---|
| 2025 | £518,250 | -3% |
32 Properties |
| 2024 | £531,664 | -4% |
38 Properties |
| 2023 | £555,521 | -5% |
55 Properties |
| 2022 | £580,872 | 22% |
55 Properties |
| 2021 | £452,920 | -4% |
59 Properties |
| 2020 | £470,051 | -15% |
39 Properties |
| 2019 | £542,484 | 7% |
36 Properties |
| 2018 | £502,432 | -12% |
38 Properties |
| 2017 | £563,140 | 23% |
46 Properties |
| 2016 | £433,039 | -14% |
55 Properties |
| 2015 | £494,258 | 28% |
55 Properties |
| 2014 | £356,665 | 9% |
36 Properties |
| 2013 | £325,596 | 4% |
38 Properties |
| 2012 | £311,206 | -17% |
31 Properties |
| 2011 | £363,149 | 12% |
56 Properties |
| 2010 | £320,791 | -12% |
56 Properties |
| 2009 | £358,442 | 8% |
45 Properties |
| 2008 | £329,625 | 8% |
43 Properties |
| 2007 | £302,601 | -4% |
66 Properties |
| 2006 | £313,547 | 7% |
78 Properties |
| 2005 | £292,848 | 19% |
49 Properties |
| 2004 | £238,498 | -3% |
35 Properties |
| 2003 | £244,930 | 6% |
33 Properties |
| 2002 | £230,159 | 20% |
40 Properties |
| 2001 | £183,250 | -5% |
53 Properties |
| 2000 | £192,844 | 30% |
49 Properties |
| 1999 | £134,222 | -29% |
70 Properties |
| 1998 | £172,793 | 24% |
46 Properties |
| 1997 | £131,408 | 20% |
48 Properties |
| 1996 | £104,878 | 15% |
44 Properties |
| 1995 | £88,977 | - |
21 Properties |
Property Price per Property Type in Denham North
Here you can find historic sold price data in order to help with your property search.
The average Property Paid Price for specific property types in the last three years are:
| Property Type | Average Sold Price | Sold Properties |
|---|---|---|
| Semi Detached House | £570,764.00 | 34 Semi Detached Houses |
| Detached House | £769,620.00 | 31 Detached Houses |
| Terraced House | £506,500.00 | 17 Terraced Houses |
| Flat | £359,679.00 | 43 Flats |

