
Houses for sale & to rent in Radcliffe North, Bury
House Prices in Radcliffe North
Properties in Radcliffe North have an average house price of £649k and had 6 Property Transactions within the last 3 years¹.
Radcliffe North is an area in Bury, Bury with 63 households², where the most expensive property was sold for £1.15M.
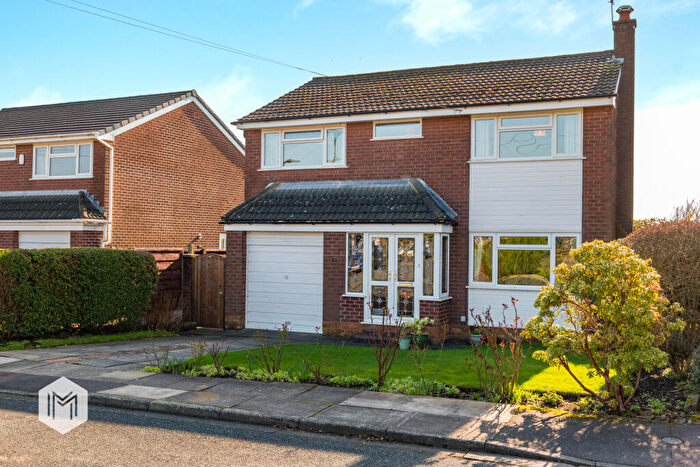
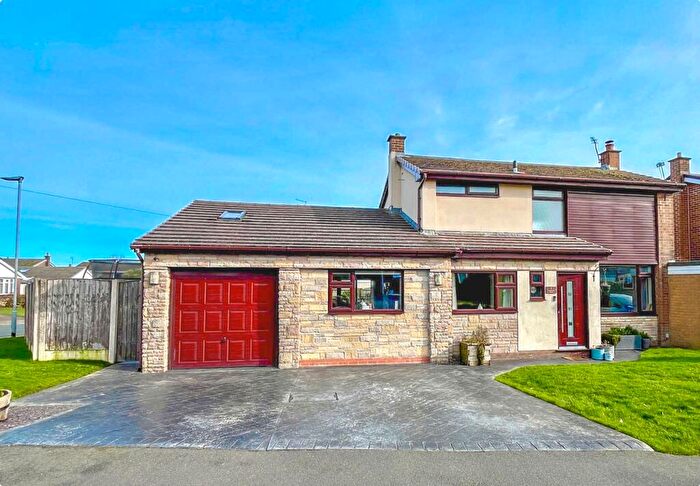
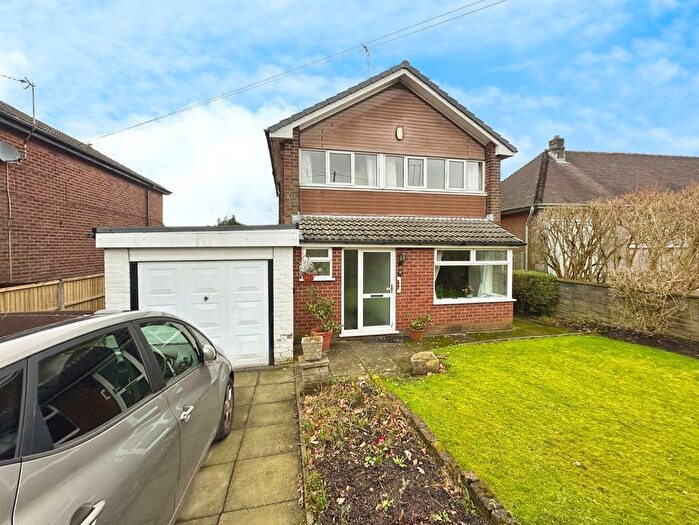
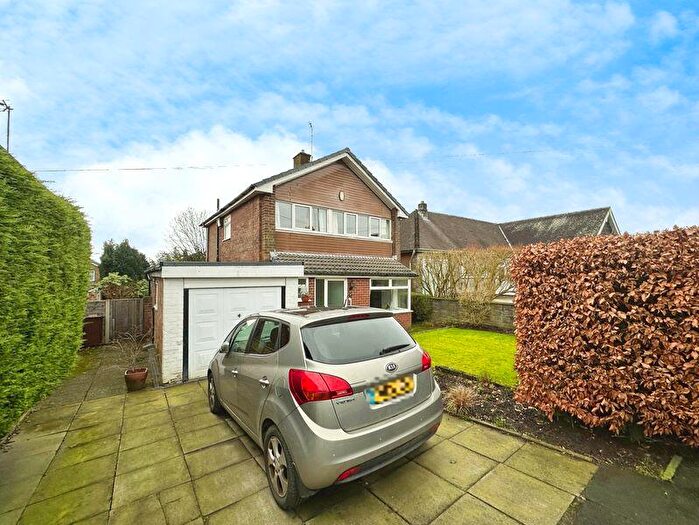
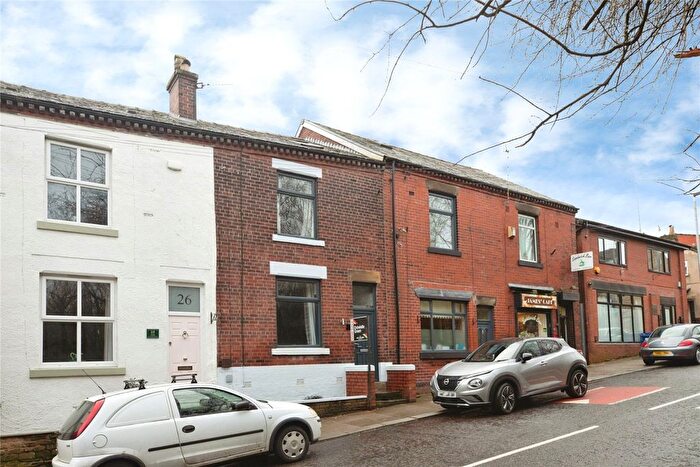
Properties for sale in Radcliffe North
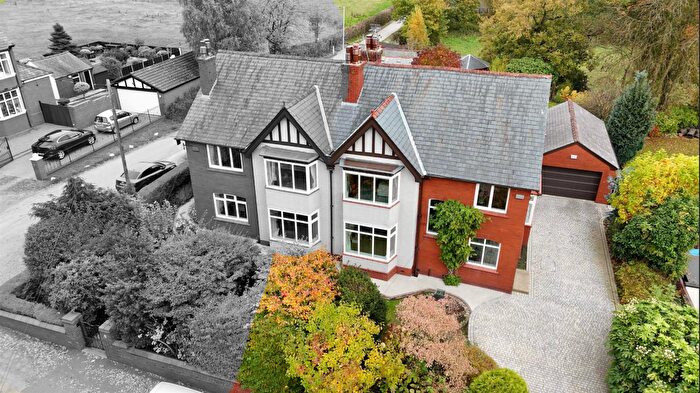
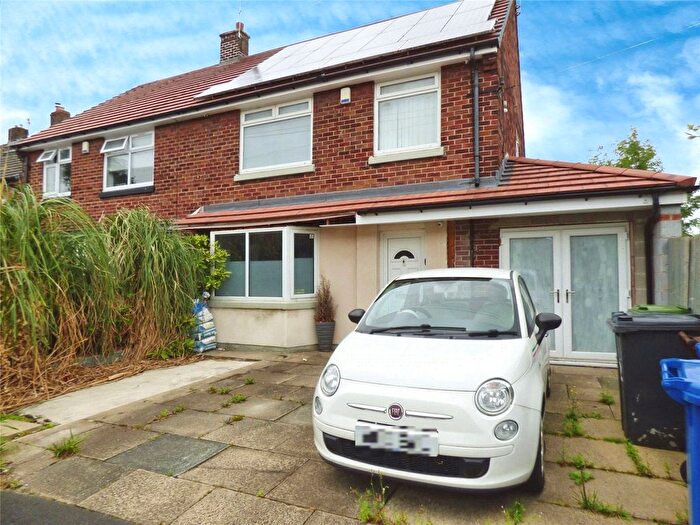
![]()
If you are looking to sell your house, let it out, or receive a property valuation, an expert can help you.
Click the button below to get started.

Roads and Postcodes in Radcliffe North
Navigate through our locations to find the location of your next house in Radcliffe North, Bury for sale or to rent.
Transport near Radcliffe North
-
 Hall I' Th' Wood Station
 -
Bromley Cross Station
-
Farnworth Station
-
Moses Gate Station
-
Kearsley Station
-
Bolton Station
-
Clifton Station
- FAQ
- Price Paid By Year
- Property Type Price
Frequently asked questions about Radcliffe North
What is the average price for a property for sale in Radcliffe North?
The average price for a property for sale in Radcliffe North is £648,666. This amount is 170% higher than the average price in Bury. There are 521 property listings for sale in Radcliffe North.
What streets have the most expensive properties for sale in Radcliffe North?
The street with the most expensive properties for sale in Radcliffe North is Cockey Moor Road at an average of £991,666.
What streets have the most affordable properties for sale in Radcliffe North?
The street with the most affordable properties for sale in Radcliffe North is Lowercroft Road at an average of £305,666.
Which train stations are available in or near Radcliffe North?
Some of the train stations available in or near Radcliffe North are Hall I' Th' Wood, Bromley Cross and Farnworth.
Property Price Paid in Radcliffe North by Year
The average sold property price by year was:
| Year | Average Sold Price | Price Change |
Sold Properties
|
|---|---|---|---|
| 2025 | £572,333 | -101% |
3 Properties |
| 2024 | £1,150,000 | 55% |
1 Property |
| 2023 | £512,500 | 52% |
2 Properties |
| 2021 | £243,666 | -6% |
3 Properties |
| 2020 | £259,000 | 16% |
3 Properties |
| 2019 | £217,333 | -8% |
3 Properties |
| 2018 | £235,000 | 4% |
1 Property |
| 2017 | £224,500 | 15% |
2 Properties |
| 2016 | £191,500 | 7% |
2 Properties |
| 2015 | £178,500 | -207% |
1 Property |
| 2014 | £548,333 | 25% |
3 Properties |
| 2013 | £412,500 | 46% |
2 Properties |
| 2012 | £221,500 | 17% |
3 Properties |
| 2011 | £184,400 | -108% |
1 Property |
| 2010 | £384,333 | 9% |
3 Properties |
| 2009 | £351,000 | 43% |
2 Properties |
| 2008 | £199,000 | -51% |
1 Property |
| 2007 | £300,983 | 40% |
3 Properties |
| 2006 | £181,833 | -150% |
3 Properties |
| 2005 | £455,000 | 25% |
3 Properties |
| 2004 | £343,316 | 38% |
3 Properties |
| 2003 | £211,987 | -103% |
4 Properties |
| 2002 | £430,000 | 28% |
1 Property |
| 2001 | £310,000 | 54% |
1 Property |
| 2000 | £143,333 | 15% |
3 Properties |
| 1999 | £121,400 | -10% |
3 Properties |
| 1998 | £133,783 | 24% |
3 Properties |
| 1997 | £101,390 | -19% |
5 Properties |
| 1996 | £120,800 | 52% |
5 Properties |
| 1995 | £58,333 | - |
3 Properties |
Property Price per Property Type in Radcliffe North
Here you can find historic sold price data in order to help with your property search.
The average Property Paid Price for specific property types in the last three years are:
| Property Type | Average Sold Price | Sold Properties |
|---|---|---|
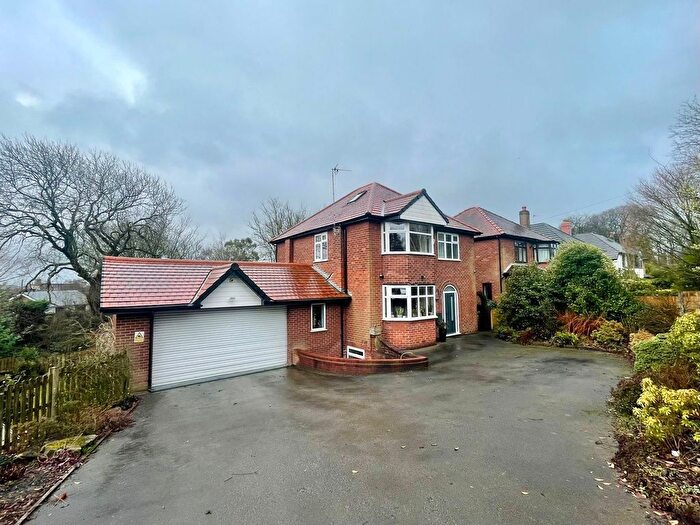
| Detached House | £828,000.00 | 4 Detached Houses |
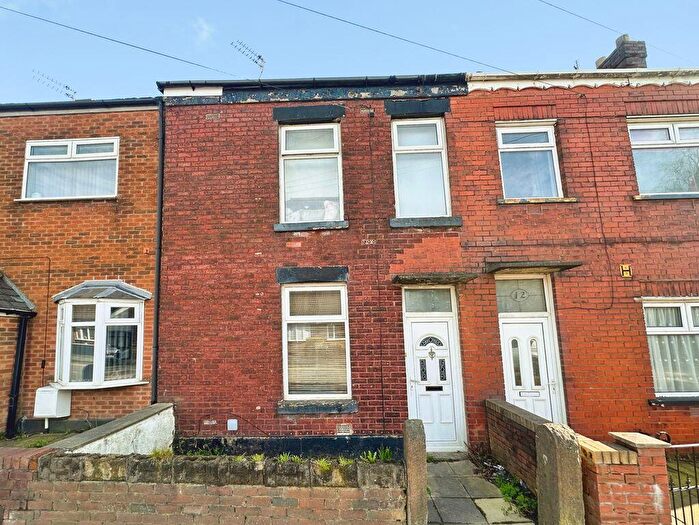
| Terraced House | £290,000.00 | 2 Terraced Houses |