
Houses for sale in Bury, Bury
House Prices in Bury
Properties in Bury have an average house price of £241k and had 4,045 Property Transactions within the last 3 years.¹
Bury is an area in Bury with 42,151 households², where the most expensive property was sold for £1.5M.
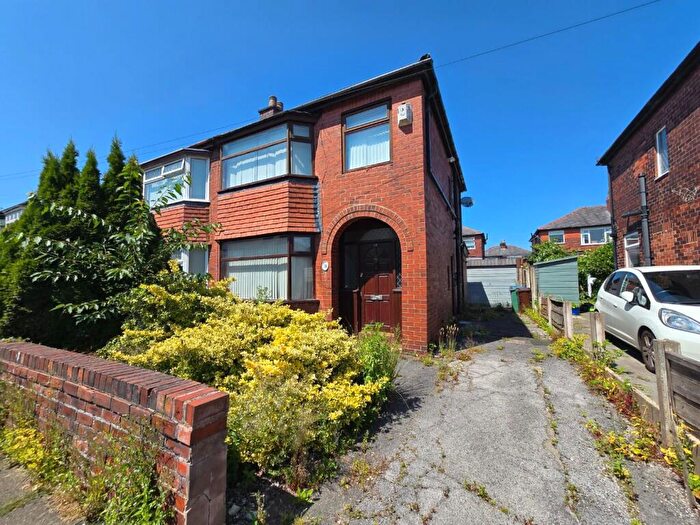
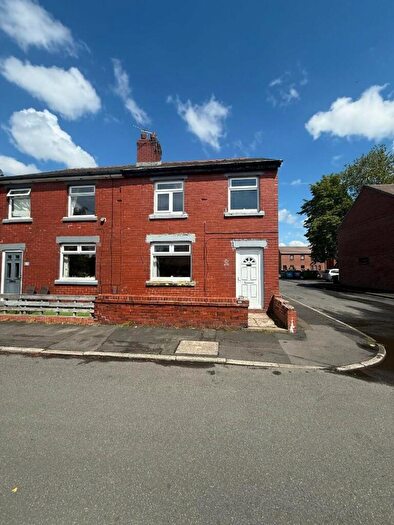
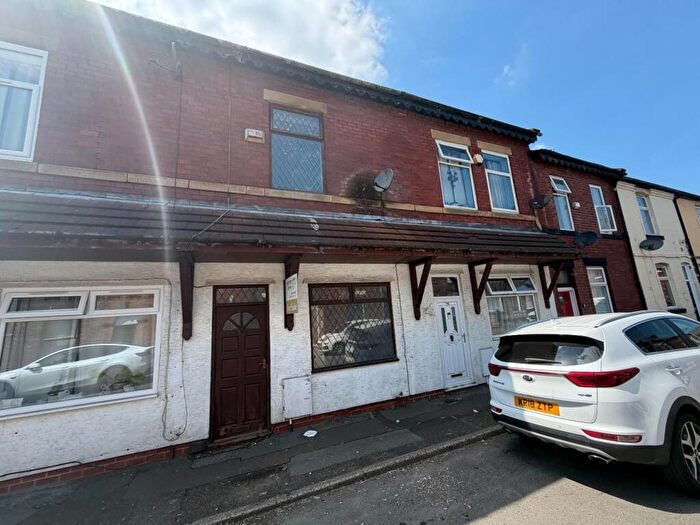
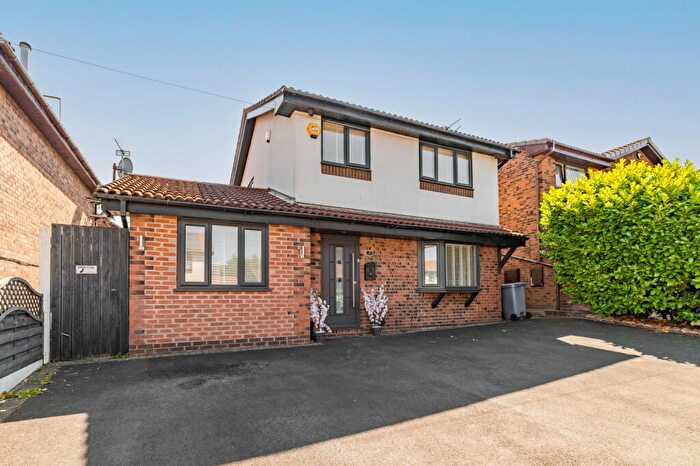
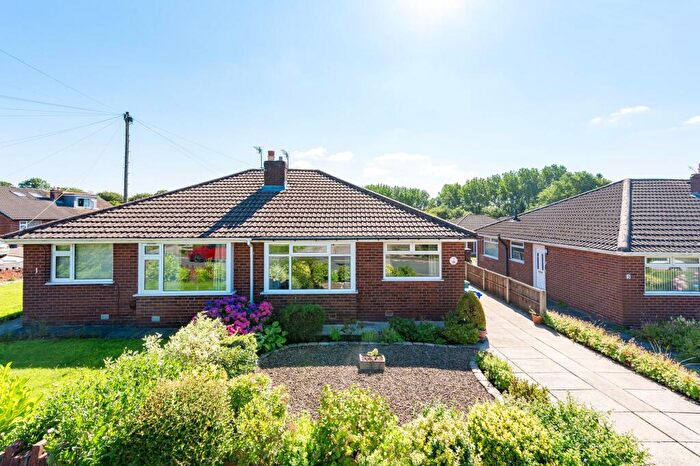
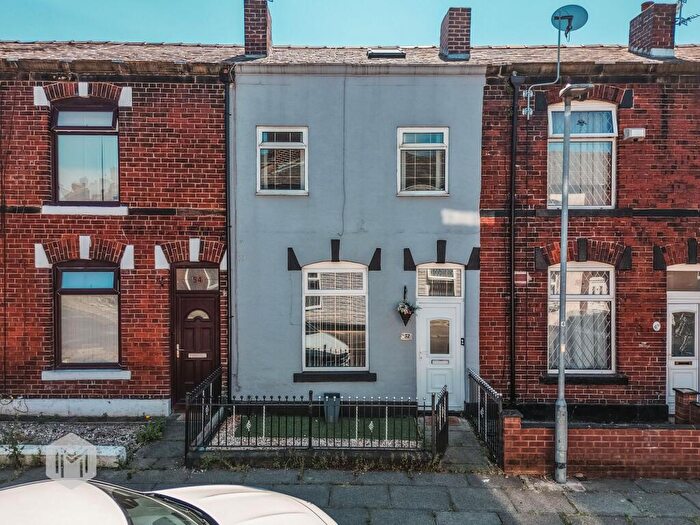
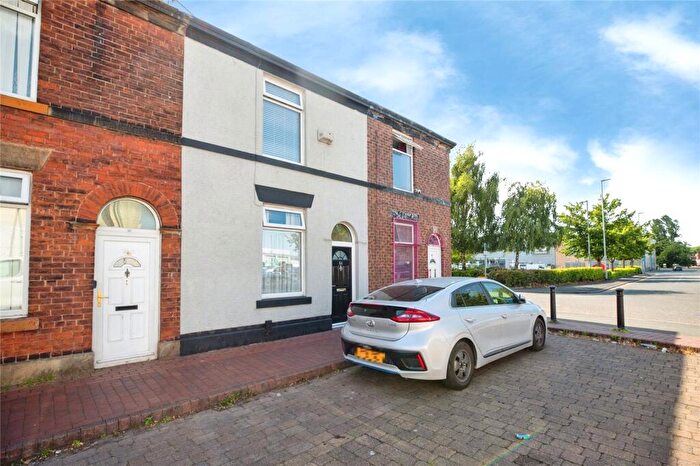
Properties for sale in Bury
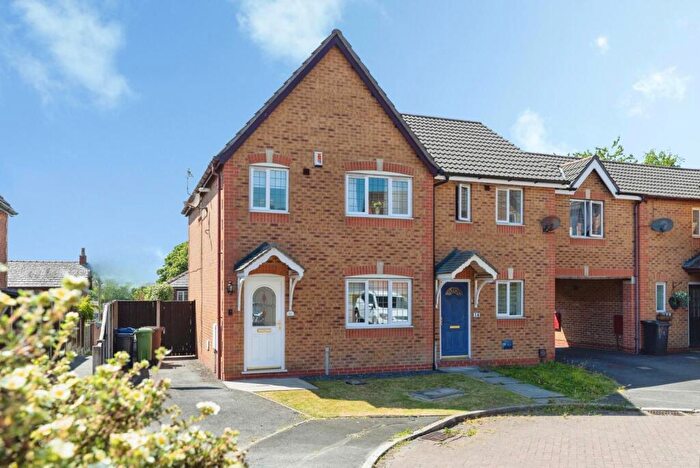
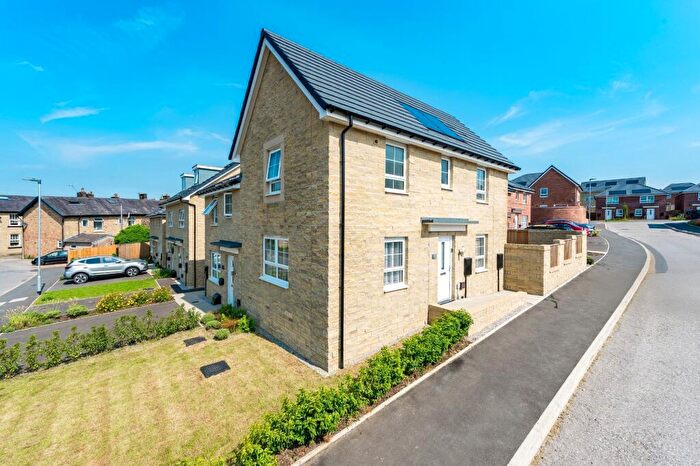
![]()
If you are looking to sell your house, let it out, or receive a property valuation, an expert can help you.
Click the button below to get started.

Neighbourhoods in Bury
Navigate through our locations to find the location of your next house in Bury, Bury for sale or to rent.
Property price trends in Bury
According to the latest Land Registry data, the average home in Bury sold for £228,611 in 2026. That figure comes from a substantial record of 51,932 sales logged over the past 31 years.
Prices have held fairly steady over the last three years. Compared with 2023, when the typical sale came in around £226,493, values are broadly unchanged.
Looking back five years, average prices are up about 1.6% since 2021, a gain of around £3,494 in cash terms.
Zoom out to the past decade for the fuller picture. Back in 2016, homes here averaged £166,280, so the typical sold price has climbed about 37.5% since then, roughly 3.2% a year. Stretch the view to fifteen years and that annual pace holds at about 3.4%.
Frequently asked questions about Bury
What is the average price for a property for sale in Bury?
The average price for a property for sale in Bury is £241,060. This amount is 2% lower than the average price in Bury. There are more than 10,000 property listings for sale in Bury.
What locations have the most expensive properties for sale in Bury?
The locations with the most expensive properties for sale in Bury are Radcliffe North at an average of £648,666, North Manor at an average of £334,803 and Besses at an average of £313,431.
What locations have the most affordable properties for sale in Bury?
The locations with the most affordable properties for sale in Bury are East at an average of £161,063, Moorside at an average of £180,177 and Pilkington Park at an average of £187,998.
Which train stations are available in or near Bury?
Some of the train stations available in or near Bury are Bromley Cross, Hall I' Th' Wood and Farnworth.
Property Price Paid in Bury by Year
The average sold property price by year was:
| Year | Average Sold Price | Price Change |
Sold Properties
|
|---|---|---|---|
| 2026 | £228,611 | -11% |
87 Properties |
| 2025 | £253,538 | 4% |
1,316 Properties |
| 2024 | £242,841 | 7% |
1,416 Properties |
| 2023 | £226,493 | -2% |
1,226 Properties |
| 2022 | £231,949 | 3% |
1,590 Properties |
| 2021 | £225,117 | 11% |
1,948 Properties |
| 2020 | £200,857 | 7% |
1,284 Properties |
| 2019 | £187,459 | 5% |
1,639 Properties |
| 2018 | £178,914 | 6% |
1,601 Properties |
| 2017 | £167,311 | 1% |
1,616 Properties |
Property Price per Property Type in Bury
Here you can find historic sold price data in order to help with your property search.
The average Property Paid Price for specific property types in the last three years are:
| Property Type | Average Sold Price | Sold Properties |
|---|---|---|
| Semi Detached House | £248,218.00 | 1,267 Semi Detached Houses |
| Terraced House | £181,672.00 | 1,668 Terraced Houses |
| Detached House | £407,863.00 | 752 Detached Houses |
| Flat | £142,051.00 | 358 Flats |
Transport in Bury
Please see below transportation links in this area:
