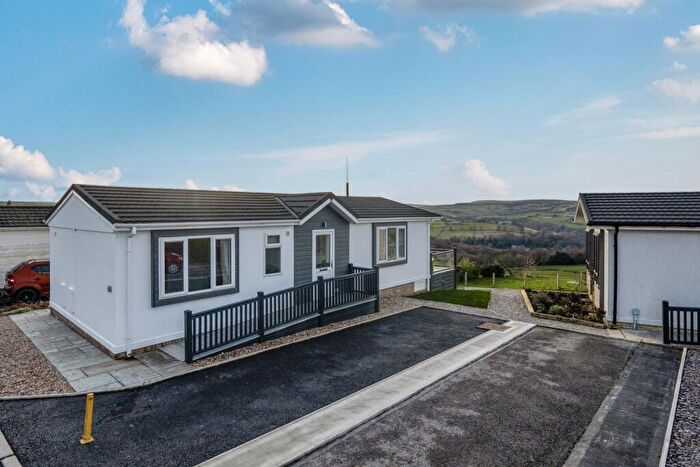
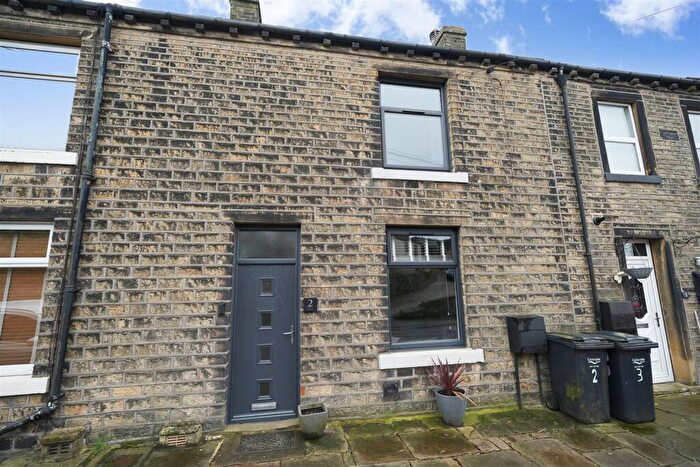
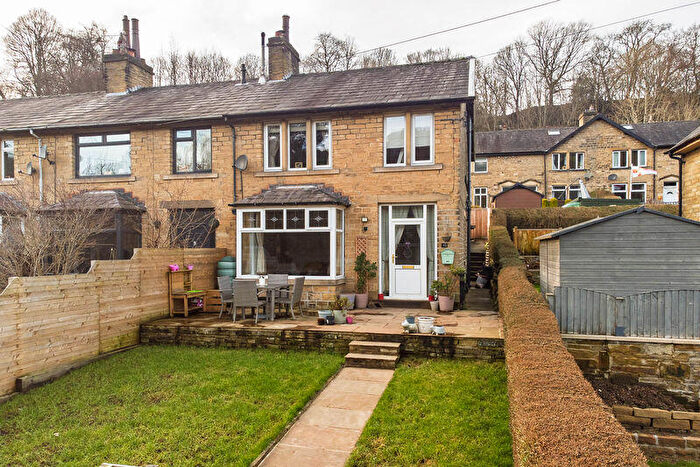
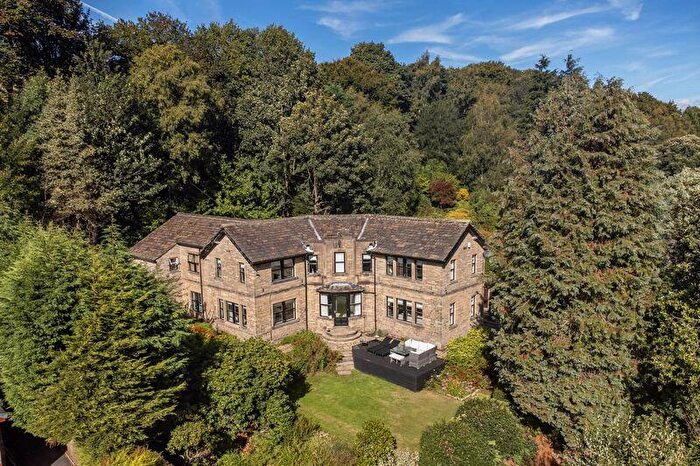
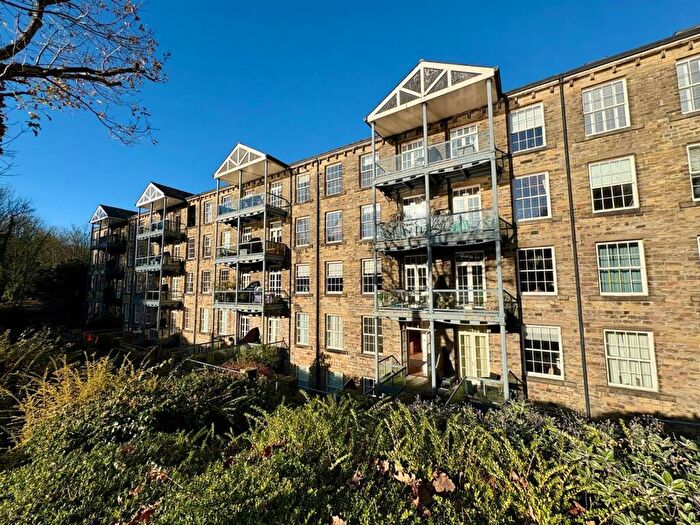
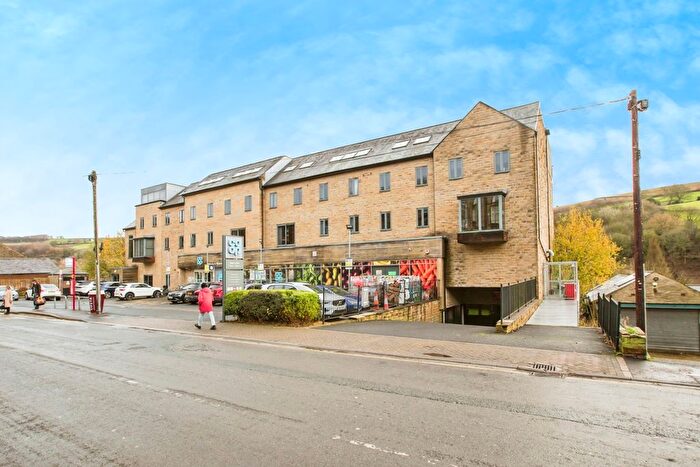
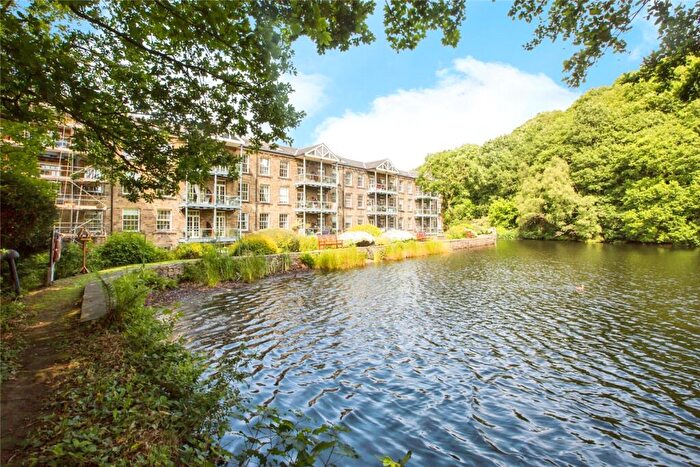
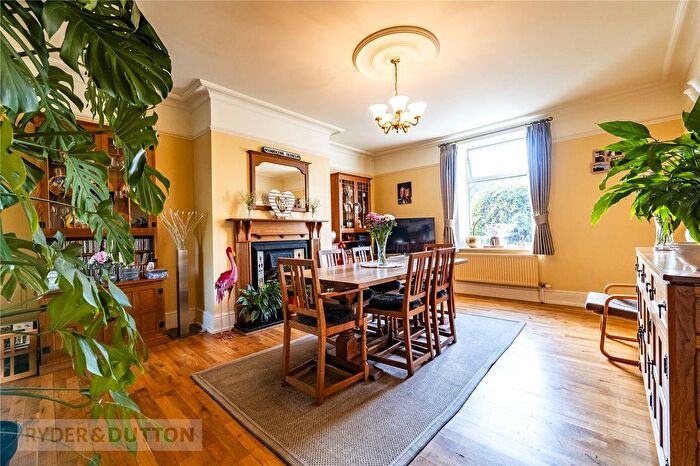
Houses for sale & to rent in Ryburn, Halifax
House Prices in Ryburn
Properties in Ryburn have an average house price of £389,476.00 and had 55 Property Transactions within the last 3 years¹.
Ryburn is an area in Halifax, Calderdale with 681 households², where the most expensive property was sold for £1,097,260.00.
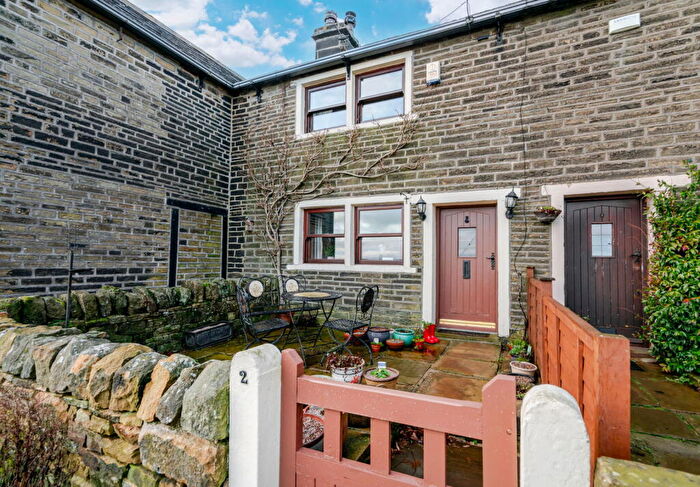
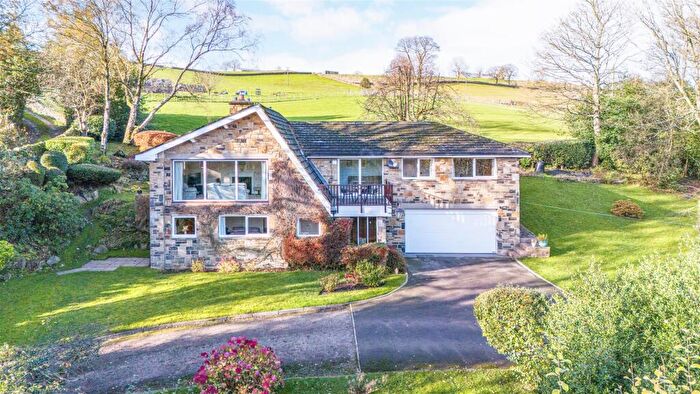
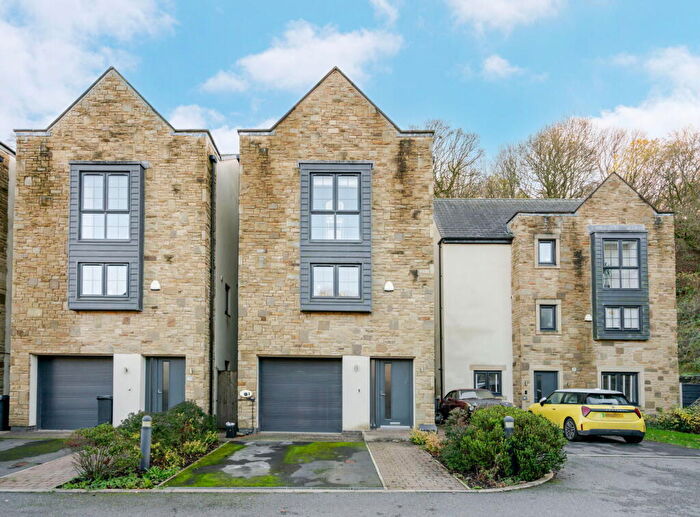
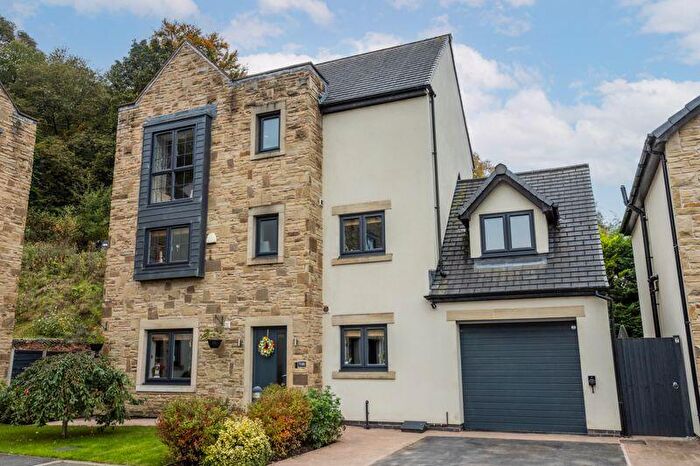
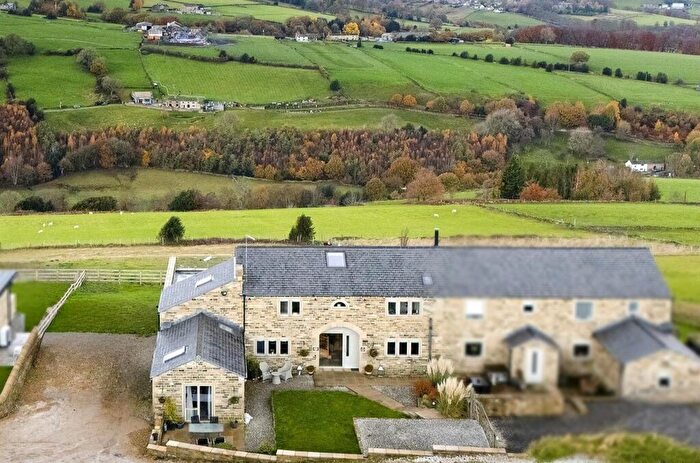
Properties for sale in Ryburn
Roads and Postcodes in Ryburn
Navigate through our locations to find the location of your next house in Ryburn, Halifax for sale or to rent.
| Streets | Postcodes |
|---|---|
| Bank Royd Lane | HX4 0EW |
| Bank View | HX4 0DN |
| Barkisland | HX4 0AP HX4 0AS HX4 0AY HX4 0AZ HX4 0BG HX4 0BN HX4 0BZ HX4 0DE HX4 0DJ HX4 0DL HX4 0DX HX4 0DY HX4 0EP HX4 0EQ HX4 0BD HX4 0EE HX4 0EH HX4 0ET |
| Beestonley Lane | HX4 0HF |
| Belle Vue | HX4 0DW |
| Branch Road | HX4 0AD HX4 0AA HX4 0FF |
| Chapel Terrace | HX4 0BJ |
| Church Terrace | HX4 0AN |
| Common Royd | HX4 0DA |
| Cross Villas | HX4 0DF |
| Crow Wood Lane | HX4 9QH |
| Delph Cottages | HX4 0BW |
| Delph Terrace | HX4 0BH |
| Fair View | HX4 0DP |
| Fiddle Lane | HX4 0FD HX4 0FJ |
| Field Hurst | HX4 0JE |
| Gilbert Cottages | HX4 0BP |
| Gilbert Gardens | HX4 0BT |
| Gosling Lane | HX4 0FH |
| Greetland Road | HX4 0BA HX4 0FP |
| Hansel Fold | HX4 0FA |
| Heald Terrace | HX4 0DB |
| Holywell Green | HX4 9PX HX4 9PZ |
| Howroyd Lane | HX4 0FG |
| Hudson Croft | HX4 0ED |
| Ivy Cottages | HX4 0DQ |
| Ivy Houses | HX4 0DH |
| Jackson Lane | HX4 0HE |
| Jackson Meadows | HX4 0DD |
| Kings Mount | HX4 0DT |
| Krumlin Hall Cottages | HX4 0AT |
| Krumlin Road | HX4 0AX |
| Laithe Field | HX4 0AE |
| Lightcliffe Royd | HX4 0BU |
| Longmeadow | HX4 0AR |
| Lower Fold | HX4 0BQ |
| Lower Gilbert Fields | HX4 0BX |
| Lower Woodhead | HX4 0EJ |
| Mawson Place | HX4 0BL |
| Meadow Croft | HX4 0FB |
| Moorfield Road | HX4 0FL |
| Myrtle Grove | HX4 0EG |
| New Laithe | HX4 0EN |
| North Royd | HX4 0AH |
| North View | HX4 0DR |
| Northfield | HX4 0BE |
| Pinfold Close | HX4 0EY |
| Plain Fields | HX4 0DU HX4 0HU |
| Post Office Buildings | HX4 0AL |
| Prospect Terrace | HX4 0AW |
| Ringstone | HX4 0EU |
| Rishworth Road | HX4 0FE |
| Saddleworth Road | HX4 0AF HX4 0AJ HX4 0HS |
| Sandyfoot | HX4 0JA |
| Scammonden Road | HX4 0EL |
| Slack Cottages | HX4 0DS |
| Slack Lane | HX4 0BB |
| Smithies Close | HX4 0HB |
| South View | HX4 0BY |
| Spring Grove Cottages | HX4 0EF |
| Stainland Road | HX4 0AG HX4 0AQ |
| Steel Lane | HX4 0ER |
| Steele Lane Head | HX4 0ES |
| Stonelea | HX4 0HD |
| Stony Butts Lane | HX4 0EX |
| Stony Croft Lane | HX4 0JD |
| The Cross | HX4 0DG |
| Upper Gilbert Fields | HX4 0BS |
| Upper Hall Fold | HX4 0HL |
| Villa Terrace | HX4 0AU |
| Woodside | HX4 0AB |
Transport near Ryburn
- FAQ
- Price Paid By Year
- Property Type Price
Frequently asked questions about Ryburn
What is the average price for a property for sale in Ryburn?
The average price for a property for sale in Ryburn is £389,476. This amount is 103% higher than the average price in Halifax. There are 195 property listings for sale in Ryburn.
What streets have the most expensive properties for sale in Ryburn?
The streets with the most expensive properties for sale in Ryburn are Branch Road at an average of £1,097,260, Sandyfoot at an average of £669,000 and Greetland Road at an average of £617,500.
What streets have the most affordable properties for sale in Ryburn?
The streets with the most affordable properties for sale in Ryburn are Chapel Terrace at an average of £155,000, North View at an average of £165,000 and Krumlin Hall Cottages at an average of £197,500.
Which train stations are available in or near Ryburn?
Some of the train stations available in or near Ryburn are Sowerby Bridge, Slaithwaite and Halifax.
Property Price Paid in Ryburn by Year
The average sold property price by year was:
| Year | Average Sold Price | Price Change |
Sold Properties
|
|---|---|---|---|
| 2025 | £375,306 | 13% |
18 Properties |
| 2024 | £326,607 | -34% |
14 Properties |
| 2023 | £438,834 | 2% |
23 Properties |
| 2022 | £429,789 | 30% |
19 Properties |
| 2021 | £300,282 | -15% |
29 Properties |
| 2020 | £343,928 | -12% |
14 Properties |
| 2019 | £384,068 | 31% |
22 Properties |
| 2018 | £264,466 | -26% |
25 Properties |
| 2017 | £332,997 | 0,3% |
18 Properties |
| 2016 | £332,072 | 8% |
22 Properties |
| 2015 | £306,908 | 15% |
28 Properties |
| 2014 | £260,965 | 5% |
29 Properties |
| 2013 | £247,323 | -5% |
17 Properties |
| 2012 | £259,500 | -11% |
16 Properties |
| 2011 | £289,289 | -2% |
24 Properties |
| 2010 | £293,975 | 8% |
20 Properties |
| 2009 | £271,600 | -1% |
15 Properties |
| 2008 | £273,704 | -9% |
12 Properties |
| 2007 | £299,243 | 9% |
32 Properties |
| 2006 | £272,916 | 12% |
30 Properties |
| 2005 | £239,301 | 21% |
31 Properties |
| 2004 | £188,720 | -4% |
34 Properties |
| 2003 | £196,783 | 23% |
37 Properties |
| 2002 | £151,889 | 22% |
36 Properties |
| 2001 | £119,213 | 4% |
38 Properties |
| 2000 | £113,986 | 4% |
41 Properties |
| 1999 | £109,293 | 13% |
29 Properties |
| 1998 | £94,862 | -13% |
26 Properties |
| 1997 | £106,855 | 25% |
41 Properties |
| 1996 | £80,002 | 8% |
58 Properties |
| 1995 | £73,465 | - |
60 Properties |
Property Price per Property Type in Ryburn
Here you can find historic sold price data in order to help with your property search.
The average Property Paid Price for specific property types in the last three years are:
| Property Type | Average Sold Price | Sold Properties |
|---|---|---|
| Semi Detached House | £405,178.00 | 7 Semi Detached Houses |
| Detached House | £537,089.00 | 22 Detached Houses |
| Terraced House | £268,700.00 | 20 Terraced Houses |
| Flat | £232,500.00 | 6 Flats |

