
Houses for sale & to rent in Ryburn, Huddersfield
House Prices in Ryburn
Properties in Ryburn have no sales history available within the last 3 years.
Ryburn is an area in Huddersfield, Calderdale with 28 households².
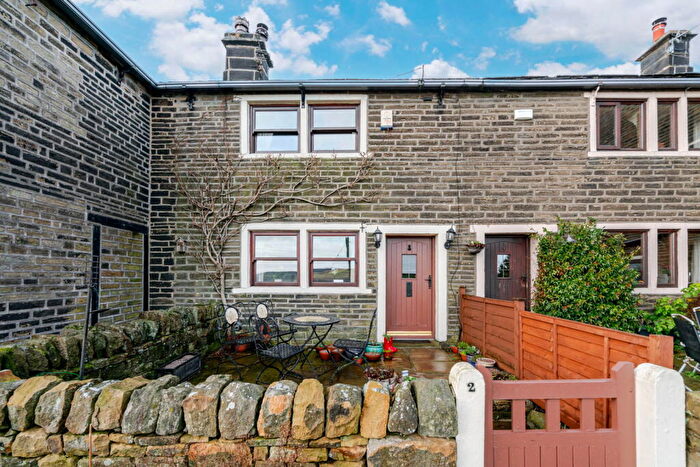
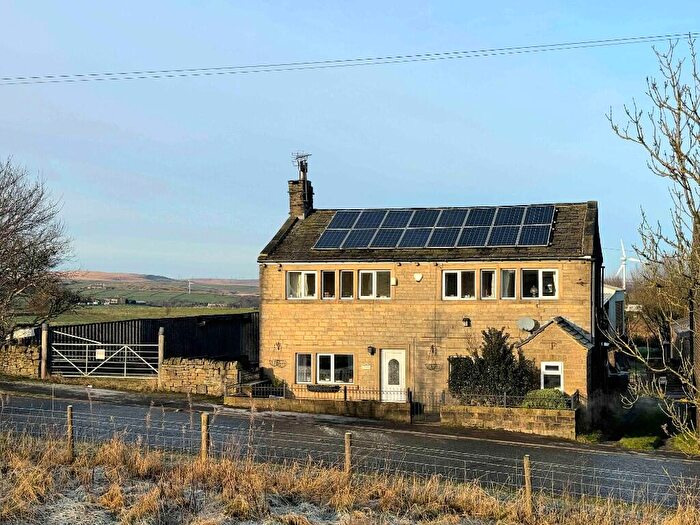
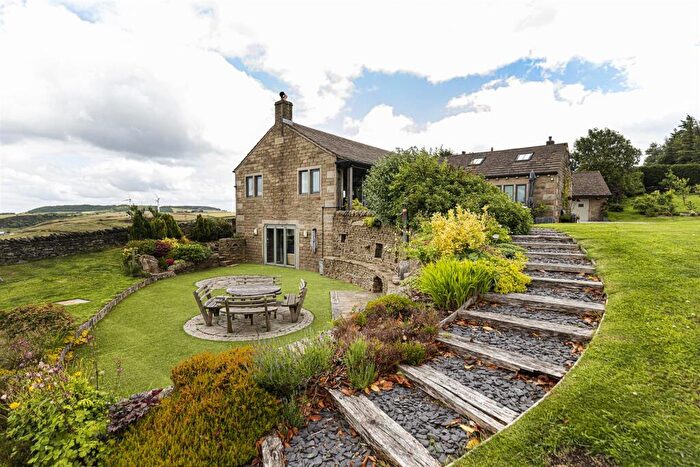
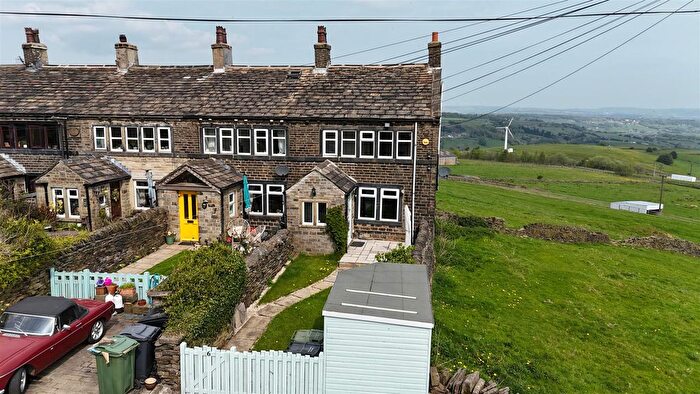
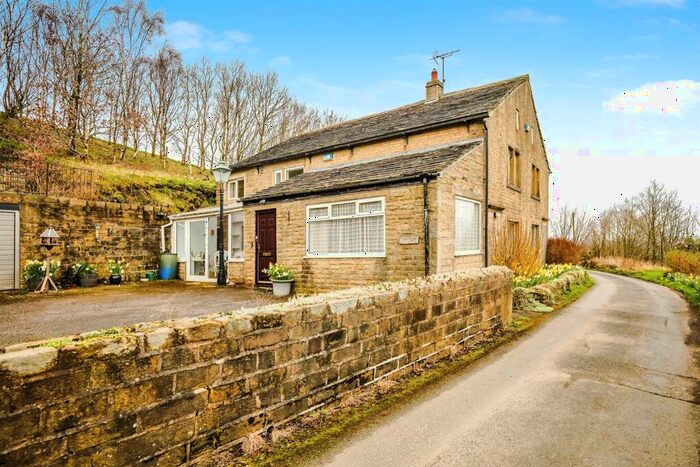
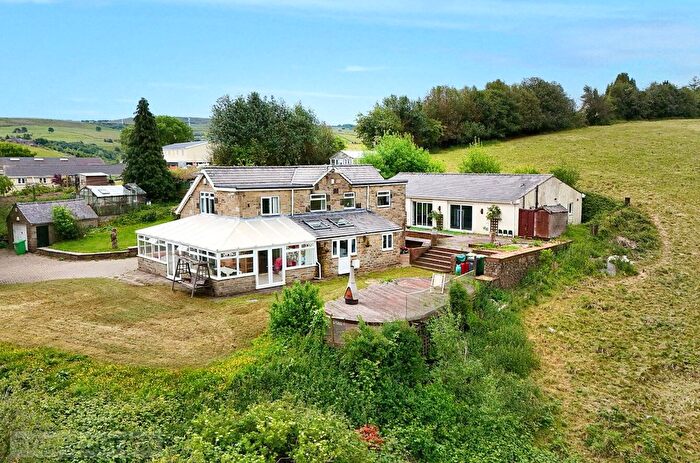
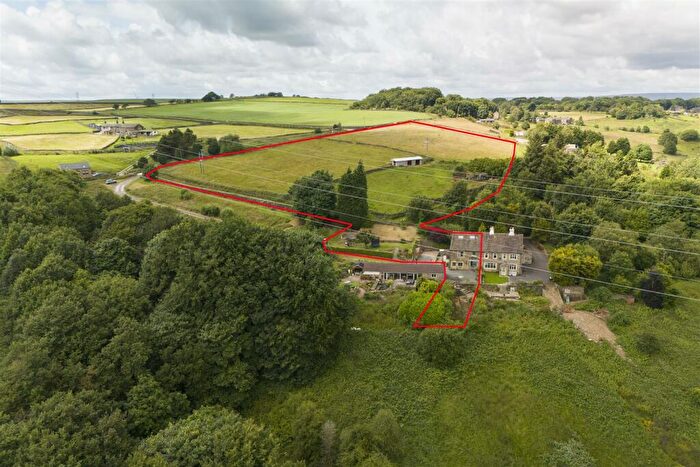
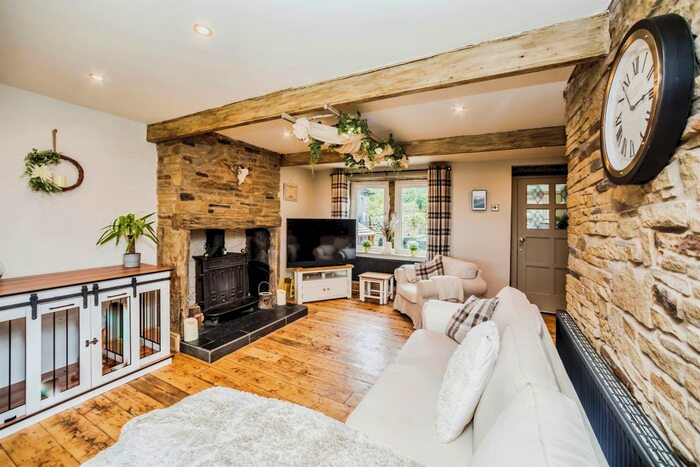
Properties for sale in Ryburn
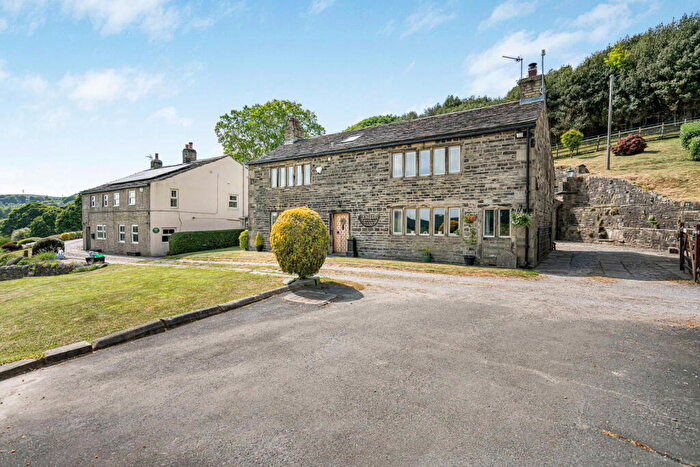
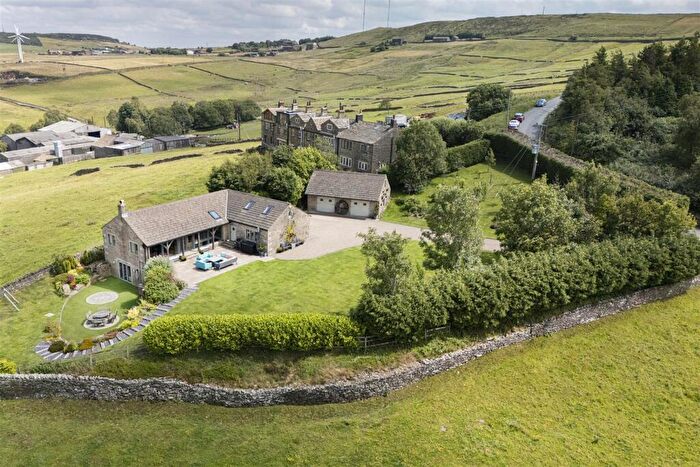
![]()
If you are looking to sell your house, let it out, or receive a property valuation, an expert can help you.
Click the button below to get started.
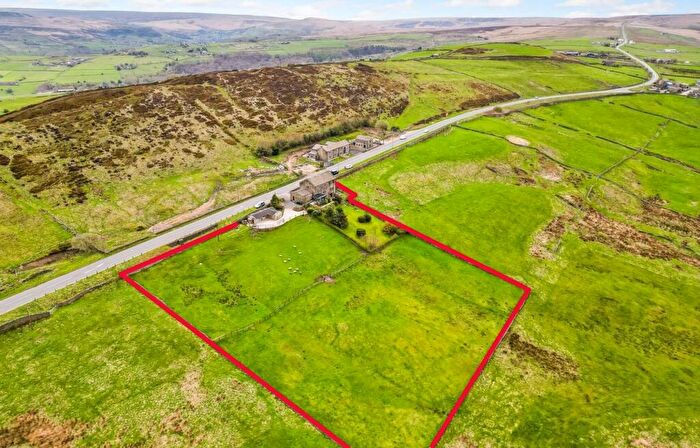
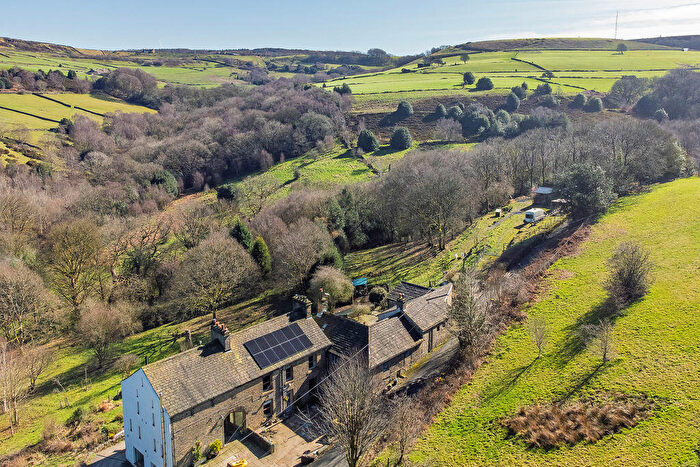
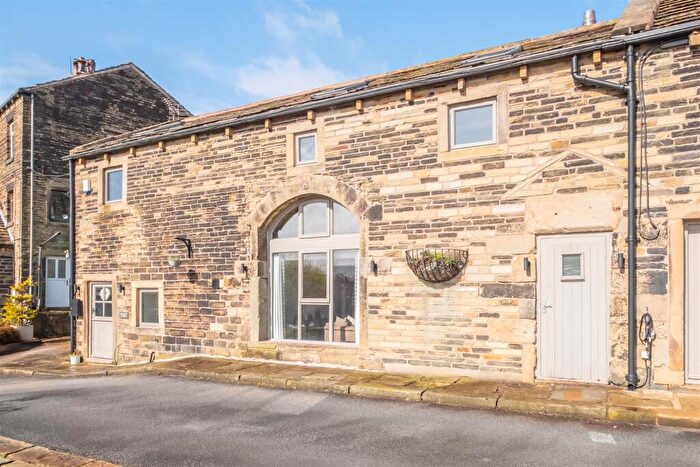
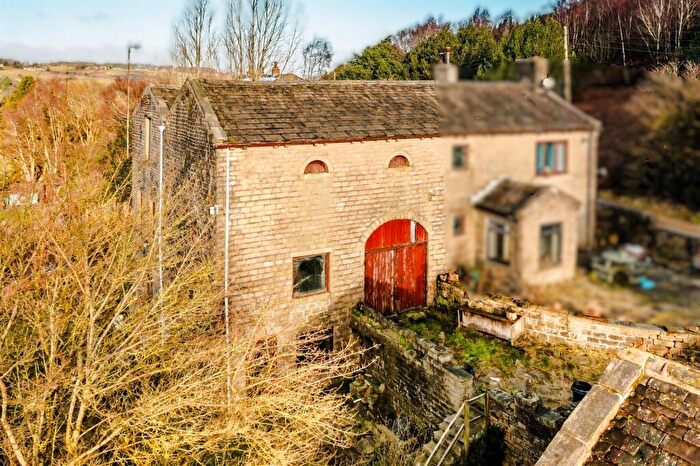
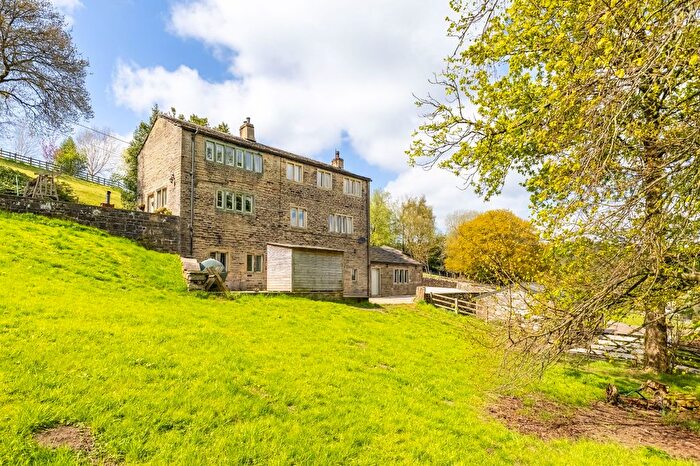
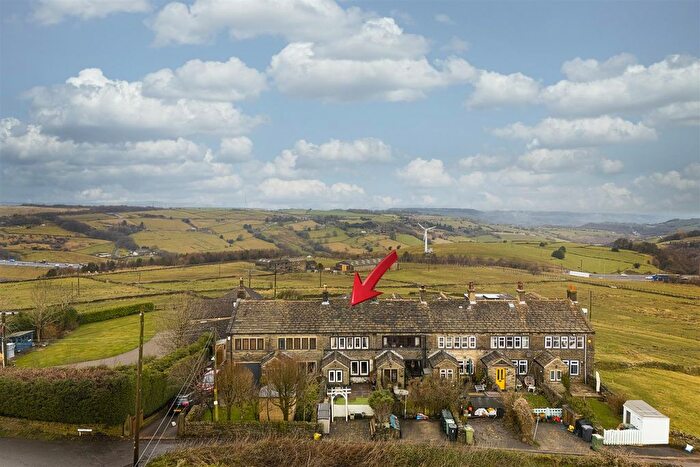
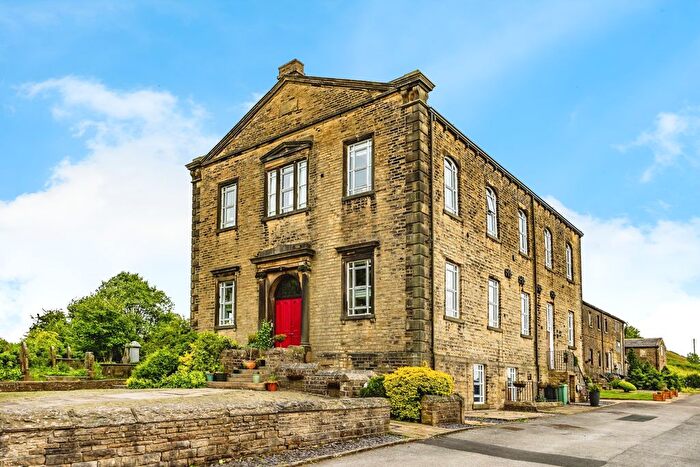
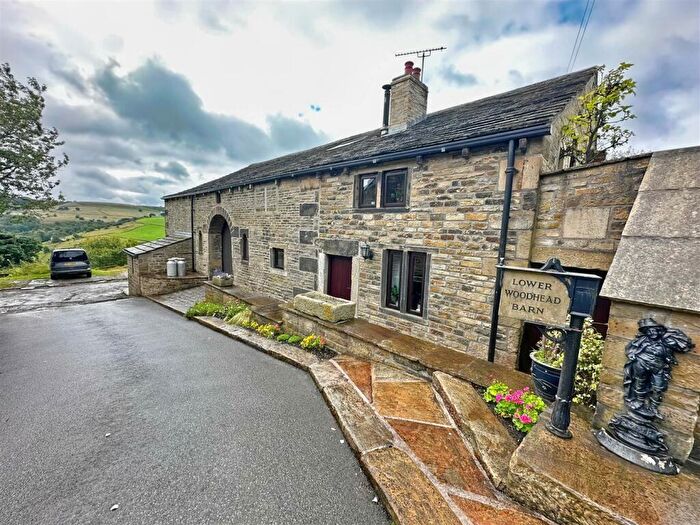
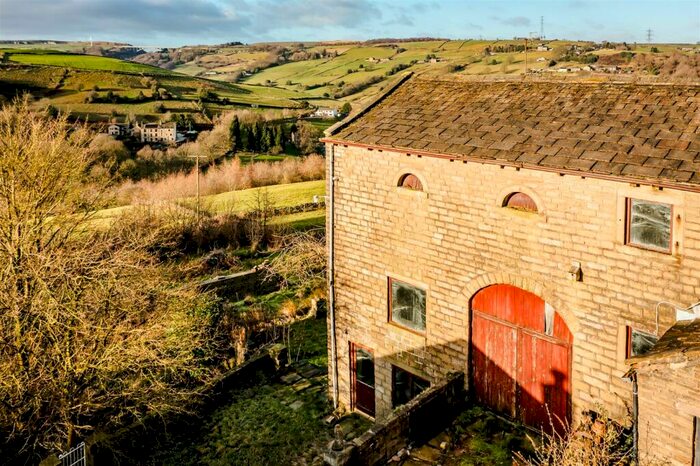
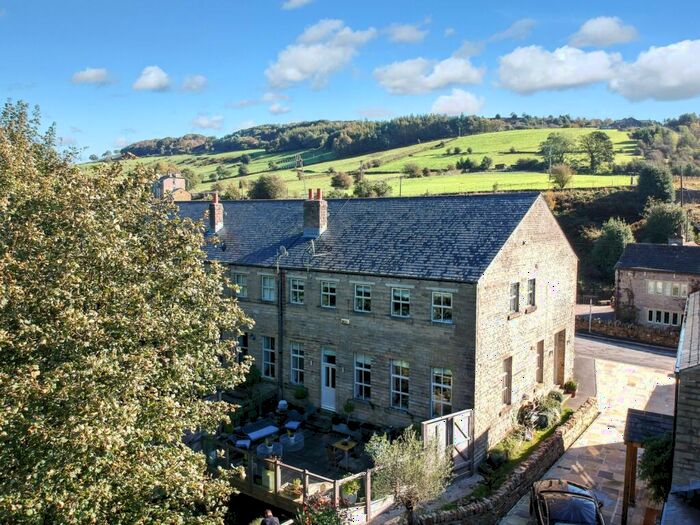
Previously listed properties in Ryburn


![]()
If you are looking to sell your house, let it out, or receive a property valuation, an expert can help you.
Click the button below to get started.

Roads and Postcodes in Ryburn
Navigate through our locations to find the location of your next house in Ryburn, Huddersfield for sale or to rent.
Transport near Ryburn

- FAQ
- Price Paid By Year
Frequently asked questions about Ryburn
Which train stations are available in or near Ryburn?
Some of the train stations available in or near Ryburn are Slaithwaite, Marsden and Sowerby Bridge.
Property Price Paid in Ryburn by Year
The average sold property price by year was:
| Year | Average Sold Price | Price Change |
Sold Properties
|
|---|---|---|---|
| 2022 | £285,000 | -37% |
1 Property |
| 2021 | £390,000 | -7% |
1 Property |
| 2019 | £415,565 | -88% |
3 Properties |
| 2017 | £780,000 | 54% |
1 Property |
| 2016 | £360,000 | 56% |
1 Property |
| 2014 | £160,000 | -80% |
1 Property |
| 2012 | £287,500 | -70% |
1 Property |
| 2011 | £490,000 | 15% |
1 Property |
| 2010 | £415,000 | 13% |
1 Property |
| 2009 | £361,375 | 6% |
2 Properties |
| 2007 | £340,000 | -10% |
1 Property |
| 2006 | £375,000 | 65% |
1 Property |
| 2003 | £132,000 | -46% |
1 Property |
| 2002 | £193,250 | 19% |
2 Properties |
| 2000 | £156,875 | -21% |
2 Properties |
| 1999 | £190,000 | 53% |
1 Property |
| 1995 | £90,000 | - |
1 Property |