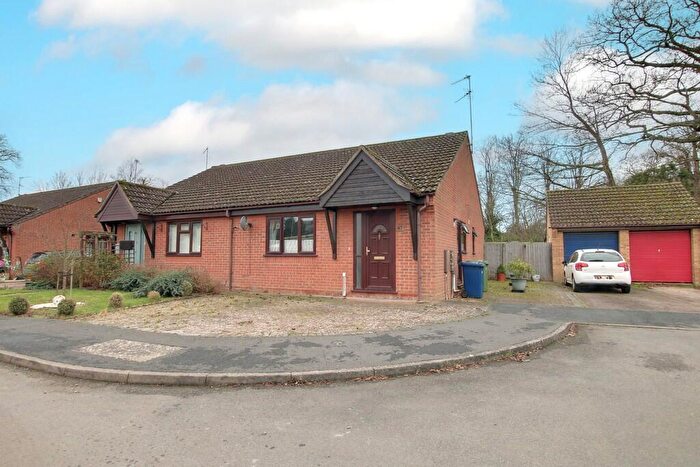
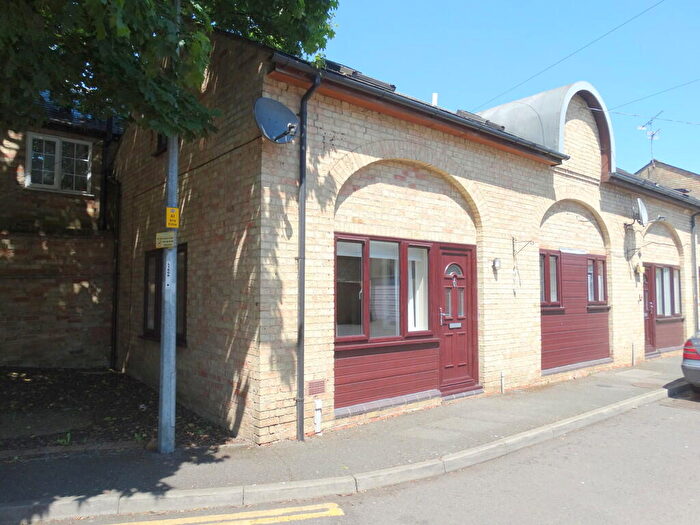
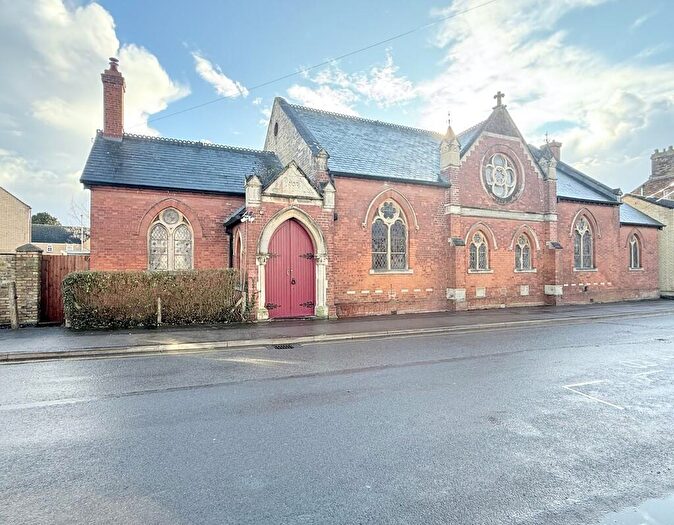
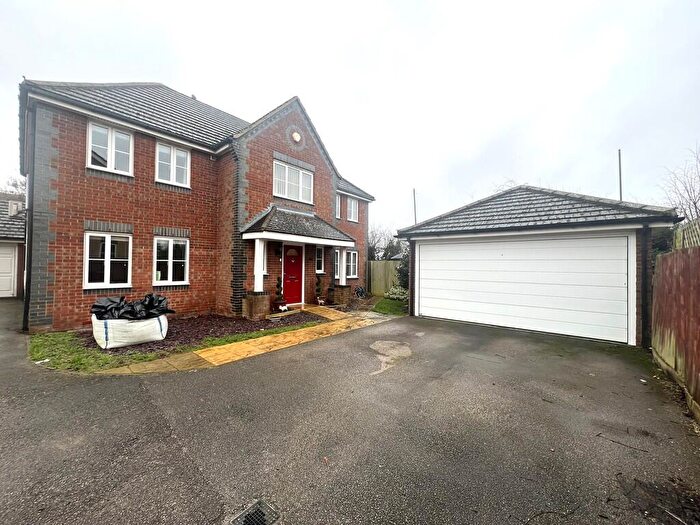
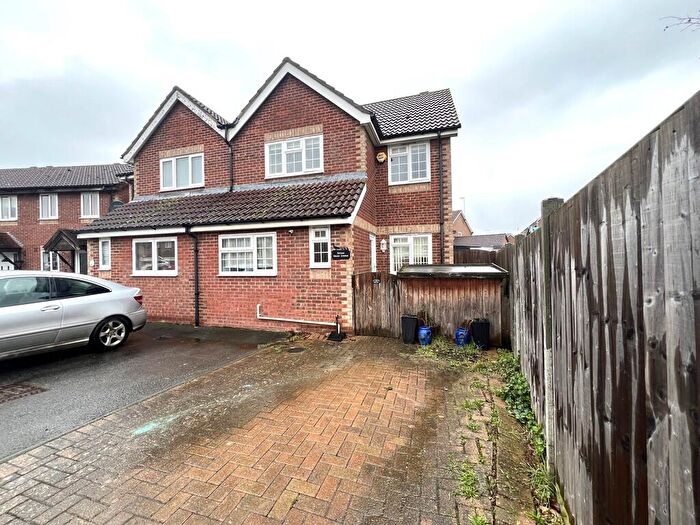
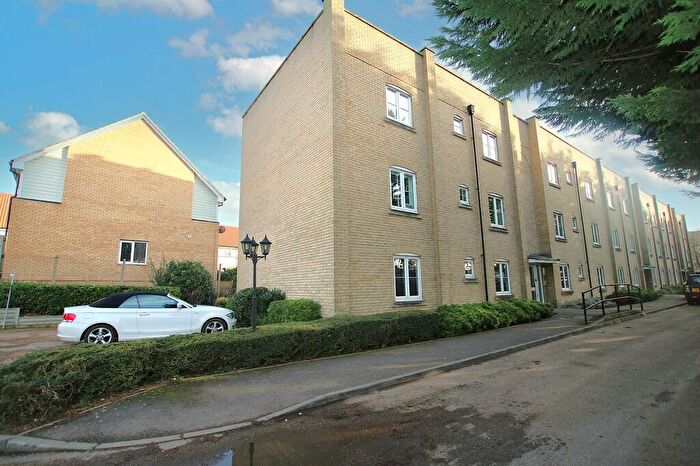
Houses for sale & to rent in Wenneye, Chatteris
House Prices in Wenneye
Properties in Wenneye have an average house price of £280,641.00 and had 98 Property Transactions within the last 3 years¹.
Wenneye is an area in Chatteris, Cambridgeshire with 988 households², where the most expensive property was sold for £665,000.00.
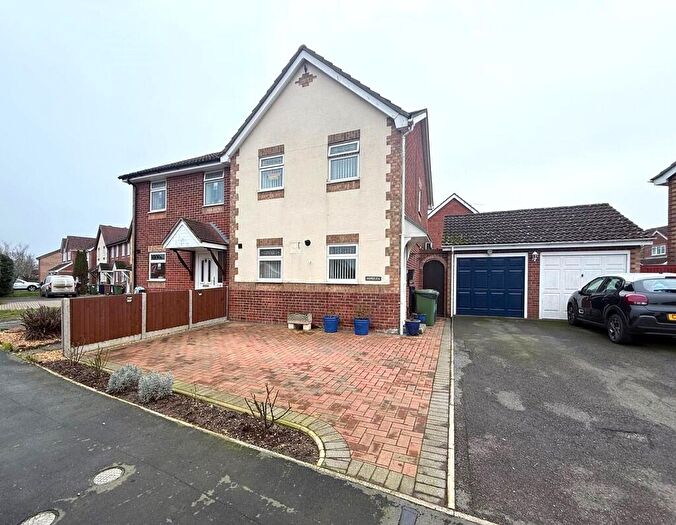
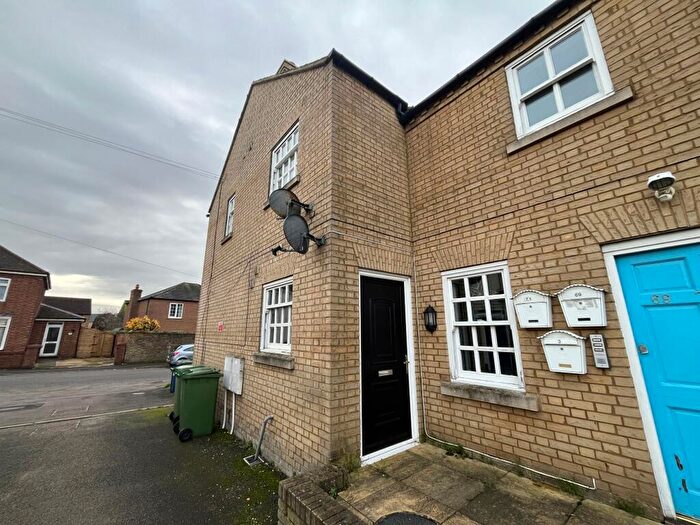
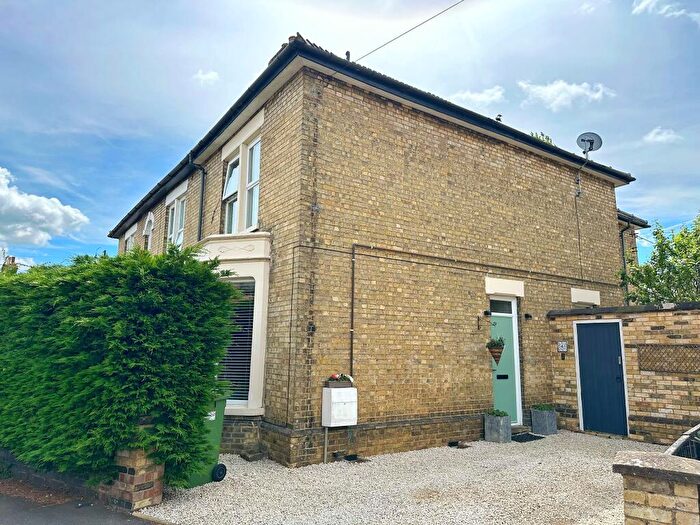
Properties for sale in Wenneye
Roads and Postcodes in Wenneye
Navigate through our locations to find the location of your next house in Wenneye, Chatteris for sale or to rent.
| Streets | Postcodes |
|---|---|
| Allens Yard | PE16 6QE |
| Belmont Gardens | PE16 6LX |
| Boadicea Court | PE16 6BN |
| Boxing Boys Mews | PE16 6FE |
| Briar Close | PE16 6HS |
| Church Lane | PE16 6JA |
| Church Walk | PE16 6JD |
| Cricketers Way | PE16 6UR |
| East Park Street | PE16 6LA PE16 6LD PE16 6LH PE16 6LQ |
| Eastbourne Close | PE16 6RY |
| Eastbourne Road | PE16 6SP PE16 6TE |
| Eastwood | PE16 6RU PE16 6RX |
| Elder Place | PE16 6HT |
| Ellingham Gardens | PE16 6WB |
| Halsbury Court | PE16 6HB |
| Hazel Close | PE16 6HX |
| High Street | PE16 6BE PE16 6BG PE16 6BH PE16 6BQ |
| Hilda Clarke Close | PE16 6TH |
| Honey Lane | PE16 6LG |
| Horsegate Gardens | PE16 6NH |
| Joshua Close | PE16 6QU |
| Juniper Drive | PE16 6HY |
| King Edward Road | PE16 6NG |
| London Road | PE16 6LS PE16 6LT PE16 6SG PE16 6SE |
| Manor Gardens | PE16 6XR |
| Marian Way | PE16 6LZ |
| Market Hill | PE16 6BB PE16 6BA |
| Megans Way | PE16 6JS |
| Old Forge Gardens | PE16 6QR |
| Old School Drive | PE16 6JX |
| Palmers Walk | PE16 6EY |
| Park Street | PE16 6AB PE16 6AD PE16 6AE PE16 6AF PE16 6AA |
| Parkside | PE16 6XS |
| Railway Lane | PE16 6NE PE16 6NF PE16 6NZ |
| Ronalds Way | PE16 6LY |
| Ruston Court | PE16 6GT |
| South Park Street | PE16 6AR |
| St James Close | PE16 6FJ |
| St Martins Road | PE16 6JB |
| Station Street | PE16 6NA |
| Stocking Drove | PE16 6SH |
| The Hawthorns | PE16 6NQ |
| The Shrubbery | PE16 6JE |
| Tithe Road | PE16 6SL PE16 6SN |
| Tribune Close | PE16 6UY |
| Vicarage Close | PE16 6JG |
| Victoria Street | PE16 6AP |
| Wenny Court | PE16 6XT |
| Wenny Estate | PE16 6UX |
| Wenny Road | PE16 6UT PE16 6UU |
| Wood Street | PE16 6LJ PE16 6LN |
| Woodside | PE16 6LL |
| PE16 6FN PE16 9AF PE16 9AT PE16 9AX PE16 9BB |
Transport near Wenneye
- FAQ
- Price Paid By Year
- Property Type Price
Frequently asked questions about Wenneye
What is the average price for a property for sale in Wenneye?
The average price for a property for sale in Wenneye is £280,641. This amount is 18% higher than the average price in Chatteris. There are 516 property listings for sale in Wenneye.
What streets have the most expensive properties for sale in Wenneye?
The streets with the most expensive properties for sale in Wenneye are St Martins Road at an average of £464,250, Boadicea Court at an average of £430,000 and Elder Place at an average of £412,500.
What streets have the most affordable properties for sale in Wenneye?
The streets with the most affordable properties for sale in Wenneye are Hazel Close at an average of £95,000, High Street at an average of £151,833 and Joshua Close at an average of £170,000.
Which train stations are available in or near Wenneye?
Some of the train stations available in or near Wenneye are Manea, March and Whittlesea.
Property Price Paid in Wenneye by Year
The average sold property price by year was:
| Year | Average Sold Price | Price Change |
Sold Properties
|
|---|---|---|---|
| 2025 | £285,485 | -0,1% |
34 Properties |
| 2024 | £285,730 | 5% |
30 Properties |
| 2023 | £271,308 | -4% |
34 Properties |
| 2022 | £280,983 | 10% |
53 Properties |
| 2021 | £251,561 | 16% |
68 Properties |
| 2020 | £212,216 | -34% |
30 Properties |
| 2019 | £283,767 | 21% |
28 Properties |
| 2018 | £225,205 | 8% |
39 Properties |
| 2017 | £206,824 | 1% |
40 Properties |
| 2016 | £203,958 | 9% |
64 Properties |
| 2015 | £185,918 | 10% |
43 Properties |
| 2014 | £166,817 | 0,1% |
63 Properties |
| 2013 | £166,576 | -1% |
50 Properties |
| 2012 | £168,250 | 0,3% |
31 Properties |
| 2011 | £167,719 | 8% |
33 Properties |
| 2010 | £154,470 | 4% |
34 Properties |
| 2009 | £148,985 | -24% |
41 Properties |
| 2008 | £184,499 | -4% |
25 Properties |
| 2007 | £191,898 | 14% |
67 Properties |
| 2006 | £164,327 | -8% |
64 Properties |
| 2005 | £178,025 | 2% |
54 Properties |
| 2004 | £174,043 | 8% |
85 Properties |
| 2003 | £160,314 | 16% |
82 Properties |
| 2002 | £134,797 | 38% |
94 Properties |
| 2001 | £83,718 | 7% |
45 Properties |
| 2000 | £77,828 | 7% |
42 Properties |
| 1999 | £72,398 | 10% |
55 Properties |
| 1998 | £65,290 | 12% |
43 Properties |
| 1997 | £57,622 | 5% |
36 Properties |
| 1996 | £54,906 | -2% |
30 Properties |
| 1995 | £56,037 | - |
28 Properties |
Property Price per Property Type in Wenneye
Here you can find historic sold price data in order to help with your property search.
The average Property Paid Price for specific property types in the last three years are:
| Property Type | Average Sold Price | Sold Properties |
|---|---|---|
| Semi Detached House | £227,343.00 | 37 Semi Detached Houses |
| Detached House | £355,113.00 | 46 Detached Houses |
| Terraced House | £202,800.00 | 10 Terraced Houses |
| Flat | £145,600.00 | 5 Flats |

