
Houses for sale in Cambridgeshire, England
House Prices in Cambridgeshire
Properties in Cambridgeshire have
an average house price of
£395k
and had 26,862 Property Transactions
within the last 3 years.¹
Cambridgeshire is a location in
England with
279,319 households², where the most expensive property was sold for £5.5M.
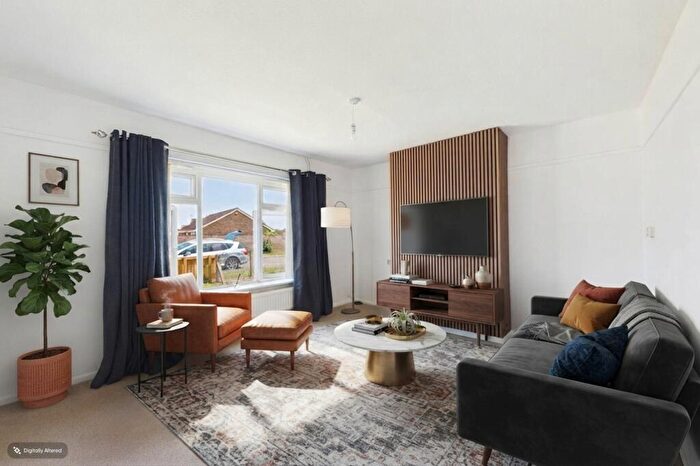
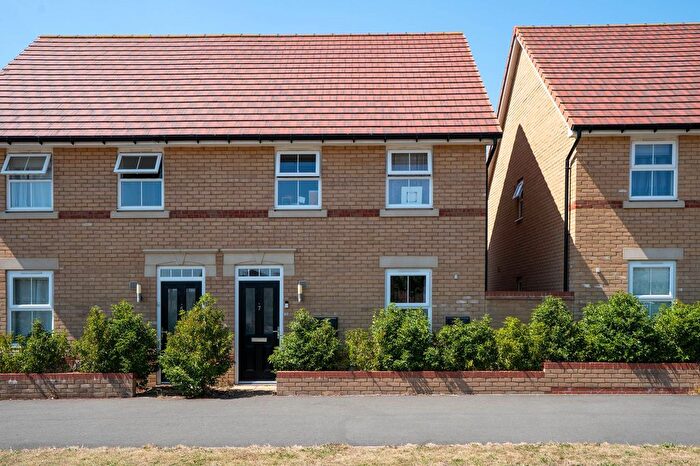
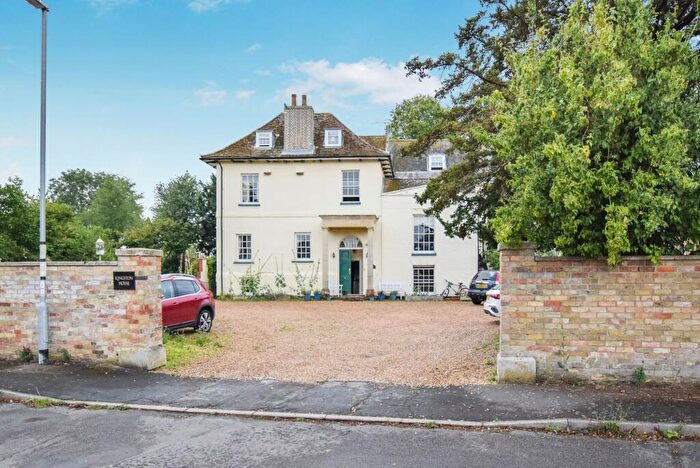
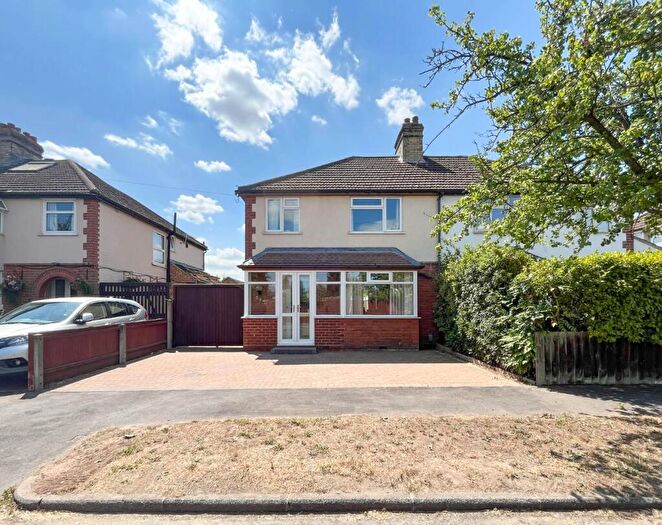
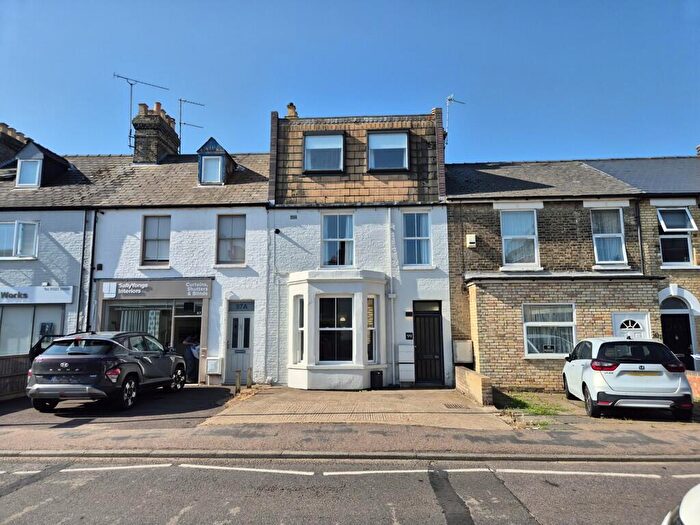
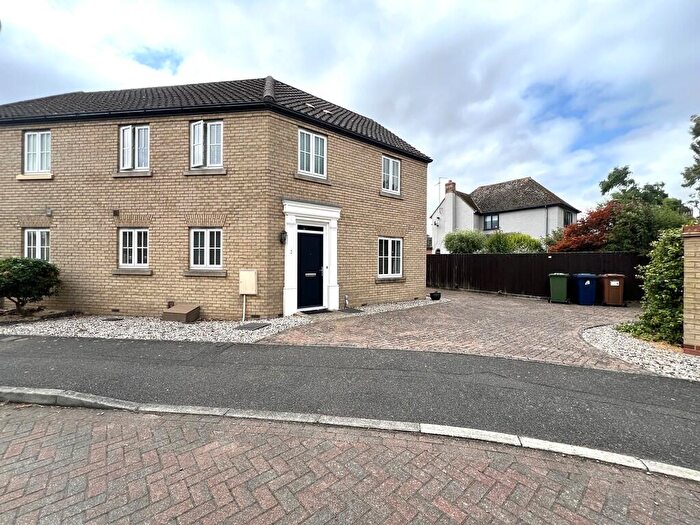
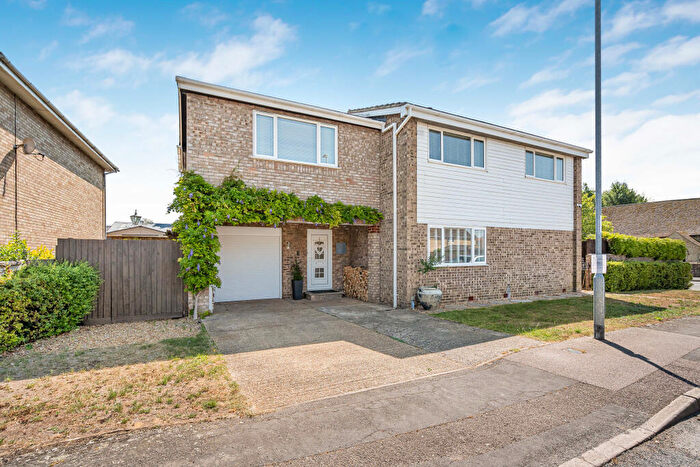
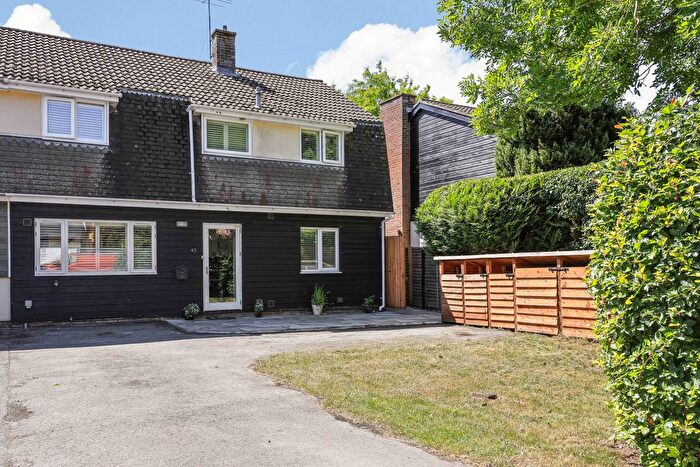
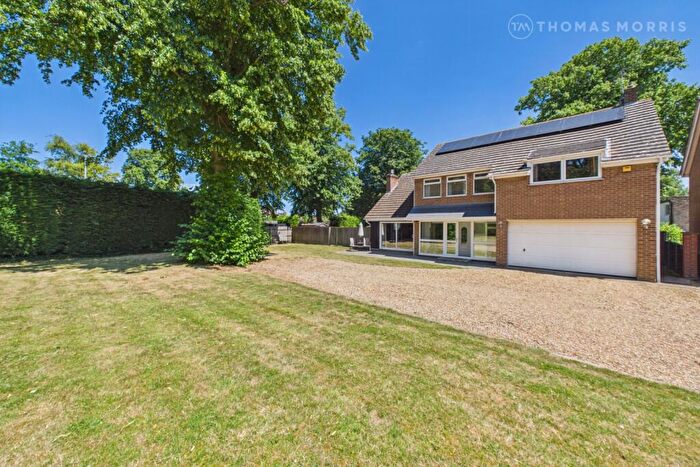
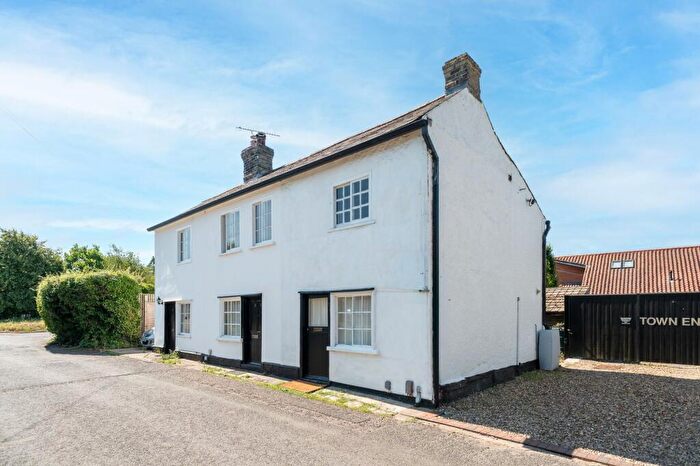
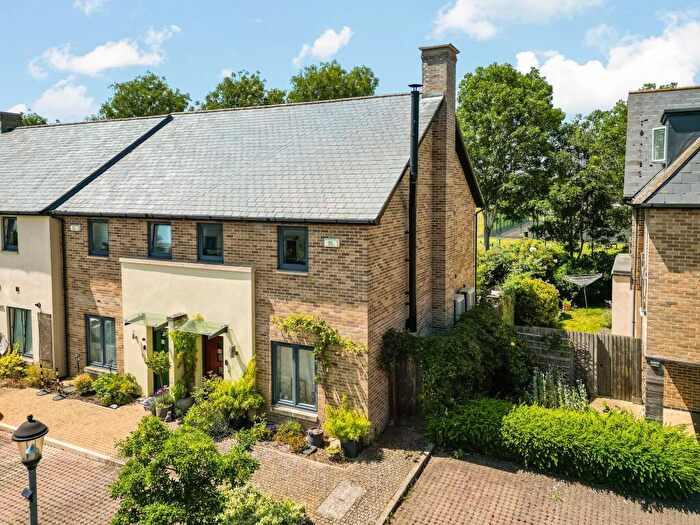
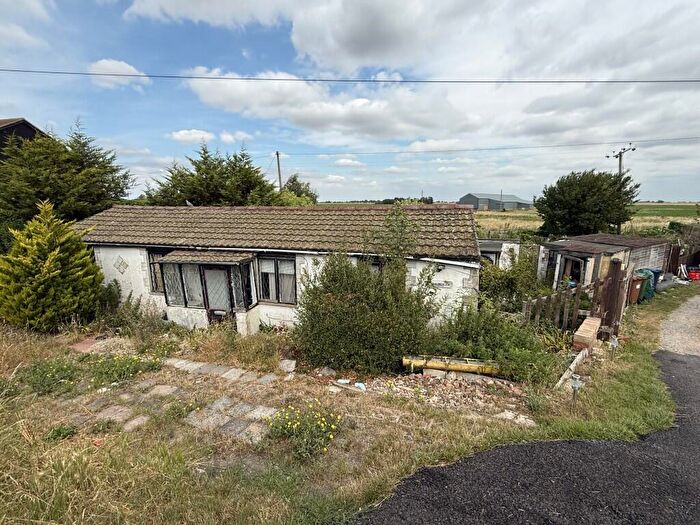
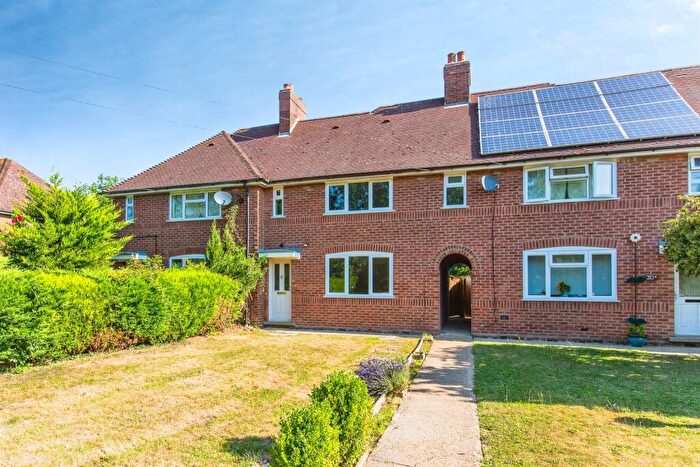
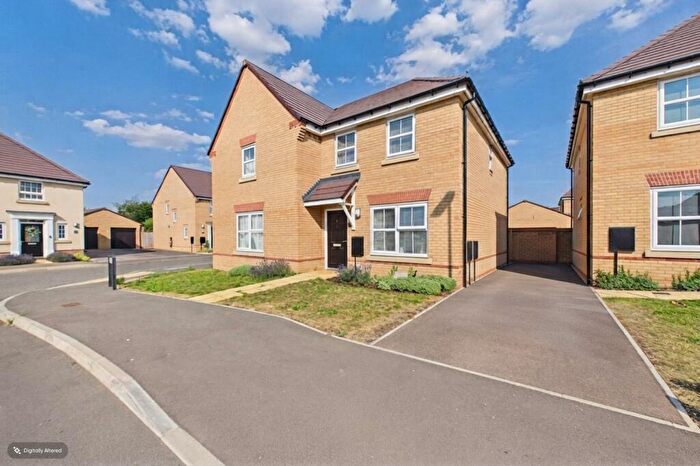
Properties for sale in Cambridgeshire
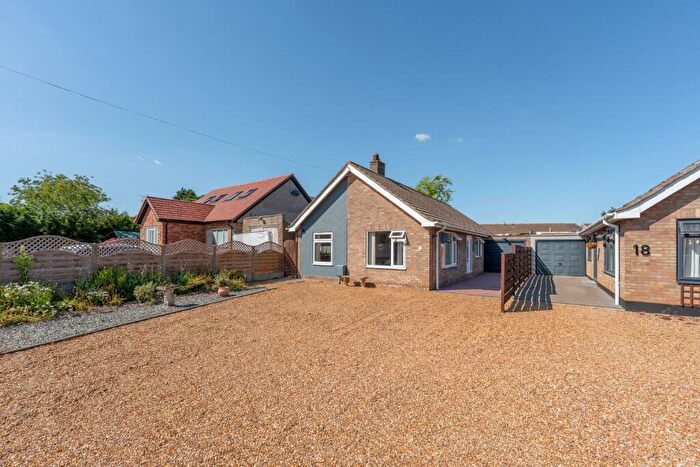
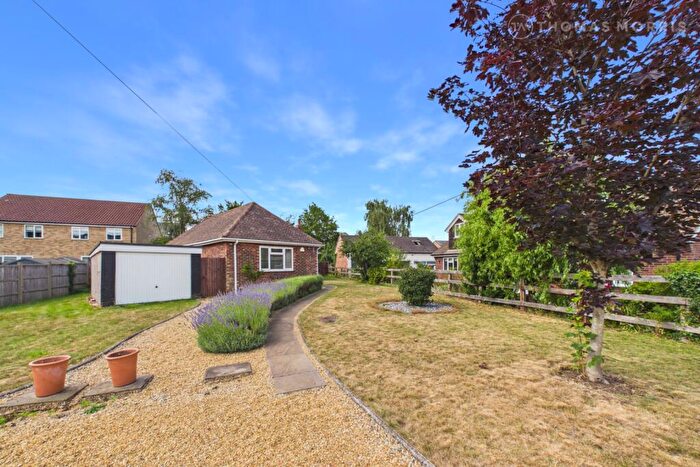
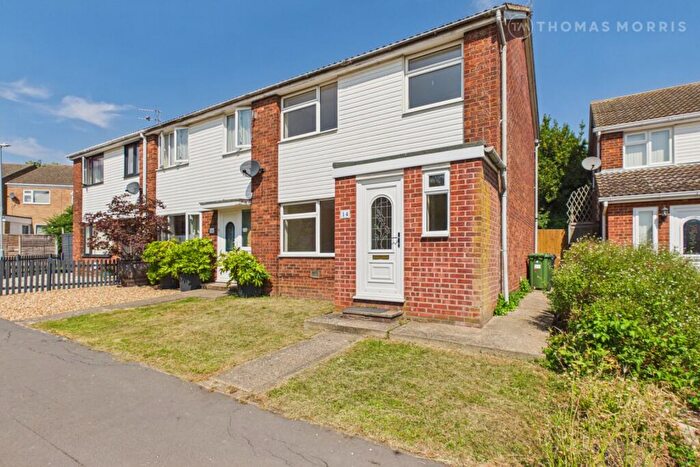
![]()
If you are looking to sell your house, let it out, or receive a property valuation, an expert can help you.
Click the button below to get started.

Towns in Cambridgeshire
Navigate through our locations to find the location of your next house in Cambridgeshire, England for sale or to rent.
Property price trends in Cambridgeshire
According to the latest Land Registry data, the average home in Cambridgeshire sold for £376,215 in 2026. That figure comes from a substantial record of 355,804 sales logged over the past 31 years.
Prices have softened over the last three years. Compared with 2023, when the typical sale came in around £395,572, that's a fall of roughly 4.9%.
Looking back five years, average prices are up about 2.5% since 2021, a gain of around £9,100 in cash terms.
Zoom out to the past decade for the fuller picture. Back in 2016, homes here averaged £314,623, so the typical sold price has climbed about 19.6% since then, roughly 1.8% a year. Stretch the view to fifteen years and that annual pace edges up closer to 3.2%.
Frequently asked questions about Cambridgeshire
What is the average price for a property for sale in Cambridgeshire?
The average price for a property for sale in Cambridgeshire is £394,706. This amount is 10% higher than the average price in England. There are more than 10,000 property listings for sale in Cambridgeshire.
What locations have the most expensive properties for sale in Cambridgeshire?
The locations with the most expensive properties for sale in Cambridgeshire are Stamford at an average of £659,166, Saffron Walden at an average of £601,315 and Royston at an average of £522,775.
What locations have the most affordable properties for sale in Cambridgeshire?
The locations with the most affordable properties for sale in Cambridgeshire are Wisbech at an average of £224,679, Chatteris at an average of £238,454 and March at an average of £254,327.
Which train stations are available in or near Cambridgeshire?
Some of the train stations available in or near Cambridgeshire are Waterbeach, Cambridge North and Huntingdon.
Property Price Paid in Cambridgeshire by Year
The average sold property price by year was:
| Year | Average Sold Price | Price Change |
Sold Properties
|
|---|---|---|---|
| 2026 | £376,215 | -5% |
1,599 Properties |
| 2025 | £396,207 | 0,1% |
8,870 Properties |
| 2024 | £395,814 | 0,1% |
8,524 Properties |
| 2023 | £395,572 | -1% |
7,869 Properties |
| 2022 | £398,242 | 8% |
10,209 Properties |
| 2021 | £367,115 | 3% |
13,290 Properties |
| 2020 | £356,781 | 3% |
9,190 Properties |
| 2019 | £346,353 | 3% |
10,536 Properties |
| 2018 | £335,554 | -0,4% |
10,840 Properties |
| 2017 | £337,057 | 7% |
11,285 Properties |
Property Price per Property Type in Cambridgeshire
Here you can find historic sold price data in order to help with your property search.
The average Property Paid Price for specific property types in the last three years are:
| Property Type | Average Sold Price | Sold Properties |
|---|---|---|
| Semi Detached House | £355,695.00 | 7,492 Semi Detached Houses |
| Terraced House | £336,783.00 | 6,875 Terraced Houses |
| Detached House | £514,457.00 | 9,498 Detached Houses |
| Flat | £245,587.00 | 2,997 Flats |
Transport in Cambridgeshire
Please see below transportation links in this area:
