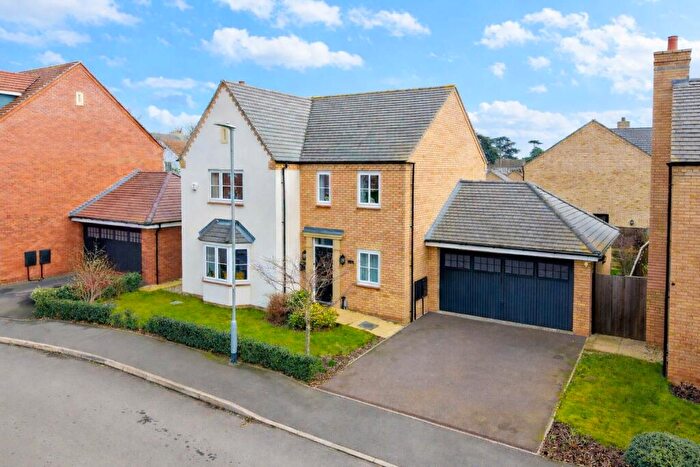
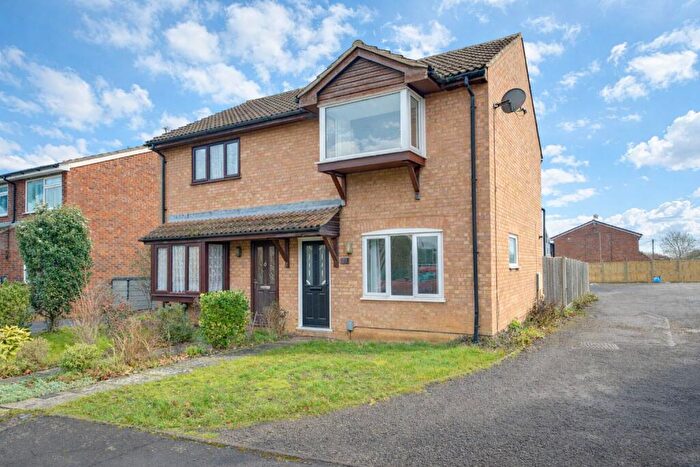
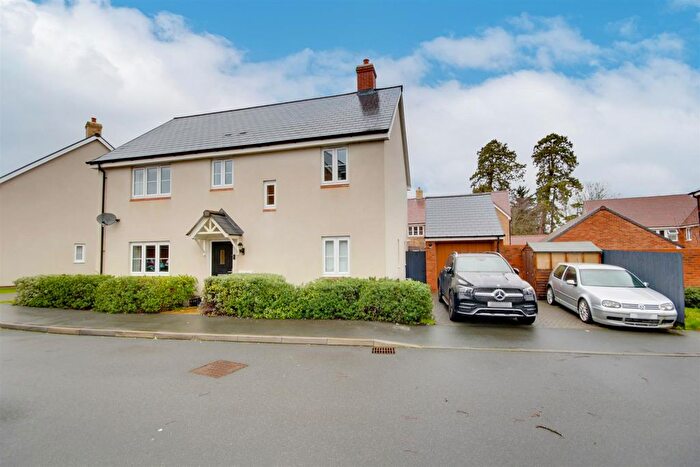
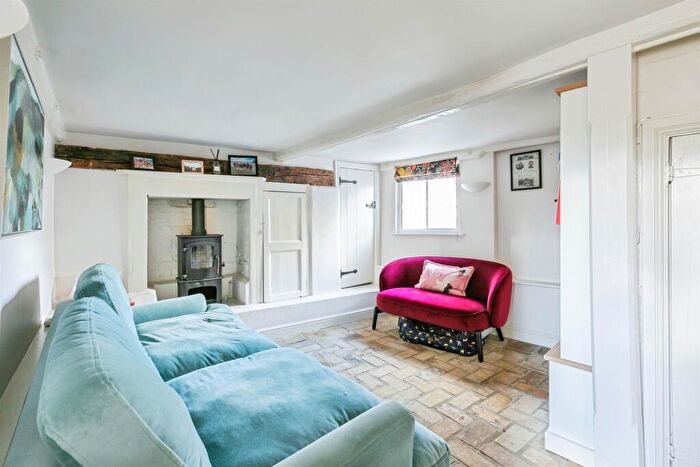
Houses for sale & to rent in Fenstanton, Huntingdon
House Prices in Fenstanton
Properties in Fenstanton have an average house price of £374,674.00 and had 107 Property Transactions within the last 3 years¹.
Fenstanton is an area in Huntingdon, Cambridgeshire with 1,121 households², where the most expensive property was sold for £820,000.00.
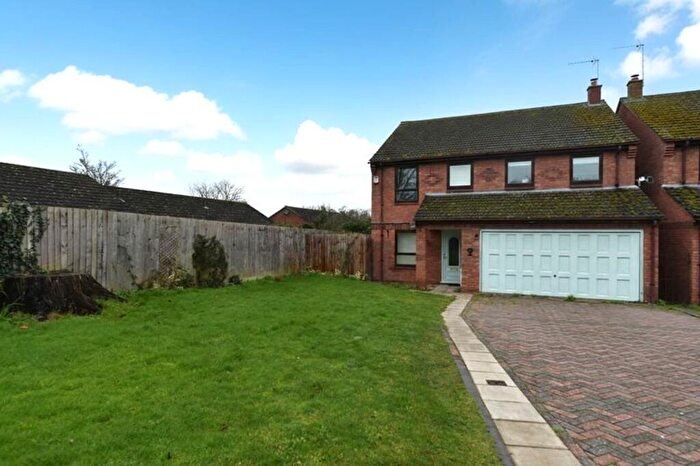
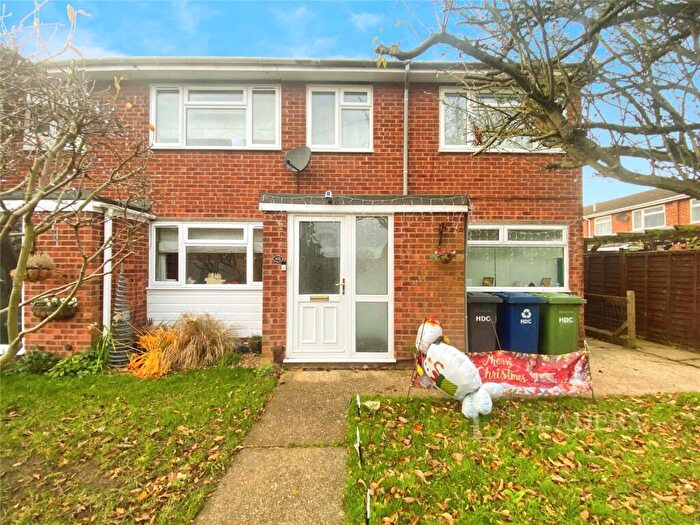
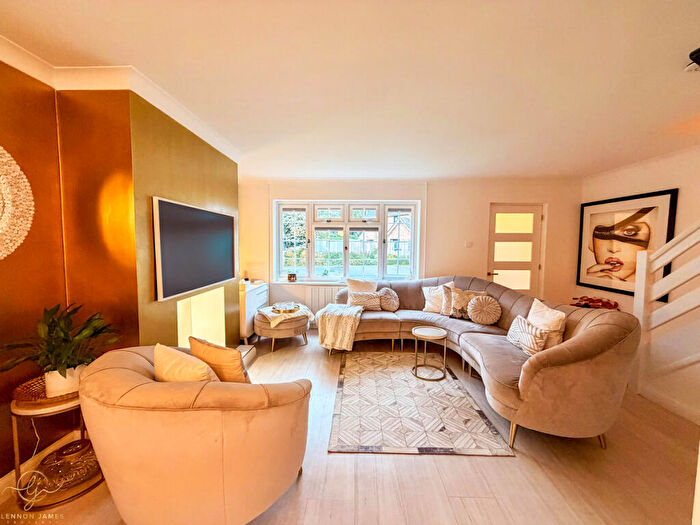
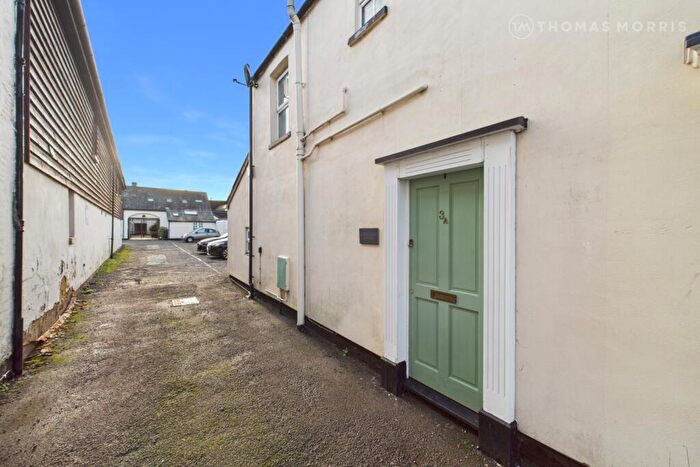
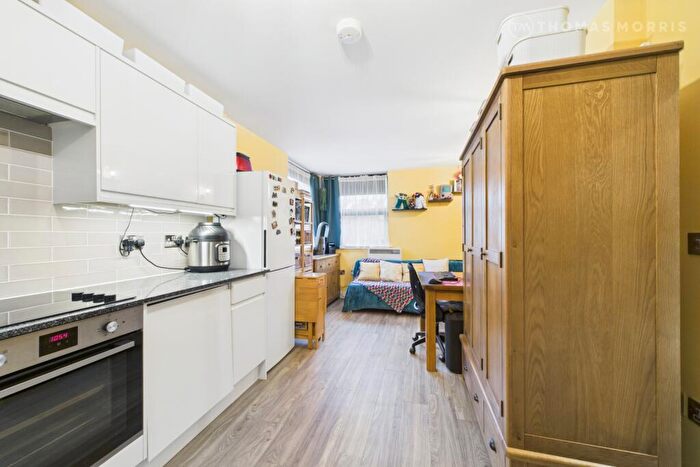
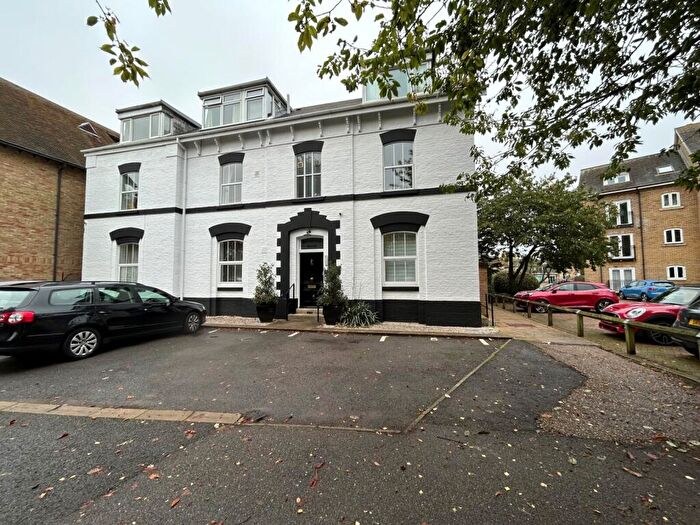
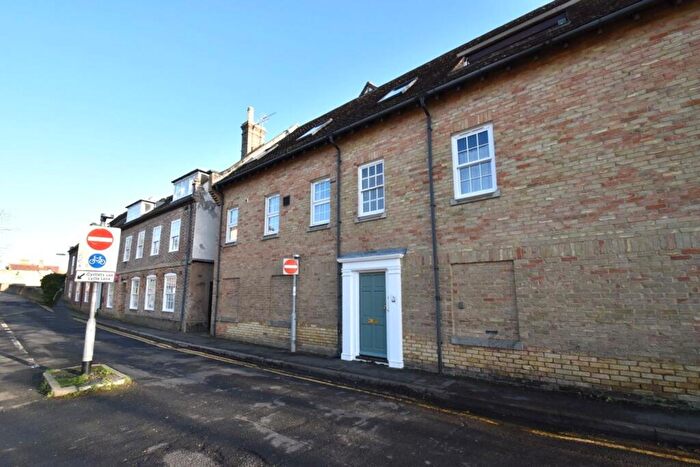
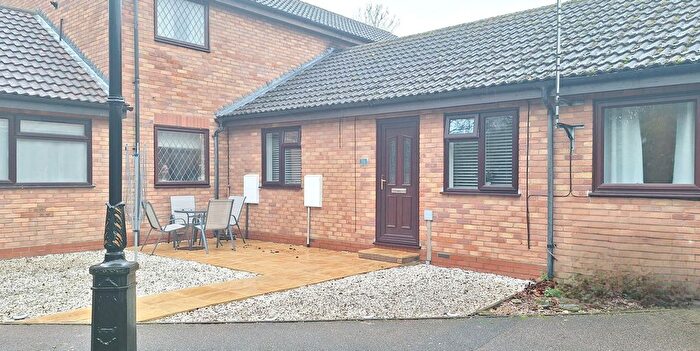
Properties for sale in Fenstanton
Roads and Postcodes in Fenstanton
Navigate through our locations to find the location of your next house in Fenstanton, Huntingdon for sale or to rent.
| Streets | Postcodes |
|---|---|
| Apple Tree Close | PE28 9FJ |
| Archer Terrace | PE28 9BD |
| Bell Lane | PE28 9JX |
| Bourdillon Close | PE28 9HW |
| Burgess Walk | PE28 9PL |
| Cambridge Road | PE28 9HS PE28 9HY PE28 9JB |
| Cedar Close | PE28 9AZ |
| Chequer Street | PE28 9JQ |
| Chequers Close | PE28 9QY |
| Chequers Court | PE28 9PZ |
| Cherry Tree Way | PE28 9JU |
| Church Farm Cottage | PE28 9JS |
| Church Lane | PE28 9JW |
| Church Leys | PE28 9QD |
| Church Street | PE28 9JL |
| Conington Road | PE28 9LB PE28 9HZ |
| Cranesbrook | PE28 9JN |
| Crest Drive | PE28 9BR |
| Dove Close | PE28 9LX |
| Fen Road | PE28 9JT |
| Fenstanton Road | PE28 9JA |
| Four Acres | PE28 9QF |
| Gardener Crescent | PE28 9PN |
| Hall Green Lane | PE28 9JH |
| Hampton Close | PE28 9HB |
| Headlands | PE28 9LN PE28 9LP PE28 9LW |
| High Street | PE28 9JZ PE28 9LA PE28 9LQ PE28 9JF |
| Hilton Court | PE28 9PY |
| Hilton Road | PE28 9LH PE28 9LJ PE28 9JE PE28 9QX |
| Honey Hill | PE28 9JP |
| Huntingdon Road | PE28 9JG |
| Lancelot Way | PE28 9LY |
| Leechcroft | PE28 9QH |
| Little Moor | PE28 9QE |
| Low Road | PE28 9HU PE28 9JD |
| Manor Drive | PE28 9QZ |
| Mooresbrook Close | PE28 9QL |
| Oaklands | PE28 9LS |
| Orchard Gardens | PE28 9JY |
| Park Close | PE28 9PH |
| Peartree Close | PE28 9LL |
| Pitfield Close | PE28 9FE |
| Potton Road | PE28 9NQ PE28 9QR |
| Rookery Place | PE28 9LZ |
| Rookery Way | PE28 9LU |
| Sallows | PE28 9QQ |
| School Lane | PE28 9JR |
| Scorney | PE28 9QG |
| Simmer Piece | PE28 9LT |
| Sparrow Way | PE28 9NZ |
| Swan Gardens | PE28 9LF |
| Swan Road | PE28 9LD |
| Talls Lane | PE28 9JJ |
| The Bumbles Church Lane | PE28 9HR |
| The Gables | PE28 9QP |
| Tythe Piece | PE28 9LR |
| Walnut Tree Crescent | PE28 9LE |
| West End Road | PE28 9HT |
| Willow Road | PE28 9RB PE28 9RD PE28 9RF |
| Wrights Way | PE28 9BF |
| PE28 9ET PE28 9RE |
Transport near Fenstanton
-
Huntingdon Station
-
St.Neots Station
-
Cambridge North Station
-
Cambridge Station
-
Waterbeach Station
-
Shepreth Station
-
Foxton Station
-
Shelford Station
-
Meldreth Station
-
Sandy Station
- FAQ
- Price Paid By Year
- Property Type Price
Frequently asked questions about Fenstanton
What is the average price for a property for sale in Fenstanton?
The average price for a property for sale in Fenstanton is £374,674. This amount is 10% higher than the average price in Huntingdon. There are 772 property listings for sale in Fenstanton.
What streets have the most expensive properties for sale in Fenstanton?
The streets with the most expensive properties for sale in Fenstanton are Hilton Road at an average of £775,000, Talls Lane at an average of £625,000 and Hilton Court at an average of £600,000.
What streets have the most affordable properties for sale in Fenstanton?
The streets with the most affordable properties for sale in Fenstanton are Chequers Close at an average of £165,000, Gardener Crescent at an average of £168,750 and Huntingdon Road at an average of £225,000.
Which train stations are available in or near Fenstanton?
Some of the train stations available in or near Fenstanton are Huntingdon, St.Neots and Cambridge North.
Property Price Paid in Fenstanton by Year
The average sold property price by year was:
| Year | Average Sold Price | Price Change |
Sold Properties
|
|---|---|---|---|
| 2025 | £393,000 | 5% |
34 Properties |
| 2024 | £374,378 | 4% |
33 Properties |
| 2023 | £359,341 | -6% |
40 Properties |
| 2022 | £381,048 | 8% |
57 Properties |
| 2021 | £352,416 | 2% |
66 Properties |
| 2020 | £347,073 | 4% |
71 Properties |
| 2019 | £334,058 | -1% |
86 Properties |
| 2018 | £338,880 | 6% |
59 Properties |
| 2017 | £317,067 | 6% |
58 Properties |
| 2016 | £297,878 | 13% |
59 Properties |
| 2015 | £258,329 | -5% |
47 Properties |
| 2014 | £272,368 | 28% |
50 Properties |
| 2013 | £196,107 | -21% |
54 Properties |
| 2012 | £237,967 | -0,4% |
31 Properties |
| 2011 | £238,839 | 4% |
37 Properties |
| 2010 | £229,192 | 10% |
36 Properties |
| 2009 | £207,023 | -30% |
40 Properties |
| 2008 | £269,118 | 23% |
29 Properties |
| 2007 | £206,518 | 3% |
67 Properties |
| 2006 | £200,816 | -6% |
73 Properties |
| 2005 | £213,842 | 4% |
56 Properties |
| 2004 | £205,455 | -3% |
95 Properties |
| 2003 | £212,278 | 25% |
88 Properties |
| 2002 | £159,891 | 26% |
48 Properties |
| 2001 | £118,354 | 1% |
48 Properties |
| 2000 | £117,463 | 11% |
55 Properties |
| 1999 | £105,050 | 28% |
62 Properties |
| 1998 | £75,141 | 1% |
42 Properties |
| 1997 | £74,689 | 18% |
44 Properties |
| 1996 | £61,569 | -5% |
40 Properties |
| 1995 | £64,626 | - |
25 Properties |
Property Price per Property Type in Fenstanton
Here you can find historic sold price data in order to help with your property search.
The average Property Paid Price for specific property types in the last three years are:
| Property Type | Average Sold Price | Sold Properties |
|---|---|---|
| Semi Detached House | £317,242.00 | 33 Semi Detached Houses |
| Detached House | £477,025.00 | 48 Detached Houses |
| Terraced House | £259,328.00 | 21 Terraced Houses |
| Flat | £255,600.00 | 5 Flats |

