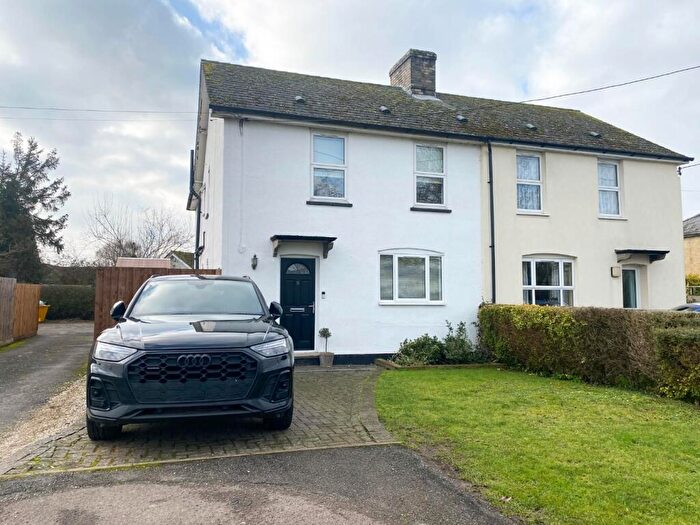
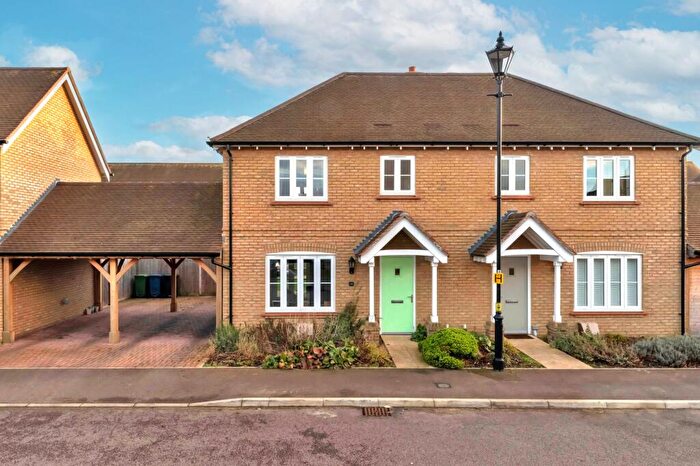
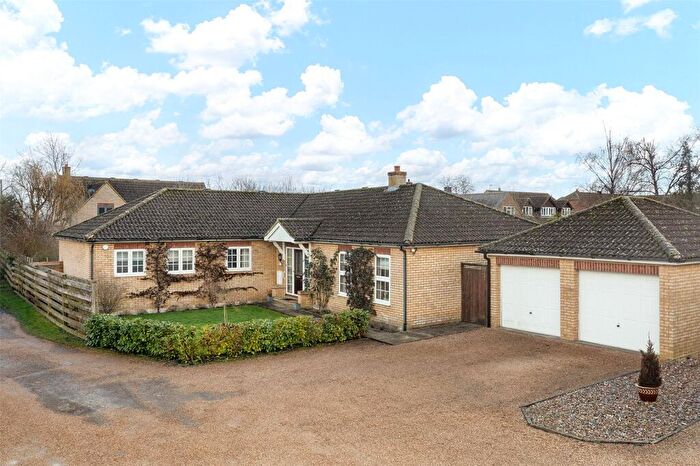
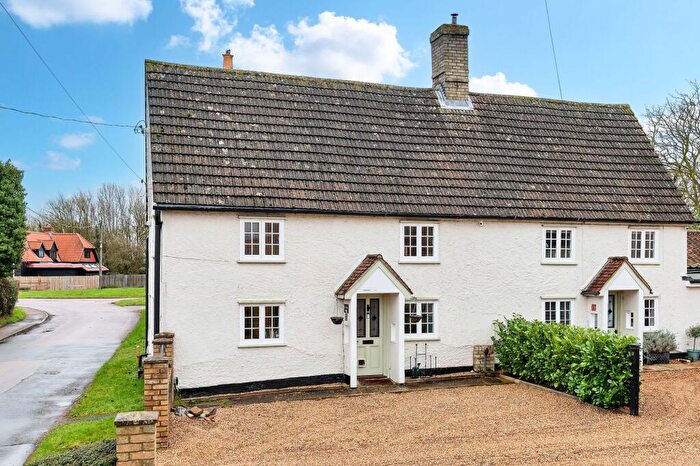
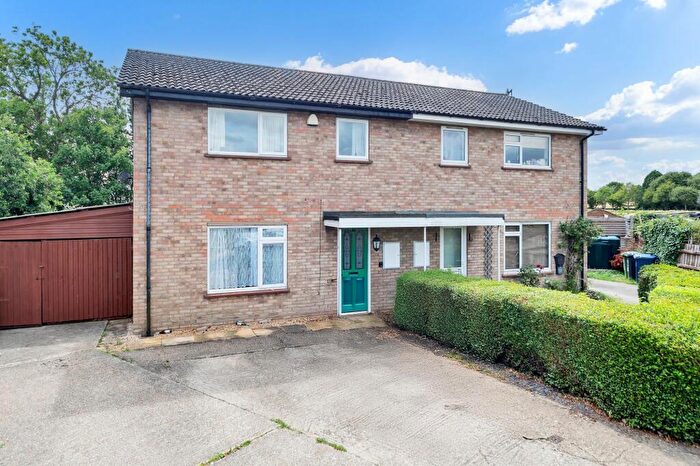
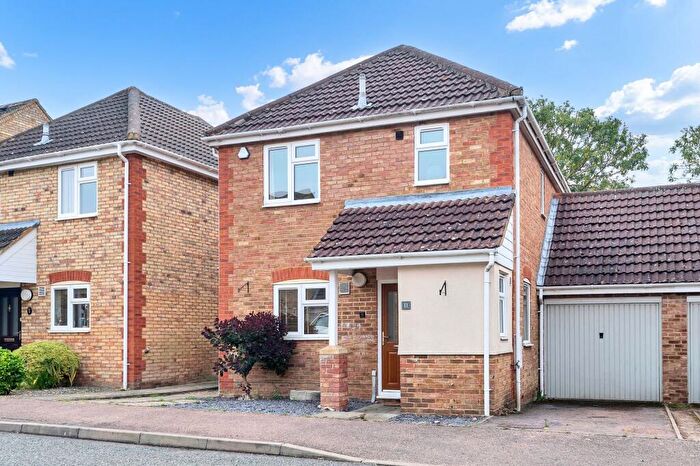
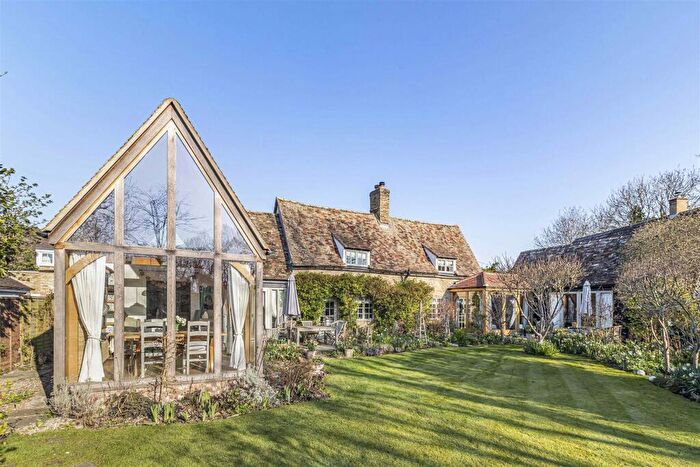
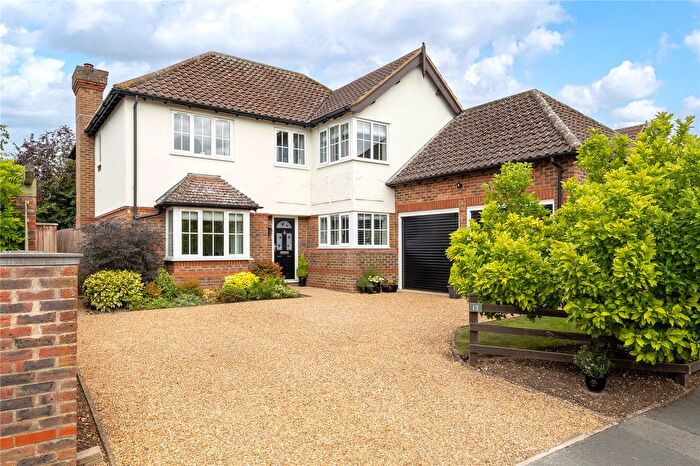
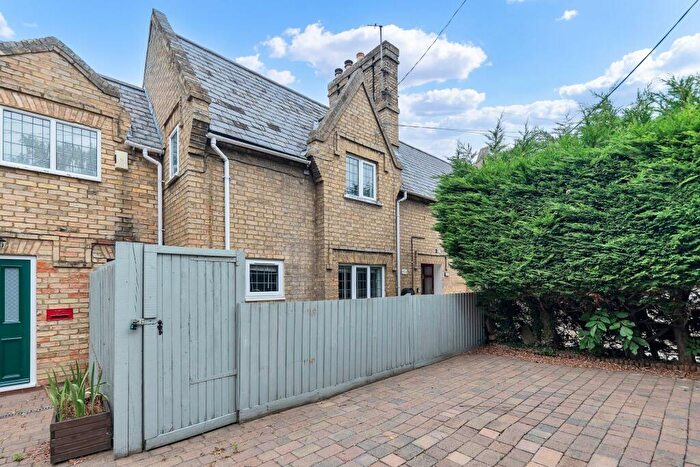
Houses for sale & to rent in Orwell And Barrington, Royston
House Prices in Orwell And Barrington
Properties in Orwell And Barrington have an average house price of £563,392.00 and had 42 Property Transactions within the last 3 years¹.
Orwell And Barrington is an area in Royston, Cambridgeshire with 534 households², where the most expensive property was sold for £1,150,000.00.
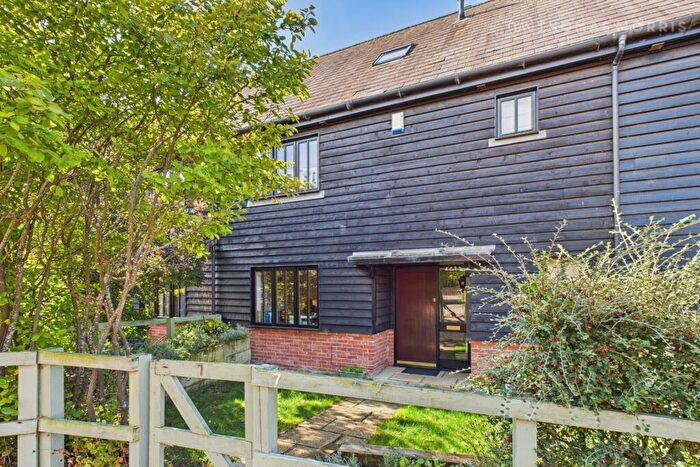
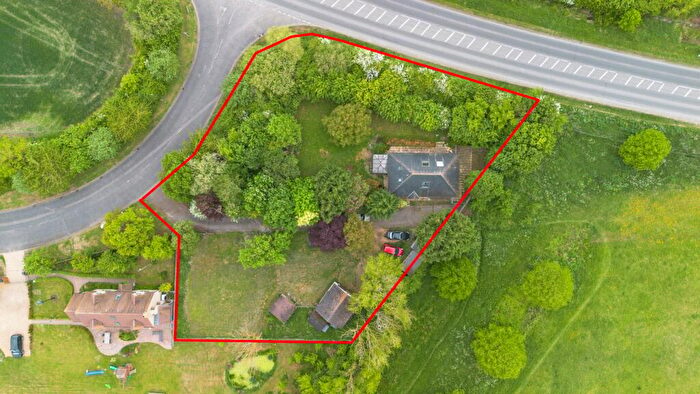
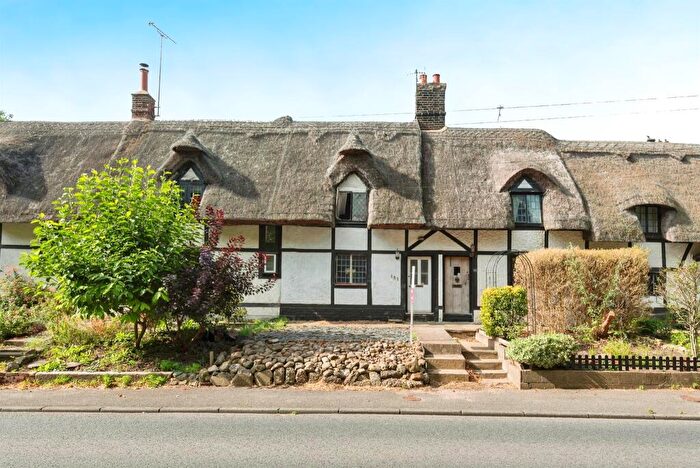
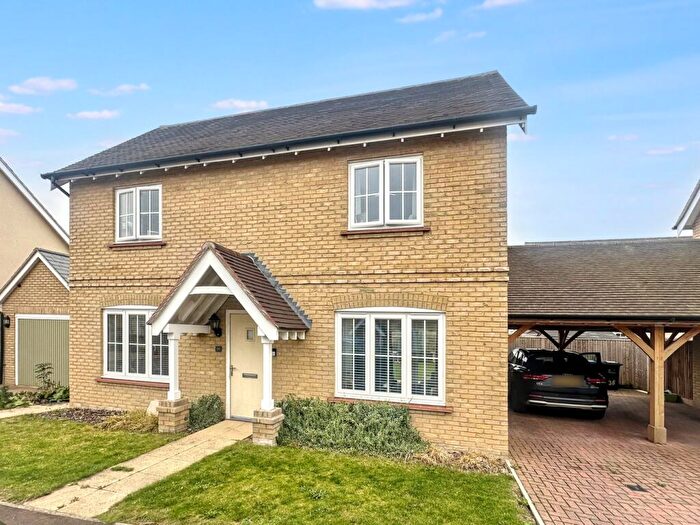
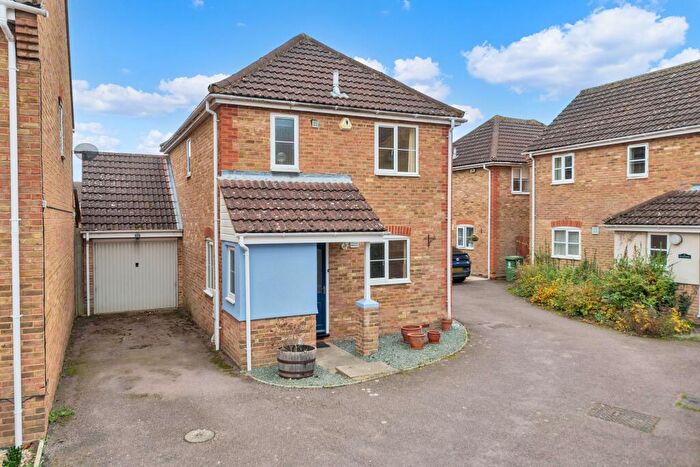
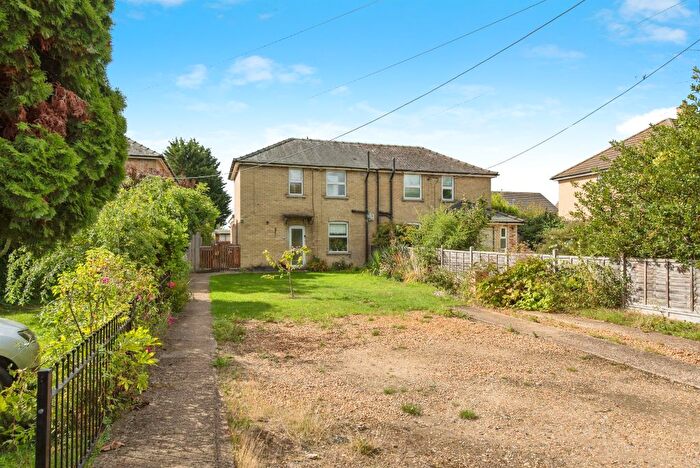
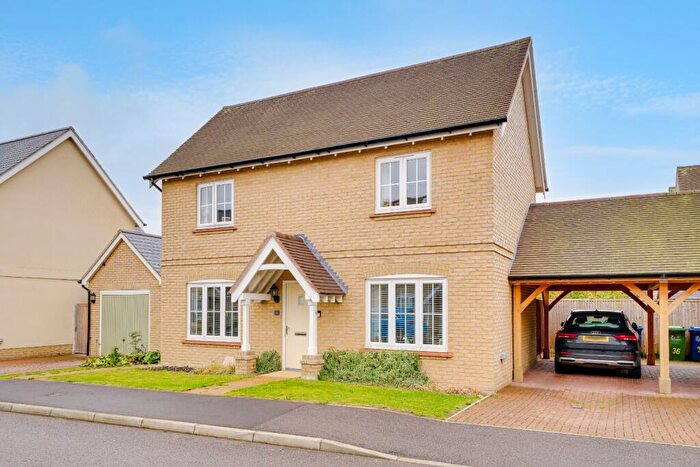
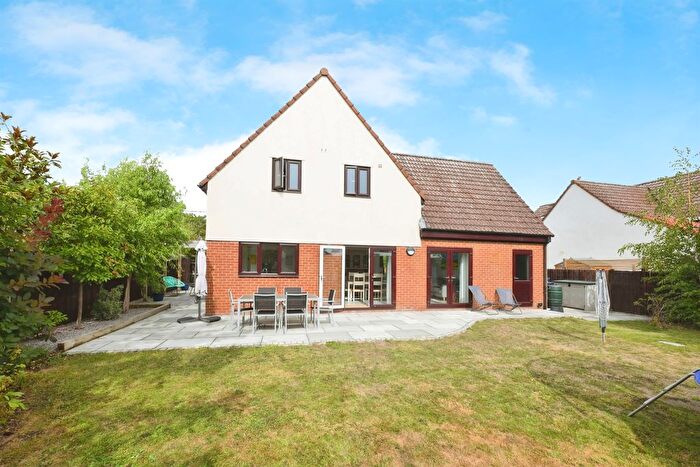
Properties for sale in Orwell And Barrington
Previously listed properties in Orwell And Barrington
Roads and Postcodes in Orwell And Barrington
Navigate through our locations to find the location of your next house in Orwell And Barrington, Royston for sale or to rent.
| Streets | Postcodes |
|---|---|
| Barrington Road | SG8 5QP |
| Brookside | SG8 5TQ |
| Cambridge Road | SG8 5QB SG8 5QD SG8 5QE |
| Chequers Close | SG8 5UN |
| Cross Lane Close | SG8 5QW |
| Ermine Way | SG8 0AJ SG8 0AL |
| Fishers Lane | SG8 5QX |
| Greenford Close | SG8 5QA |
| High Street | SG8 5QN |
| Hillside | SG8 5QZ SG8 5RA |
| Hurdleditch Road | SG8 5QG |
| Leaden Hill | SG8 5QH |
| Lordship Close | SG8 5TH |
| Lotfield Street | SG8 5QT |
| Malton Farm Cottages | SG8 6PG |
| Malton Lane | SG8 6PE |
| Malton Road | SG8 5QR |
| Meadowcroft Way | SG8 5QU |
| Old Wimpole Road | SG8 0BT |
| Pearmains Close | SG8 5QY |
| Rectory Farm Lane | SG8 5RB |
| Stocks Lane | SG8 5QS |
| The Grove | SG8 5RH |
| Town Green Road | SG8 5QJ SG8 5QL |
| Wimbridge Close | SG8 5QQ |
Transport near Orwell And Barrington
- FAQ
- Price Paid By Year
- Property Type Price
Frequently asked questions about Orwell And Barrington
What is the average price for a property for sale in Orwell And Barrington?
The average price for a property for sale in Orwell And Barrington is £563,392. This amount is 9% higher than the average price in Royston. There are 205 property listings for sale in Orwell And Barrington.
What streets have the most expensive properties for sale in Orwell And Barrington?
The streets with the most expensive properties for sale in Orwell And Barrington are High Street at an average of £727,500, Fishers Lane at an average of £700,000 and Wimbridge Close at an average of £650,000.
What streets have the most affordable properties for sale in Orwell And Barrington?
The streets with the most affordable properties for sale in Orwell And Barrington are Meadowcroft Way at an average of £337,500, Brookside at an average of £400,166 and Leaden Hill at an average of £521,666.
Which train stations are available in or near Orwell And Barrington?
Some of the train stations available in or near Orwell And Barrington are Shepreth, Meldreth and Foxton.
Property Price Paid in Orwell And Barrington by Year
The average sold property price by year was:
| Year | Average Sold Price | Price Change |
Sold Properties
|
|---|---|---|---|
| 2025 | £567,363 | 4% |
11 Properties |
| 2024 | £545,653 | -5% |
13 Properties |
| 2023 | £573,777 | -14% |
18 Properties |
| 2022 | £654,083 | 18% |
12 Properties |
| 2021 | £538,640 | -12% |
32 Properties |
| 2020 | £605,937 | 28% |
16 Properties |
| 2019 | £434,958 | -2% |
12 Properties |
| 2018 | £445,249 | 2% |
20 Properties |
| 2017 | £438,197 | -9% |
20 Properties |
| 2016 | £478,160 | 5% |
23 Properties |
| 2015 | £456,437 | 19% |
24 Properties |
| 2014 | £367,625 | -5% |
24 Properties |
| 2013 | £385,596 | -1% |
26 Properties |
| 2012 | £387,527 | -22% |
18 Properties |
| 2011 | £473,780 | 29% |
15 Properties |
| 2010 | £334,235 | -18% |
17 Properties |
| 2009 | £393,726 | -3% |
20 Properties |
| 2008 | £406,375 | 11% |
8 Properties |
| 2007 | £360,278 | 2% |
25 Properties |
| 2006 | £354,837 | 16% |
25 Properties |
| 2005 | £296,456 | -14% |
23 Properties |
| 2004 | £338,620 | 23% |
17 Properties |
| 2003 | £260,447 | 4% |
22 Properties |
| 2002 | £251,077 | 8% |
38 Properties |
| 2001 | £231,227 | 28% |
23 Properties |
| 2000 | £165,854 | 12% |
21 Properties |
| 1999 | £145,334 | -10% |
36 Properties |
| 1998 | £160,202 | 27% |
17 Properties |
| 1997 | £117,390 | -14% |
36 Properties |
| 1996 | £133,646 | 4% |
33 Properties |
| 1995 | £128,097 | - |
22 Properties |
Property Price per Property Type in Orwell And Barrington
Here you can find historic sold price data in order to help with your property search.
The average Property Paid Price for specific property types in the last three years are:
| Property Type | Average Sold Price | Sold Properties |
|---|---|---|
| Semi Detached House | £436,392.00 | 14 Semi Detached Houses |
| Terraced House | £442,500.00 | 4 Terraced Houses |
| Detached House | £657,625.00 | 24 Detached Houses |

