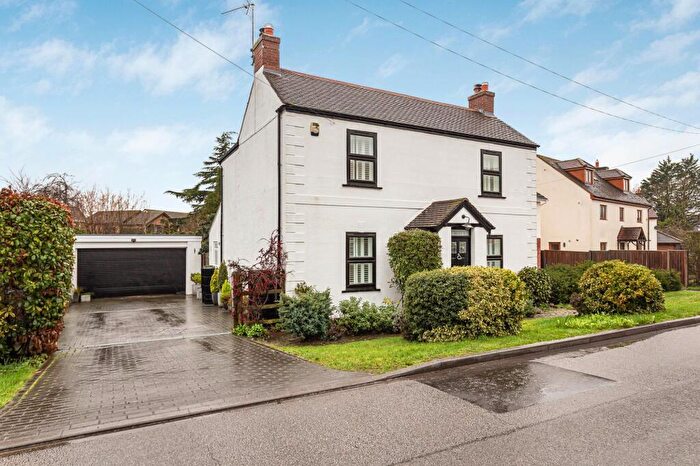
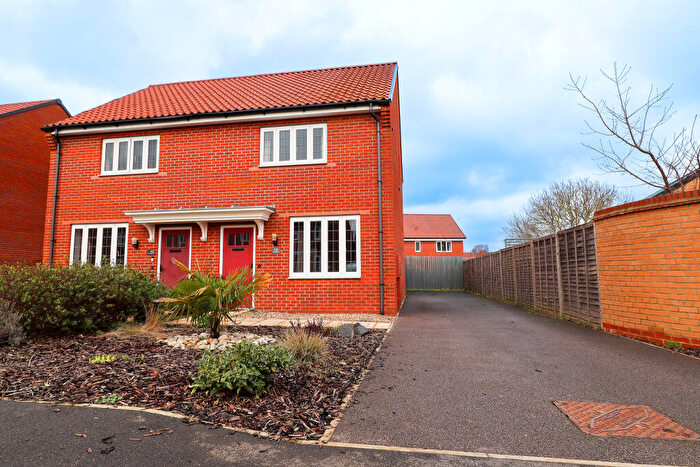
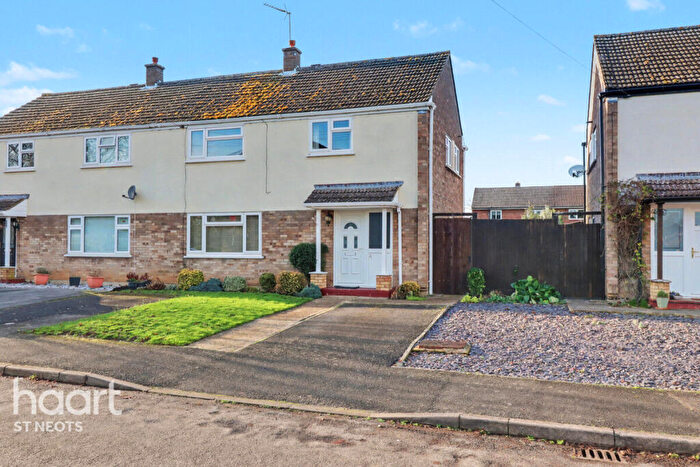
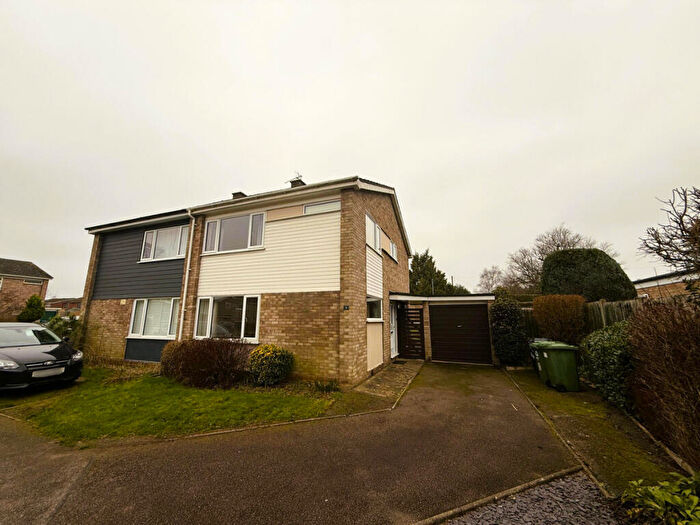
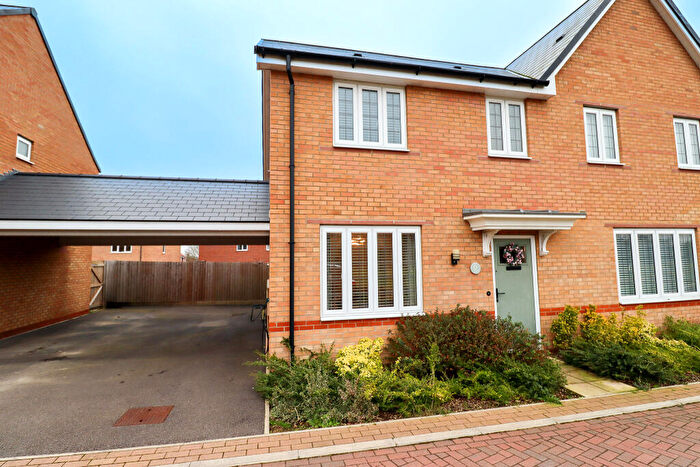
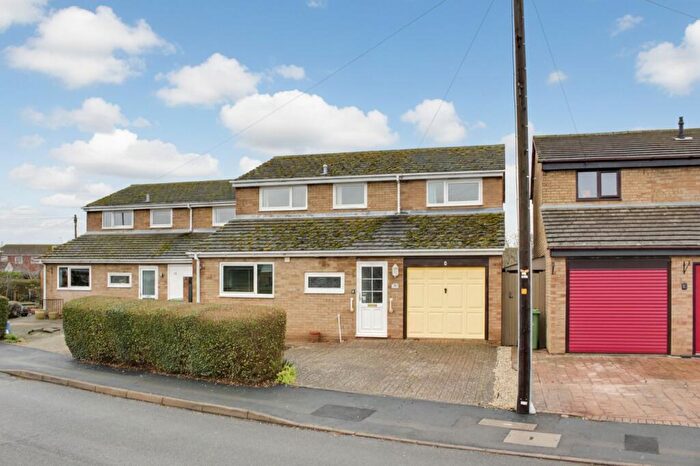
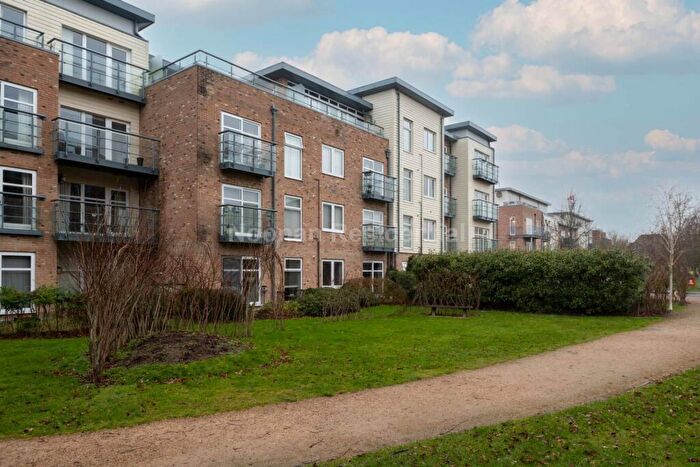
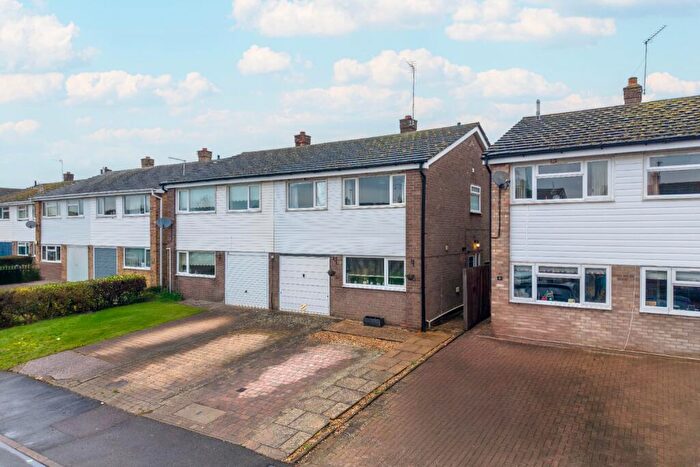
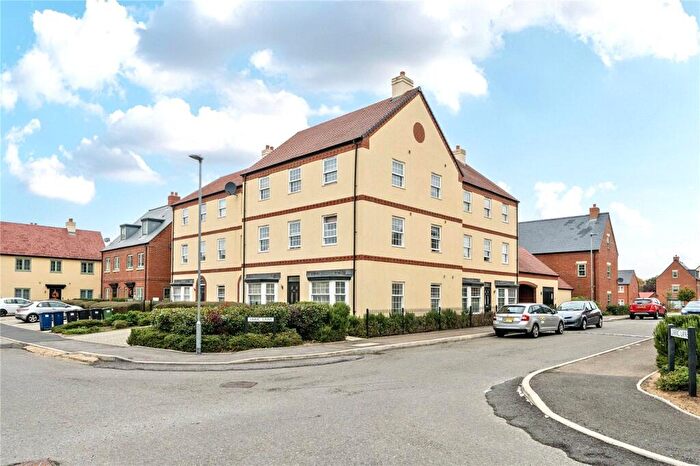
Houses for sale & to rent in Buckden, St Neots
House Prices in Buckden
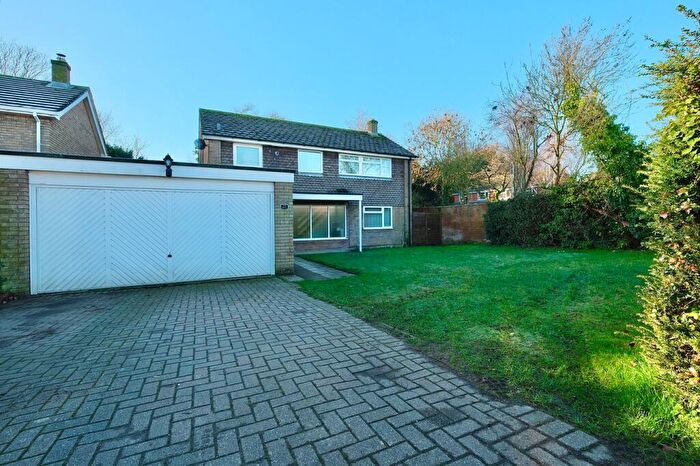
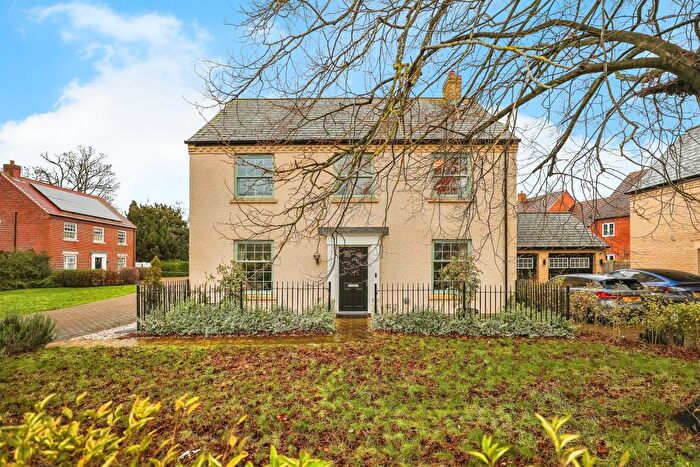
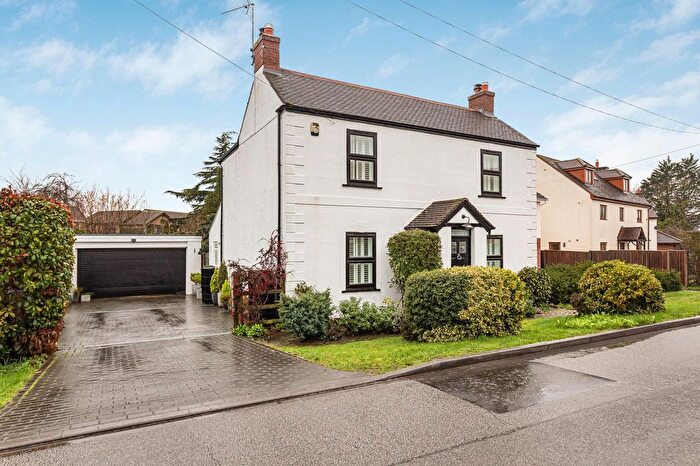
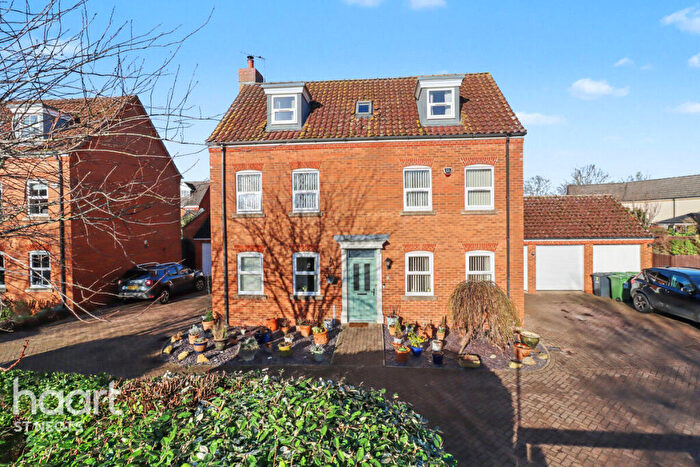
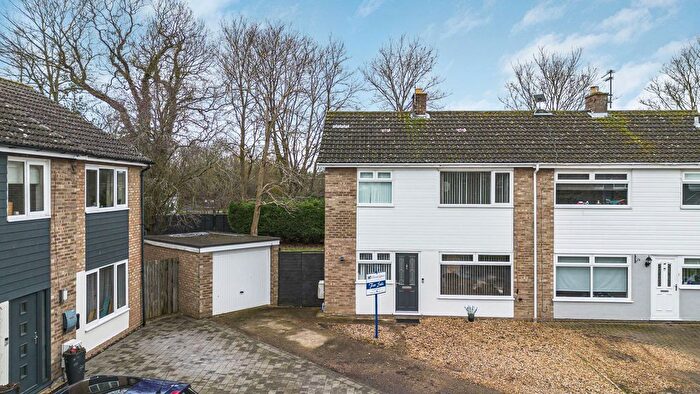
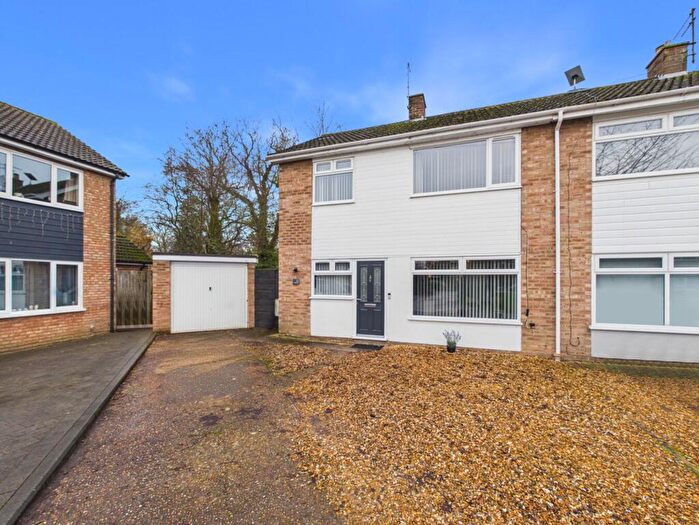
Properties in Buckden have an average house price of £389,229.00 and had 138 Property Transactions within the last 3 years¹.
Buckden is an area in St Neots, Cambridgeshire with 1,398 households², where the most expensive property was sold for £1,933,000.00.
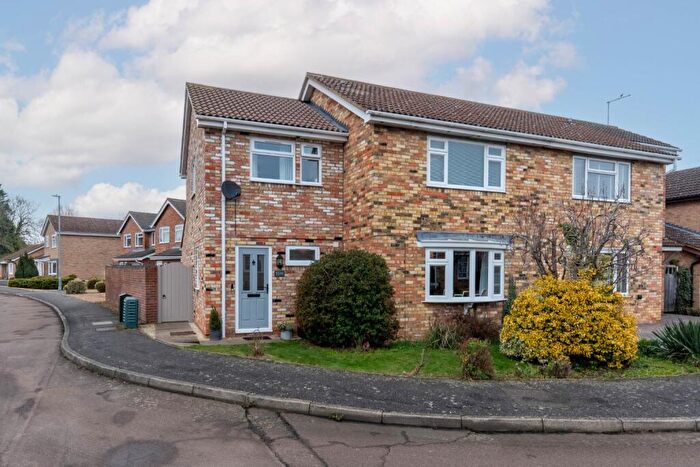
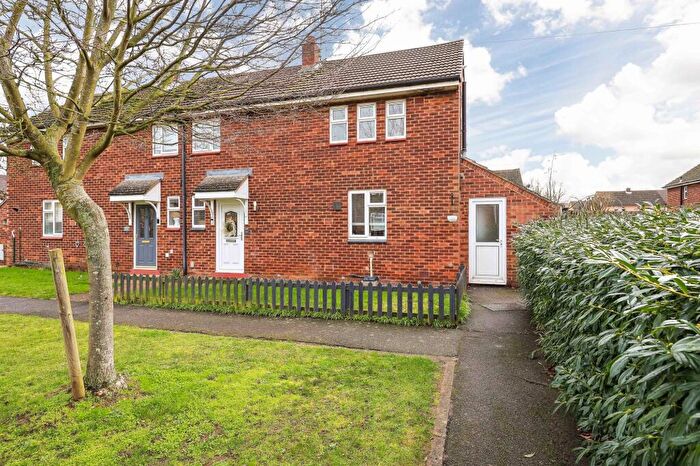
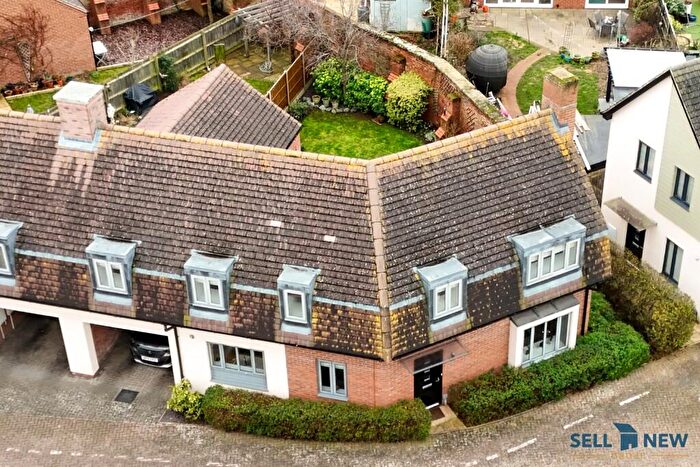
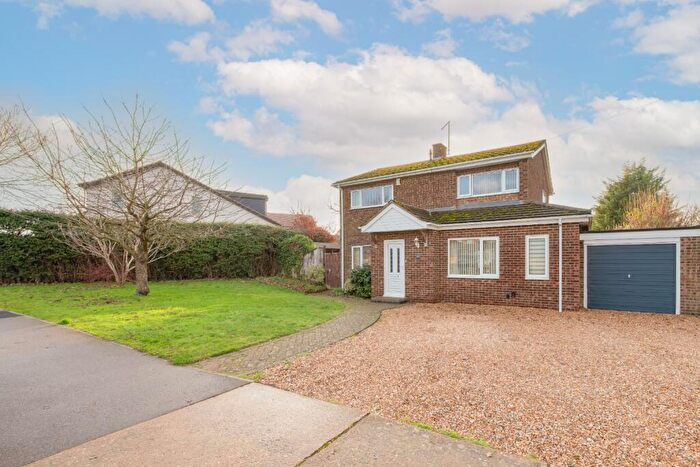
Properties for sale in Buckden
Roads and Postcodes in Buckden
Navigate through our locations to find the location of your next house in Buckden, St Neots for sale or to rent.
| Streets | Postcodes |
|---|---|
| Angles Drive | PE19 5WH |
| Aragon Close | PE19 5TY |
| Beaufort Drive | PE19 5YU |
| Bell Lane | PE19 5XZ |
| Bishops Way | PE19 5TZ |
| Brampton Road | PE19 5UH PE19 5UJ PE19 5YZ |
| Buckden Hill | PE19 5XP |
| Buckden Marina | PE19 5QS |
| Burberry Road | PE19 5UY |
| Carters Boatyard | PE19 5RY |
| Charles Court | PE19 5UZ |
| Church Street | PE19 5SH PE19 5SJ PE19 5SX PE19 5TE PE19 5TP PE19 5TL PE19 5TR |
| Copes Close | PE19 5SD |
| Cranfield Close | PE19 5WS |
| Cranfield Way | PE19 5TJ |
| Danes Way | PE19 5WN |
| Falcon Way | PE19 5UU |
| Field Close | PE19 5UA |
| George Lane | PE19 5XL PE19 5XN |
| Glebe Lane | PE19 5TG |
| Great North Road | PE19 5UF PE19 5XJ PE19 5YF PE19 5UG PE19 5UL PE19 5UQ PE19 5XF PE19 5XS PE19 5XY |
| Greenway | PE19 5TU |
| Hardwick Lane | PE19 5UN |
| High Street | PE19 5TA PE19 5XA PE19 5YE PE19 5WZ PE19 5YY |
| Hoo Close | PE19 5TX |
| Hunts End | PE19 5ST PE19 5SU |
| Hunts End Court | PE19 5QY |
| Ivelbury Close | PE19 5XE |
| Jute Crescent | PE19 5WJ |
| King George Court | PE19 5EY |
| Lark End | PE19 5SP |
| Leadens Lane | PE19 5QZ |
| Lees Lane | PE19 5YG |
| Lincoln Close | PE19 5UE |
| Longhall Road | PE19 5WD |
| Lucks Lane | PE19 5TF PE19 5TQ |
| Manor Close | PE19 5XR |
| Manor Gardens | PE19 5TW PE19 5TN |
| Marina View | PE19 5BH |
| Mayfield | PE19 5SZ |
| Mercia Close | PE19 5WE |
| Mill Road | PE19 5SN PE19 5SS PE19 5WX PE19 5QT |
| Morris Close | PE19 5YW |
| Park Road | PE19 5SL |
| Penda Court | PE19 5WL |
| Perry Road | PE19 5XG PE19 5XQ PE19 5XH |
| Rectory Lane | PE19 5YA PE19 5YD PE19 5YB |
| Saxon Way | PE19 5WG |
| School Lane | PE19 5TT |
| Silver Street | PE19 5TS PE19 5UD |
| Smith Drive | PE19 5UT |
| Springfield Close | PE19 5UR |
| St Hughs Road | PE19 5UB |
| Station Lane | PE19 5RX |
| Swan End | PE19 5SW |
| Taylors Lane | PE19 5TD PE19 5UP PE19 5UW |
| The Barns | PE19 5XX |
| The Grove | PE19 5US |
| The Osiers | PE19 5UX |
| The Street | PE19 5XT PE19 5XU |
| Thurley Close | PE19 5YH |
| Town Orchard | PE19 5YJ |
| Vicarage Lane | PE19 5YN |
| Viking Way | PE19 5WF |
| Vineyard Way | PE19 5SR |
| Weir Close | PE19 5TH |
| Wolsey Gardens | PE19 5YT |
| York Yard | PE19 5TB |
| PE19 5XW PE19 5YQ PE28 0BN |
Transport near Buckden
-
Huntingdon Station
-
St.Neots Station
-
Sandy Station
-
Biggleswade Station
-
Bedford Midland Station
-
Bedford St.Johns Station
- FAQ
- Price Paid By Year
- Property Type Price
Frequently asked questions about Buckden
What is the average price for a property for sale in Buckden?
The average price for a property for sale in Buckden is £389,229. This amount is 18% higher than the average price in St Neots. There are 1,305 property listings for sale in Buckden.
What streets have the most expensive properties for sale in Buckden?
The streets with the most expensive properties for sale in Buckden are The Grove at an average of £825,000, Hardwick Lane at an average of £650,000 and Church Street at an average of £614,750.
What streets have the most affordable properties for sale in Buckden?
The streets with the most affordable properties for sale in Buckden are Cranfield Close at an average of £133,000, Hunts End Court at an average of £133,162 and Weir Close at an average of £194,000.
Which train stations are available in or near Buckden?
Some of the train stations available in or near Buckden are Huntingdon, St.Neots and Sandy.
Property Price Paid in Buckden by Year
The average sold property price by year was:
| Year | Average Sold Price | Price Change |
Sold Properties
|
|---|---|---|---|
| 2025 | £362,728 | -18% |
35 Properties |
| 2024 | £426,344 | 16% |
60 Properties |
| 2023 | £359,011 | -13% |
43 Properties |
| 2022 | £406,984 | 8% |
52 Properties |
| 2021 | £372,868 | 2% |
82 Properties |
| 2020 | £365,531 | 16% |
32 Properties |
| 2019 | £306,966 | -1% |
59 Properties |
| 2018 | £309,309 | -3% |
40 Properties |
| 2017 | £318,380 | 7% |
44 Properties |
| 2016 | £296,969 | 7% |
65 Properties |
| 2015 | £275,407 | -3% |
60 Properties |
| 2014 | £284,503 | 8% |
68 Properties |
| 2013 | £260,750 | 10% |
58 Properties |
| 2012 | £234,211 | 4% |
33 Properties |
| 2011 | £223,883 | -10% |
41 Properties |
| 2010 | £245,161 | -14% |
42 Properties |
| 2009 | £280,005 | 13% |
44 Properties |
| 2008 | £242,756 | -9% |
44 Properties |
| 2007 | £264,984 | 10% |
68 Properties |
| 2006 | £239,372 | 12% |
81 Properties |
| 2005 | £211,480 | 4% |
60 Properties |
| 2004 | £203,050 | 8% |
73 Properties |
| 2003 | £187,327 | 5% |
77 Properties |
| 2002 | £178,333 | 7% |
98 Properties |
| 2001 | £166,520 | 12% |
59 Properties |
| 2000 | £146,815 | 18% |
70 Properties |
| 1999 | £119,801 | 8% |
73 Properties |
| 1998 | £110,807 | 8% |
50 Properties |
| 1997 | £101,602 | 16% |
63 Properties |
| 1996 | £84,921 | 13% |
73 Properties |
| 1995 | £74,281 | - |
34 Properties |
Property Price per Property Type in Buckden
Here you can find historic sold price data in order to help with your property search.
The average Property Paid Price for specific property types in the last three years are:
| Property Type | Average Sold Price | Sold Properties |
|---|---|---|
| Semi Detached House | £328,156.00 | 48 Semi Detached Houses |
| Detached House | £485,338.00 | 65 Detached Houses |
| Terraced House | £287,900.00 | 15 Terraced Houses |
| Flat | £209,666.00 | 10 Flats |

