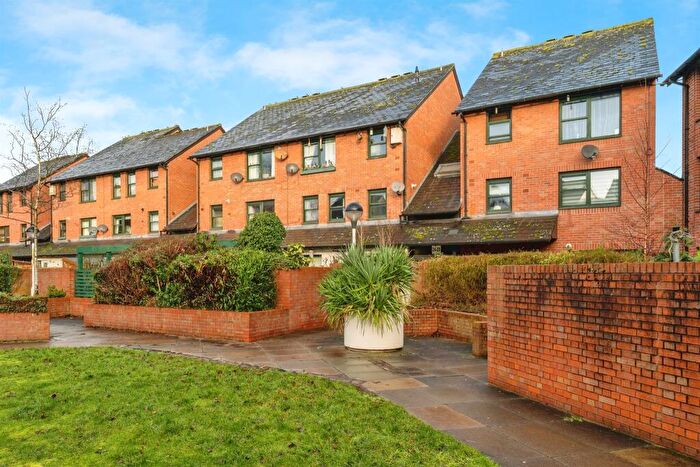
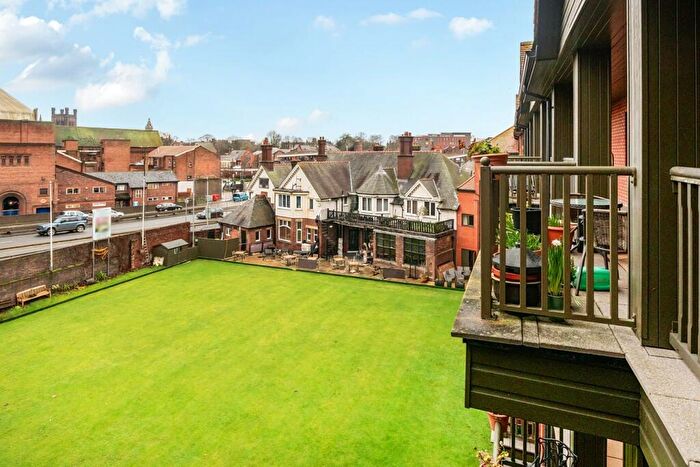
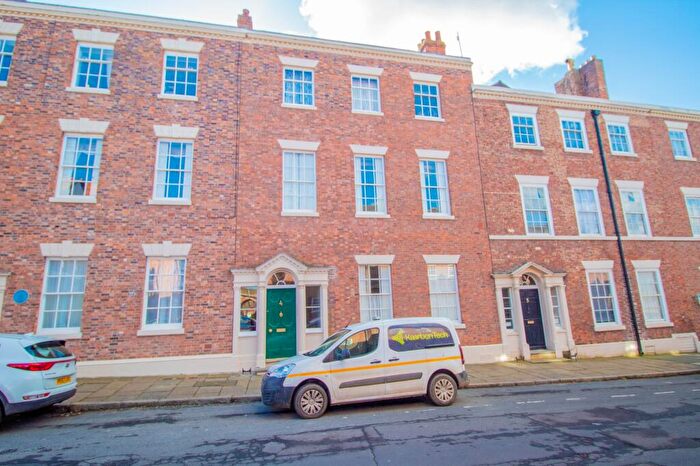
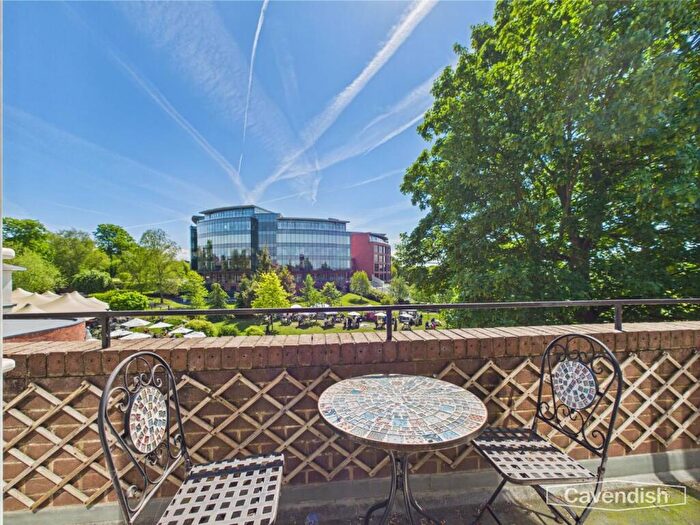
Houses for sale & to rent in Chester City, Chester
House Prices in Chester City
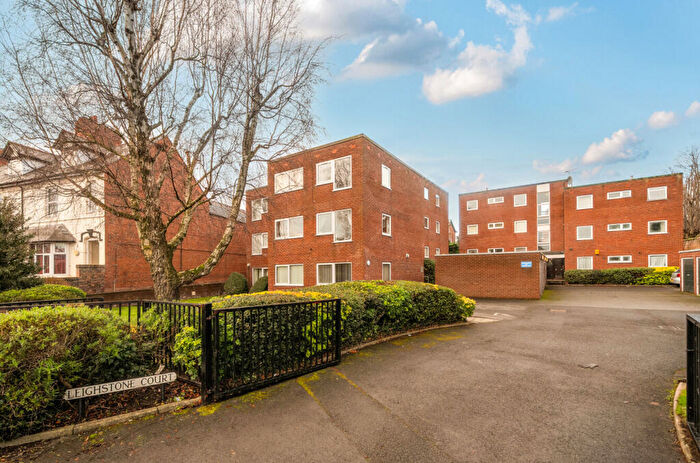
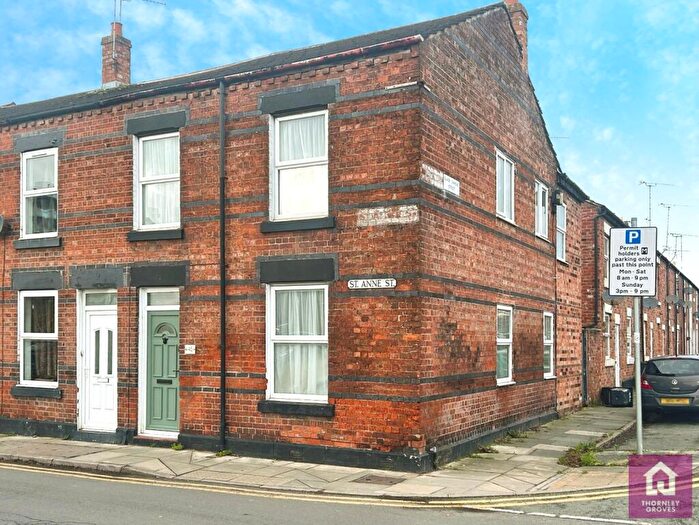
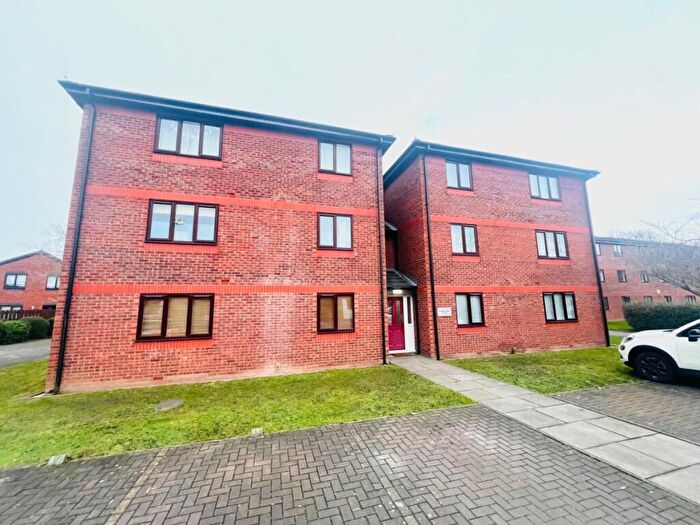
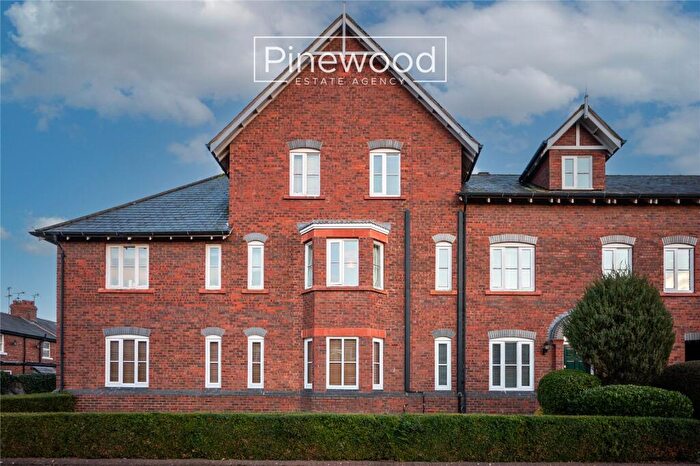
Properties in Chester City have an average house price of £234,236.00 and had 272 Property Transactions within the last 3 years¹.
Chester City is an area in Chester, Cheshire with 1,762 households², where the most expensive property was sold for £1,300,000.00.
Properties for sale in Chester City
Roads and Postcodes in Chester City
Navigate through our locations to find the location of your next house in Chester City, Chester for sale or to rent.
| Streets | Postcodes |
|---|---|
| Albion Place | CH1 1RW |
| Albion Street | CH1 1RQ |
| Back Queen Street | CH1 3LW |
| Bath Street | CH1 1QL |
| Black Diamond Park | CH1 3ET CH1 3EW |
| Black Diamond Street | CH1 3EX |
| Black Friars | CH1 2NU |
| Blackfriars Court | CH1 2PY |
| Bold Square | CH1 3LZ |
| Brennus Place | CH1 2NE |
| Bridge Place | CH1 1SA |
| Bridge Street | CH1 1NG |
| Bunce Street | CH1 2DF |
| Canal Street | CH1 4EJ CH1 4HA |
| Canning Street | CH1 2AD |
| Castle Place | CH1 2DQ |
| Castle Street | CH1 2DS |
| Charlotte Court | CH1 3LP |
| Church Street | CH1 3JD |
| City Walls | CH1 1SB CH1 2JG |
| City Walls Road | CH1 2NY |
| Common Hall Street | CH1 2BJ |
| Cornwall Street | CH1 3JE CH1 3JF |
| Cuppin Street | CH1 2BN |
| Delamere Street | CH1 4DS |
| Duke Street | CH1 1NE CH1 1QS CH1 1RP |
| Earls Villas | CH1 3BJ |
| Firemans Square | CH1 2JA |
| Foregate Street | CH1 1HB CH1 1HJ CH1 1JG |
| Gamul Place | CH1 1RX |
| Gamul Terrace | CH1 1RZ |
| Garden Lane | CH1 4HD |
| George Street | CH1 3EQ |
| Gloucester Street | CH1 3HR |
| Godstall Lane | CH1 1LN |
| Greyfriars | CH1 2NW |
| Grosvenor Court | CH1 1HG |
| Grosvenor Park Road | CH1 1QQ |
| Grosvenor Place | CH1 2DE |
| Henry Place | CH1 3HH |
| Hunter Street | CH1 2AR |
| King Charles Court | CH1 2AW |
| King Street | CH1 2AH CH1 2AJ |
| Kings Court | CH1 2AY |
| Knightsbridge Court | CH1 1QG |
| Lower Bridge Street | CH1 1RS CH1 1RU |
| Lyon Street | CH1 3EU |
| Moray Court | CH1 2BA |
| Nicholas Court | CH1 2QS |
| Nicholas Street | CH1 2NX |
| Northgate Row | CH1 2SA |
| Northgate Street | CH1 2HT |
| Nuns Road | CH1 2LH CH1 2LZ |
| Old Hall Place | CH1 2BX |
| Queen Street | CH1 3LG |
| Queens Place | CH1 3LN |
| Seller Street | CH1 3NA |
| Sens Close | CH1 2NF |
| Shipgate Street | CH1 1RT |
| Somerset Street | CH1 3JA |
| St Anne Street | CH1 3HS CH1 3HT CH1 3HU |
| St Annes | CH1 3HY CH1 3HZ |
| St Annes Place | CH2 2BD |
| St Marys Hill | CH1 2DW |
| St Olave Street | CH1 1RJ |
| St Oswalds | CH1 3HW |
| St Thomas Pathway | CH1 3LQ |
| Stanley Place | CH1 2LU |
| Stanley Place Mews | CH1 2LQ |
| Stanley Street | CH1 2LR |
| Steele Street | CH1 1RH |
| Talbot Street | CH1 3JN CH1 3JW |
| The Groves | CH1 1SD |
| The Shipgate | CH1 1RA |
| The Square | CH1 3AG CH1 3AJ CH1 3AN CH1 3AP CH1 3AR CH1 3AS |
| The Yonne | CH1 2NH |
| Union Street | CH1 1AB CH1 1QP |
| Upper Northgate Street | CH1 4EE |
| Volunteer Street | CH1 1RG |
| Walter Street | CH1 3JG CH1 3JQ |
| Water Tower Street | CH1 2AE |
| Watergate Row North | CH1 2LD |
| Watergate Row South | CH1 2LE |
| Watergate Street | CH1 2LA CH1 2LB CH1 2LF |
| Waterside View | CH1 3EA |
| Weaver Street | CH1 2BQ |
| Wellington Place | CH1 3HJ |
| White Friars | CH1 1NZ |
| York Street | CH1 3LR |
Transport near Chester City
-
Chester Station
-
Bache Station
-
Capenhurst Station
-
Hawarden Station
-
Hawarden Bridge Station
-
Ellesmere Port Station
-
Stanlow and Thornton Station
-
Shotton Station
-
Overpool Station
-
Ince and Elton Station
- FAQ
- Price Paid By Year
- Property Type Price
Frequently asked questions about Chester City
What is the average price for a property for sale in Chester City?
The average price for a property for sale in Chester City is £234,236. This amount is 25% lower than the average price in Chester. There are 1,450 property listings for sale in Chester City.
What streets have the most expensive properties for sale in Chester City?
The streets with the most expensive properties for sale in Chester City are The Groves at an average of £743,750, White Friars at an average of £644,875 and King Street at an average of £631,511.
What streets have the most affordable properties for sale in Chester City?
The streets with the most affordable properties for sale in Chester City are Garden Lane at an average of £43,988, George Street at an average of £50,398 and St Annes at an average of £92,000.
Which train stations are available in or near Chester City?
Some of the train stations available in or near Chester City are Chester, Bache and Capenhurst.
Property Price Paid in Chester City by Year
The average sold property price by year was:
| Year | Average Sold Price | Price Change |
Sold Properties
|
|---|---|---|---|
| 2025 | £239,703 | 2% |
81 Properties |
| 2024 | £233,717 | 2% |
93 Properties |
| 2023 | £230,210 | -12% |
98 Properties |
| 2022 | £258,262 | -6% |
116 Properties |
| 2021 | £273,028 | 13% |
124 Properties |
| 2020 | £238,869 | 15% |
62 Properties |
| 2019 | £204,068 | 8% |
99 Properties |
| 2018 | £188,213 | -16% |
107 Properties |
| 2017 | £217,686 | 13% |
105 Properties |
| 2016 | £190,316 | -7% |
108 Properties |
| 2015 | £203,866 | 19% |
127 Properties |
| 2014 | £165,615 | -9% |
121 Properties |
| 2013 | £180,461 | -10% |
76 Properties |
| 2012 | £198,028 | 20% |
56 Properties |
| 2011 | £158,520 | -27% |
109 Properties |
| 2010 | £200,760 | -7% |
92 Properties |
| 2009 | £215,027 | 23% |
114 Properties |
| 2008 | £165,763 | -19% |
63 Properties |
| 2007 | £196,498 | 6% |
130 Properties |
| 2006 | £185,535 | 9% |
132 Properties |
| 2005 | £168,030 | -10% |
111 Properties |
| 2004 | £184,948 | 16% |
142 Properties |
| 2003 | £155,670 | 7% |
148 Properties |
| 2002 | £144,551 | -5% |
169 Properties |
| 2001 | £152,336 | 19% |
174 Properties |
| 2000 | £123,961 | 19% |
143 Properties |
| 1999 | £100,623 | 19% |
133 Properties |
| 1998 | £81,497 | 16% |
85 Properties |
| 1997 | £68,562 | 12% |
87 Properties |
| 1996 | £60,317 | -4% |
79 Properties |
| 1995 | £62,998 | - |
52 Properties |
Property Price per Property Type in Chester City
Here you can find historic sold price data in order to help with your property search.
The average Property Paid Price for specific property types in the last three years are:
| Property Type | Average Sold Price | Sold Properties |
|---|---|---|
| Semi Detached House | £212,500.00 | 2 Semi Detached Houses |
| Detached House | £526,785.00 | 7 Detached Houses |
| Terraced House | £289,717.00 | 104 Terraced Houses |
| Flat | £185,341.00 | 159 Flats |

