
Houses for sale in Cheshire, England
House Prices in Cheshire
Properties in Cheshire have
an average house price of
£322k
and had 36,702 Property Transactions
within the last 3 years.¹
Cheshire is a location in
England with
331,005 households², where the most expensive property was sold for £8.72M.
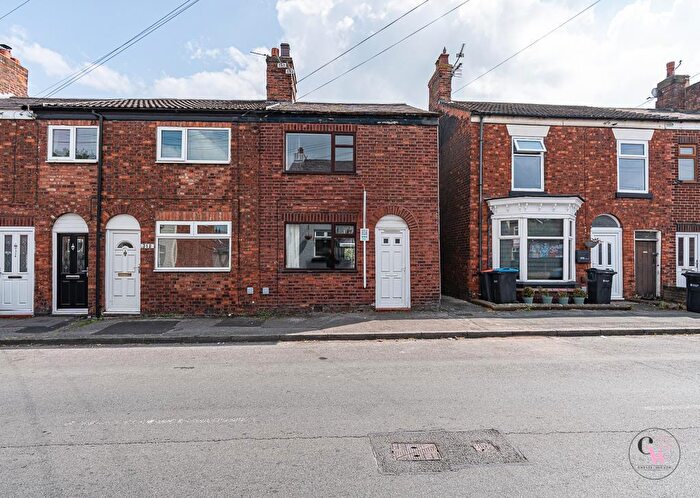
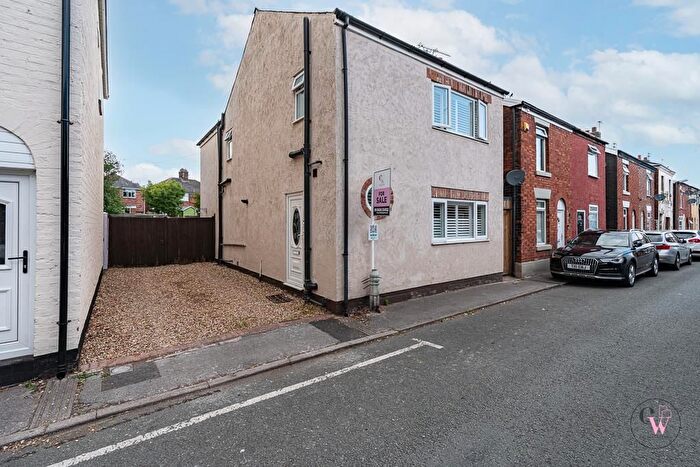
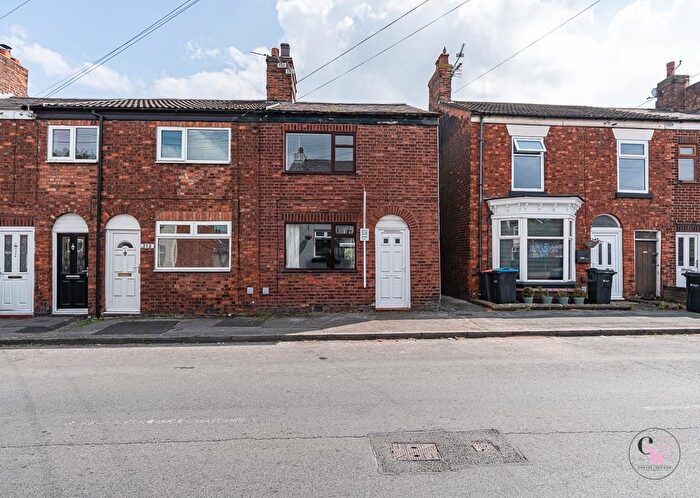
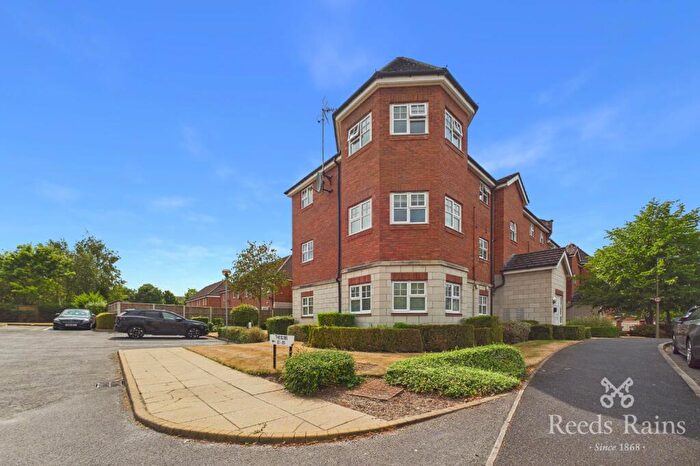
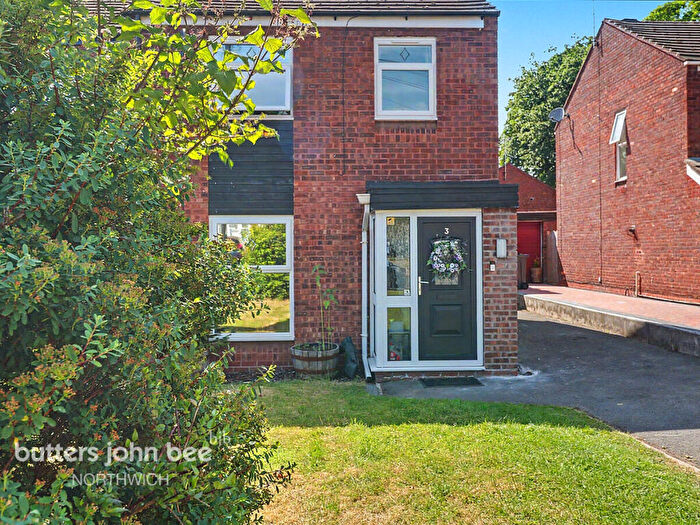
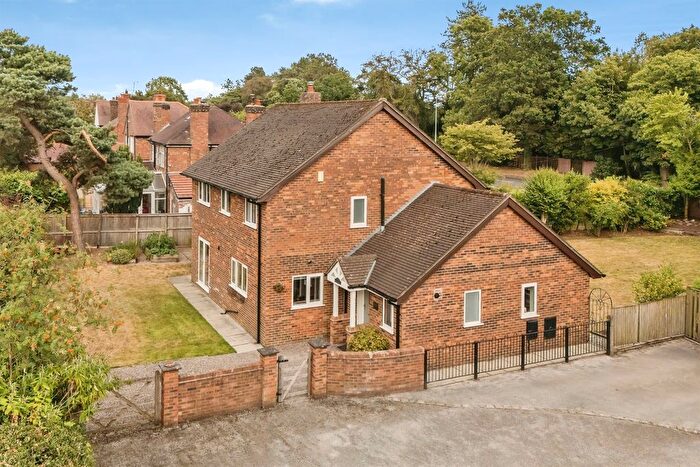
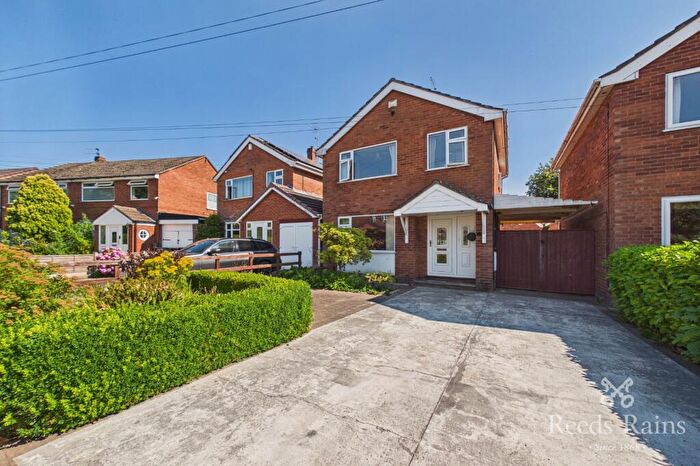
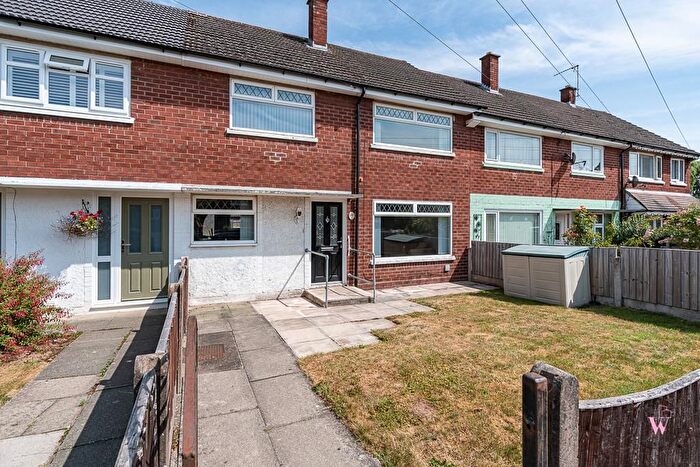
Properties for sale in Cheshire
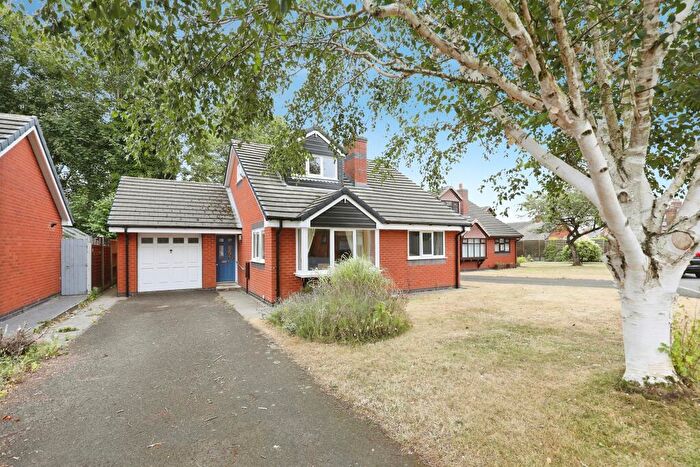

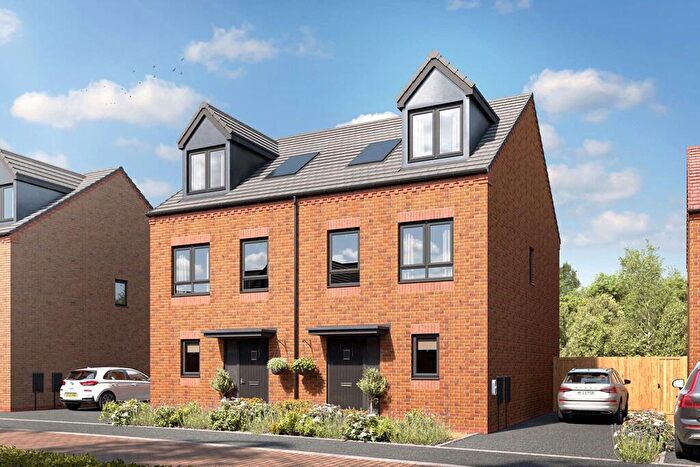
![]()
If you are looking to sell your house, let it out, or receive a property valuation, an expert can help you.
Click the button below to get started.


Towns in Cheshire
Navigate through our locations to find the location of your next house in Cheshire, England for sale or to rent.
Property price trends in Cheshire
According to the latest Land Registry data, the average home in Cheshire sold for £315,925 in 2026. That figure comes from a substantial record of 413,215 sales logged over the past 31 years.
Prices have held fairly steady over the last three years. Compared with 2023, when the typical sale came in around £312,116, values are broadly unchanged.
Looking back five years, average prices are up about 3.5% since 2021, a gain of around £10,737 in cash terms.
Zoom out to the past decade for the fuller picture. Back in 2016, homes here averaged £240,358, so the typical sold price has climbed about 31.4% since then, roughly 2.8% a year. Stretch the view to fifteen years and that annual pace holds at about 2.9%.
Frequently asked questions about Cheshire
What is the average price for a property for sale in Cheshire?
The average price for a property for sale in Cheshire is £321,948. This amount is 10% lower than the average price in England. There are more than 10,000 property listings for sale in Cheshire.
What locations have the most expensive properties for sale in Cheshire?
The locations with the most expensive properties for sale in Cheshire are Lymm at an average of £964,000, Alderley Edge at an average of £730,900 and Altrincham at an average of £711,162.
What locations have the most affordable properties for sale in Cheshire?
The locations with the most affordable properties for sale in Cheshire are Ellesmere Port at an average of £207,578, Winsford at an average of £210,177 and Crewe at an average of £230,483.
Which train stations are available in or near Cheshire?
Some of the train stations available in or near Cheshire are Winsford, Hartford and Greenbank.
Property Price Paid in Cheshire by Year
The average sold property price by year was:
| Year | Average Sold Price | Price Change |
Sold Properties
|
|---|---|---|---|
| 2026 | £315,925 | -5% |
2,184 Properties |
| 2025 | £332,300 | 3% |
12,163 Properties |
| 2024 | £321,336 | 3% |
11,608 Properties |
| 2023 | £312,116 | -1% |
10,747 Properties |
| 2022 | £316,383 | 4% |
13,467 Properties |
| 2021 | £305,188 | 7% |
17,201 Properties |
| 2020 | £284,009 | 8% |
13,030 Properties |
| 2019 | £261,351 | 1% |
14,994 Properties |
| 2018 | £258,517 | 2% |
15,079 Properties |
| 2017 | £252,368 | 5% |
15,447 Properties |
Property Price per Property Type in Cheshire
Here you can find historic sold price data in order to help with your property search.
The average Property Paid Price for specific property types in the last three years are:
| Property Type | Average Sold Price | Sold Properties |
|---|---|---|
| Semi Detached House | £276,054.00 | 11,998 Semi Detached Houses |
| Terraced House | £215,174.00 | 9,554 Terraced Houses |
| Detached House | £507,206.00 | 11,395 Detached Houses |
| Flat | £178,068.00 | 3,755 Flats |
Transport in Cheshire
Please see below transportation links in this area:
