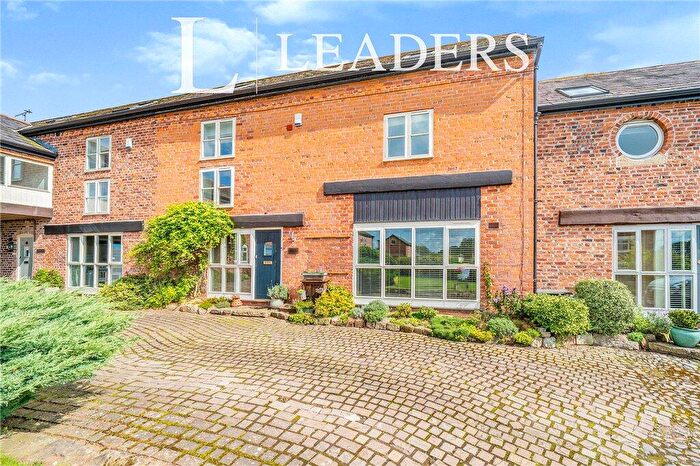
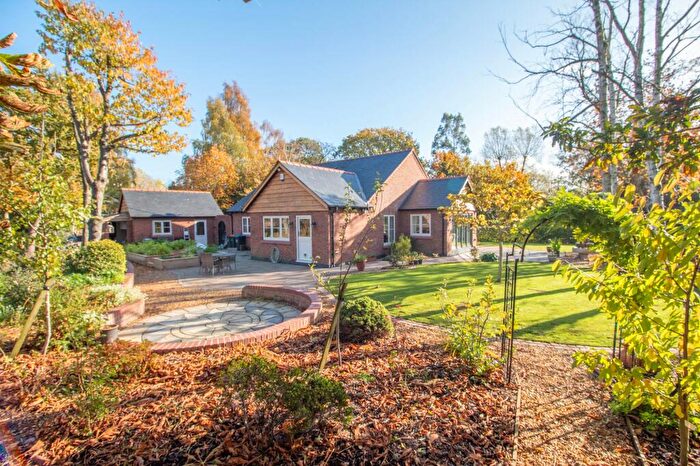
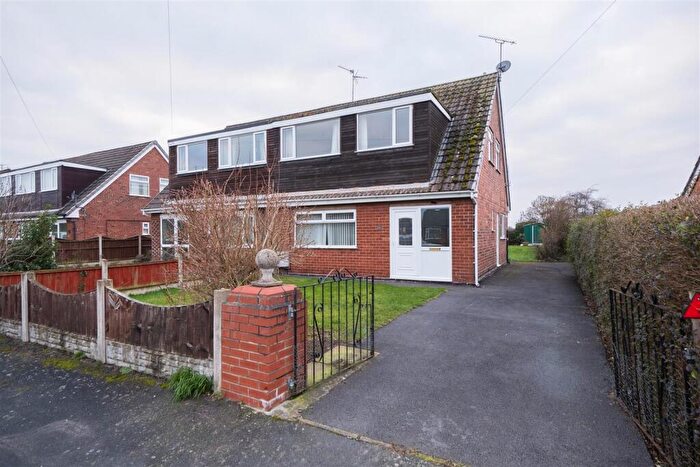
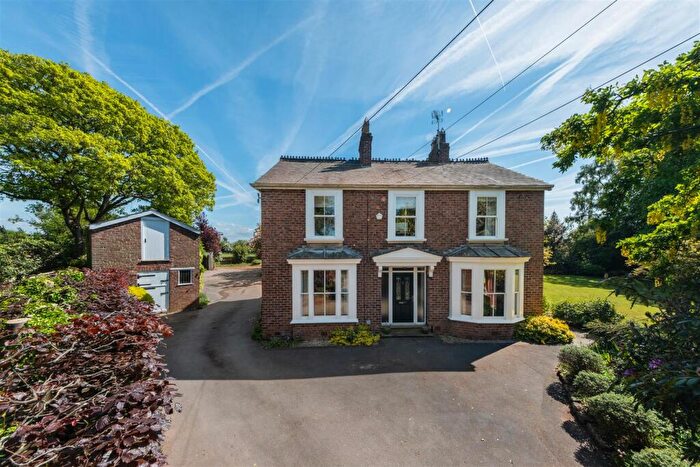
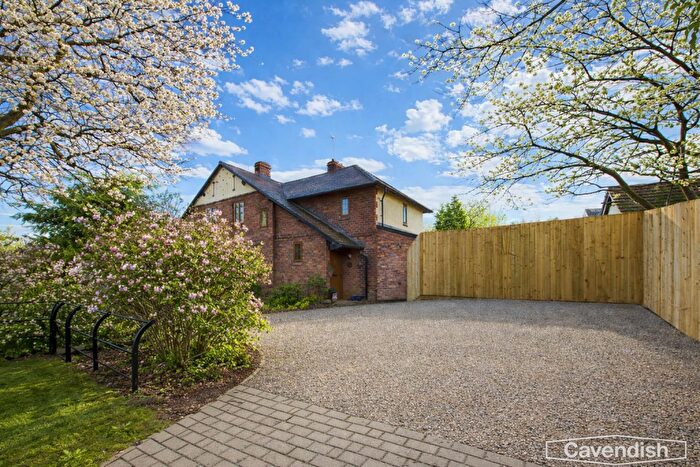
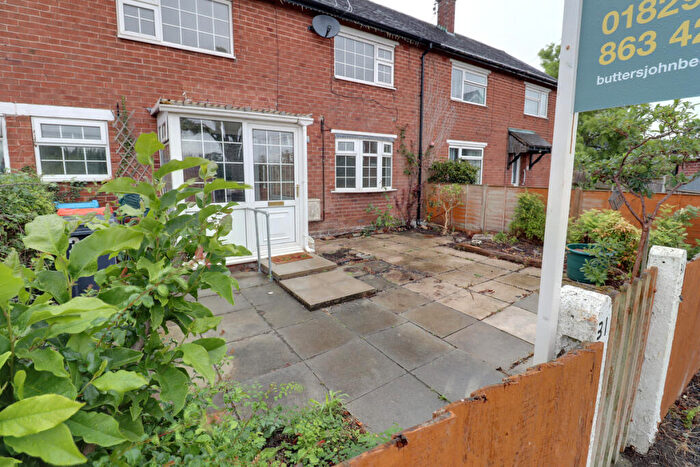
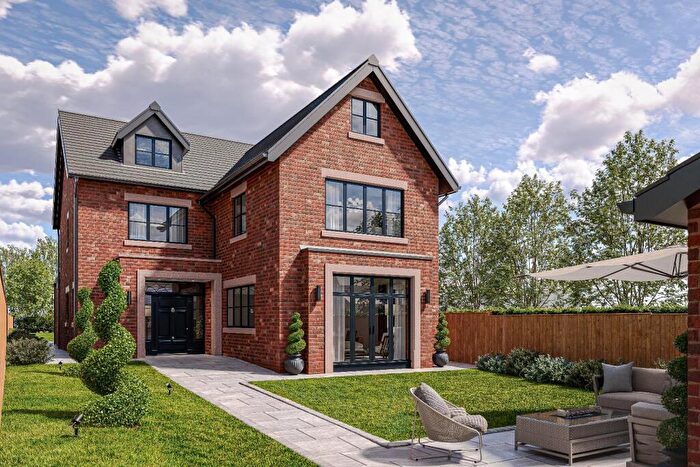
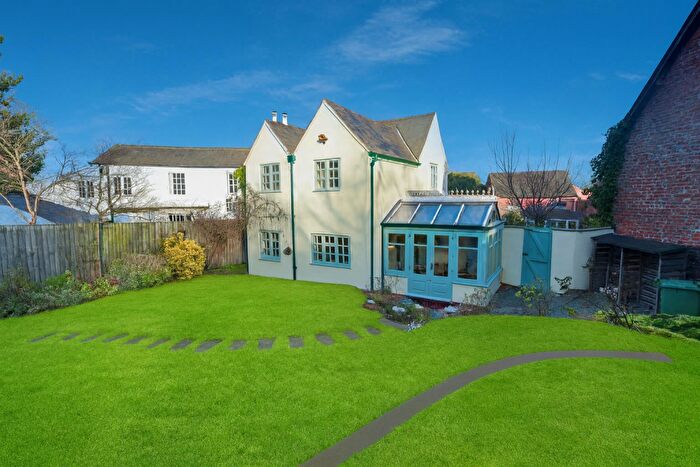
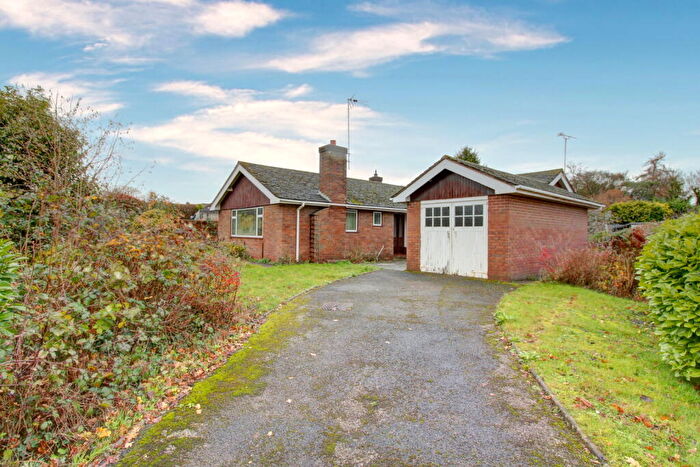
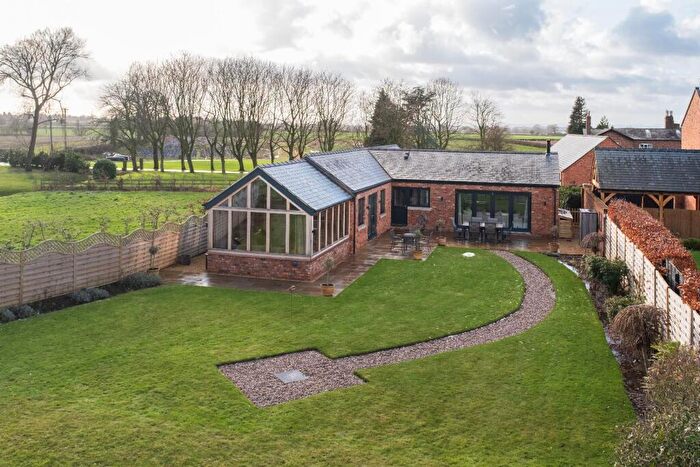
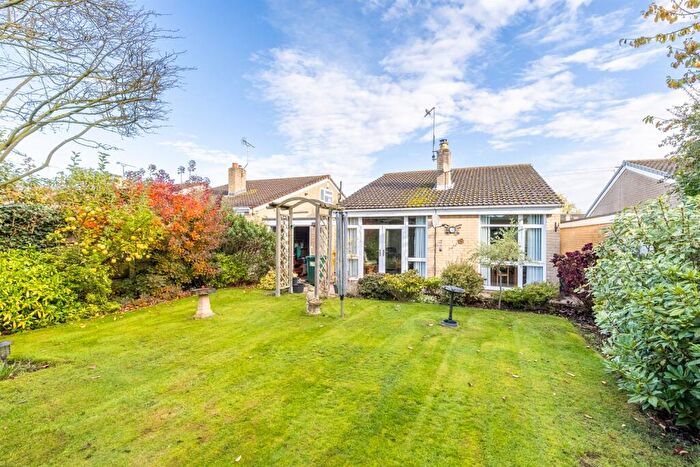
Houses for sale & to rent in Tarvin And Kelsall, Chester
House Prices in Tarvin And Kelsall
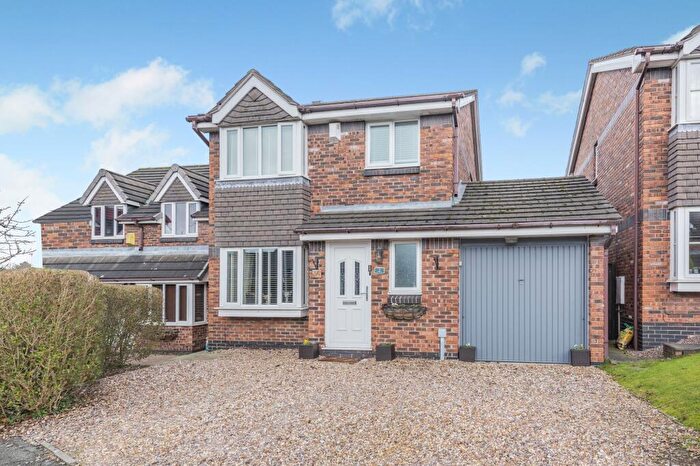
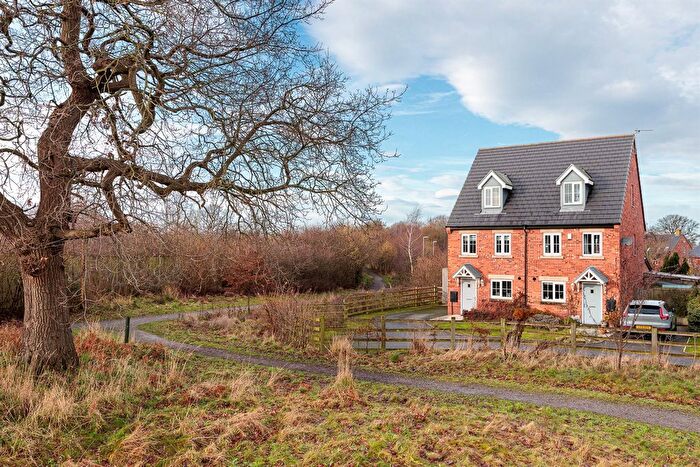
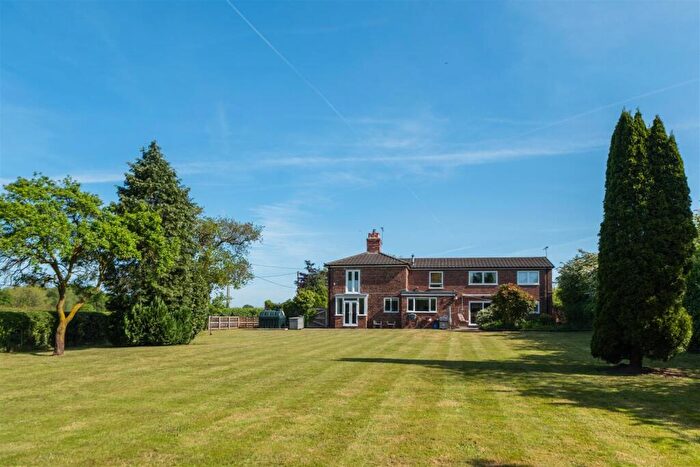
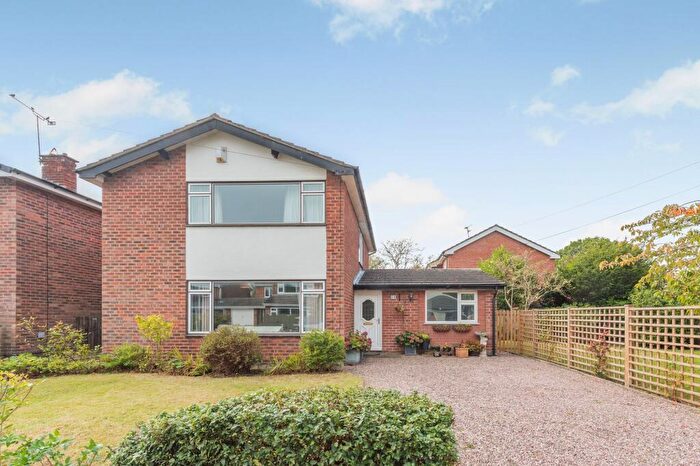
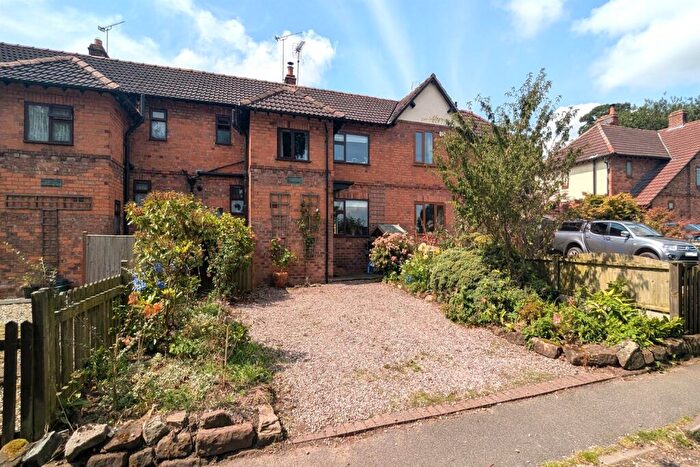
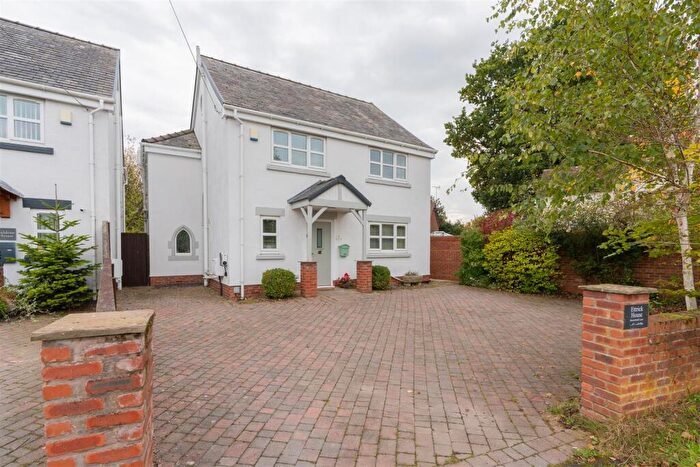
Properties in Tarvin And Kelsall have an average house price of £391,030.00 and had 118 Property Transactions within the last 3 years¹.
Tarvin And Kelsall is an area in Chester, Cheshire with 1,142 households², where the most expensive property was sold for £1,800,000.00.
Properties for sale in Tarvin And Kelsall
Roads and Postcodes in Tarvin And Kelsall
Navigate through our locations to find the location of your next house in Tarvin And Kelsall, Chester for sale or to rent.
| Streets | Postcodes |
|---|---|
| Andrews Close | CH3 8LN |
| Arden Close | CH3 8JN |
| Barrow Lane | CH3 8JF |
| Brereton Close | CH3 8HW |
| Broom Crescent | CH3 8HA |
| Broomheath Lane | CH3 8HB CH3 8HD CH3 8HE CH3 8HF |
| By Pass Road | CH3 8EF |
| Church Street | CH3 8EB CH3 8NA |
| Corkscrew Lane | CH3 9BX |
| Coronation Villas | CH3 8JE |
| Cross Lanes | CH3 8HS CH3 8NG CH3 8NJ CH3 8NQ |
| Crossfields | CH3 8EP CH3 8EW CH3 8LG CH3 8LQ |
| Deans Close | CH3 8ND |
| Deans Way | CH3 8LX |
| Fairfax Avenue | CH3 8DR |
| Field Close | CH3 8DL |
| Field Lane | CH3 8LF |
| Gamul Court | CH3 8HX |
| Gowy Crescent | CH3 8LZ |
| Grosvenor Road | CH3 8EH |
| Hallfields Road | CH3 8ET CH3 8LL |
| Heath Close | CH3 8LT |
| Heath Drive | CH3 8EZ CH3 8LS |
| High Street | CH3 8ED CH3 8EE CH3 8JA CH3 8JB |
| Hockenhull Avenue | CH3 8LP CH3 8LR CH3 8LW |
| Hockenhull Crescent | CH3 8LJ |
| Hockenhull Lane | CH3 8LA CH3 8LB CH3 8LD |
| Holme Street | CH3 8EJ CH3 8EQ |
| Hoofield Road | CH3 9BL CH3 9BN |
| Hunters Crescent | CH3 8EY |
| Hunters Drive | CH3 8EX |
| Kelsall Road | CH3 8JD CH3 8NR |
| Langford Court | CH3 8NT |
| Lichfield Mews | CH3 8JL |
| Meadow Close | CH3 8LY |
| Millside Close | CH3 8DN |
| Moreton Croft | CH3 8DY |
| Old Moss Lane | CH3 8HN |
| Park Close | CH3 8DZ |
| Pitts Close | CH3 8EU |
| Platts Lane | CH3 8HP CH3 8HR CH3 8LH |
| Pool Lane | CH3 8JY |
| Radcliffe Close | CH3 8JT |
| Sandford Drive | CH3 8DP |
| Sandy Lane | CH3 8JQ |
| Shay Lane | CH3 8NN CH3 8NW |
| Sheaf Close | CH3 8JZ |
| Sheaf Farm Court | CH3 8HG |
| Tarporley Road | CH3 8ER CH3 8NB CH3 8NF |
| The Pryors | CH3 8JP |
| The Ridgeway | CH3 8JR CH3 8JW |
| Willington Road | CH3 8NL |
| CH3 8JX |
Transport near Tarvin And Kelsall
- FAQ
- Price Paid By Year
- Property Type Price
Frequently asked questions about Tarvin And Kelsall
What is the average price for a property for sale in Tarvin And Kelsall?
The average price for a property for sale in Tarvin And Kelsall is £391,030. This amount is 26% higher than the average price in Chester. There are 523 property listings for sale in Tarvin And Kelsall.
What streets have the most expensive properties for sale in Tarvin And Kelsall?
The streets with the most expensive properties for sale in Tarvin And Kelsall are Kelsall Road at an average of £782,500, Barrow Lane at an average of £700,000 and Willington Road at an average of £600,000.
What streets have the most affordable properties for sale in Tarvin And Kelsall?
The streets with the most affordable properties for sale in Tarvin And Kelsall are Fairfax Avenue at an average of £142,375, Brereton Close at an average of £202,875 and Sheaf Close at an average of £213,800.
Which train stations are available in or near Tarvin And Kelsall?
Some of the train stations available in or near Tarvin And Kelsall are Mouldsworth, Delamere and Chester.
Property Price Paid in Tarvin And Kelsall by Year
The average sold property price by year was:
| Year | Average Sold Price | Price Change |
Sold Properties
|
|---|---|---|---|
| 2025 | £396,492 | 8% |
32 Properties |
| 2024 | £364,073 | -13% |
41 Properties |
| 2023 | £411,707 | 23% |
45 Properties |
| 2022 | £318,700 | -2% |
45 Properties |
| 2021 | £325,080 | -3% |
58 Properties |
| 2020 | £335,845 | 17% |
39 Properties |
| 2019 | £277,410 | -11% |
56 Properties |
| 2018 | £306,786 | 9% |
41 Properties |
| 2017 | £278,087 | -20% |
40 Properties |
| 2016 | £332,466 | 12% |
59 Properties |
| 2015 | £292,579 | 7% |
44 Properties |
| 2014 | £271,642 | -13% |
65 Properties |
| 2013 | £307,289 | 14% |
51 Properties |
| 2012 | £263,810 | 5% |
37 Properties |
| 2011 | £251,522 | -21% |
20 Properties |
| 2010 | £304,798 | 28% |
37 Properties |
| 2009 | £218,490 | -25% |
35 Properties |
| 2008 | £272,795 | 1% |
36 Properties |
| 2007 | £271,246 | 1% |
57 Properties |
| 2006 | £267,310 | 5% |
40 Properties |
| 2005 | £252,827 | 4% |
38 Properties |
| 2004 | £243,259 | 10% |
45 Properties |
| 2003 | £219,142 | 25% |
45 Properties |
| 2002 | £164,269 | 9% |
61 Properties |
| 2001 | £148,736 | 15% |
50 Properties |
| 2000 | £126,620 | 11% |
45 Properties |
| 1999 | £113,111 | 17% |
58 Properties |
| 1998 | £93,503 | 17% |
60 Properties |
| 1997 | £77,430 | -7% |
41 Properties |
| 1996 | £83,223 | 11% |
55 Properties |
| 1995 | £74,003 | - |
37 Properties |
Property Price per Property Type in Tarvin And Kelsall
Here you can find historic sold price data in order to help with your property search.
The average Property Paid Price for specific property types in the last three years are:
| Property Type | Average Sold Price | Sold Properties |
|---|---|---|
| Semi Detached House | £323,647.00 | 39 Semi Detached Houses |
| Detached House | £516,265.00 | 50 Detached Houses |
| Terraced House | £270,467.00 | 28 Terraced Houses |
| Flat | £133,000.00 | 1 Flat |

