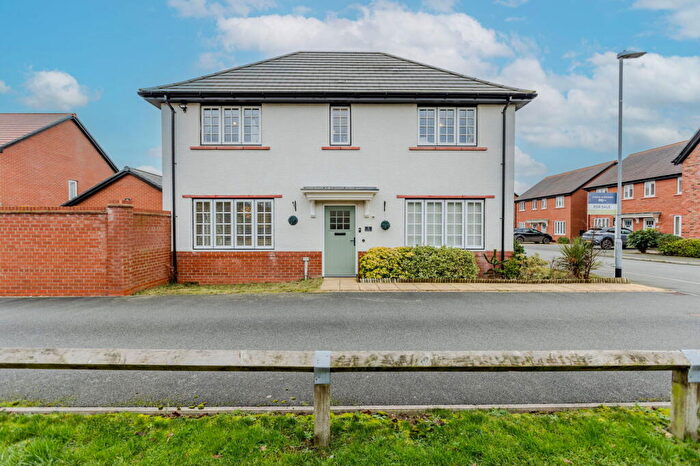
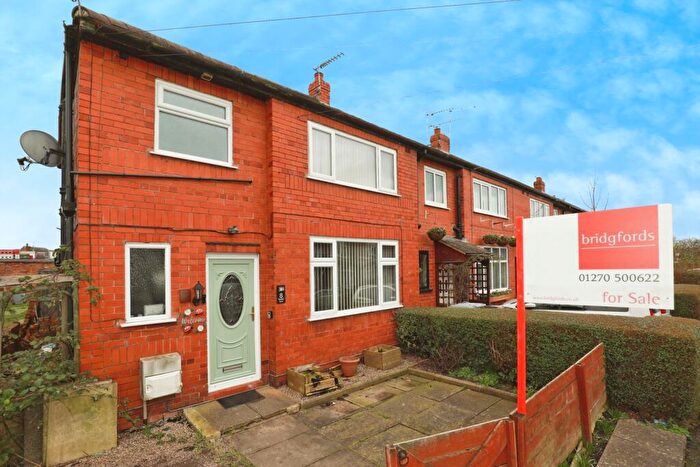
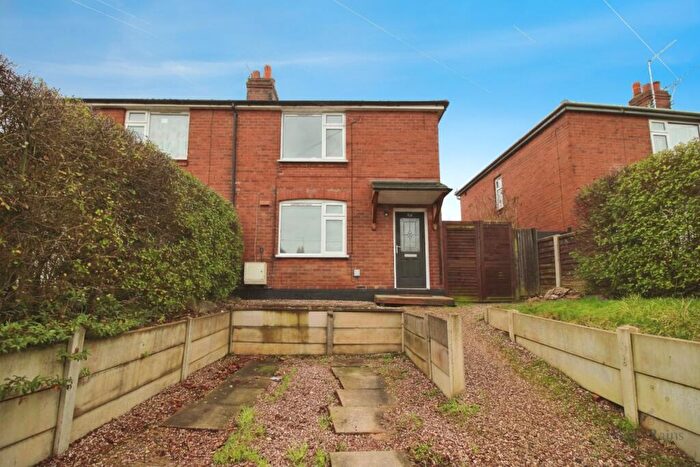
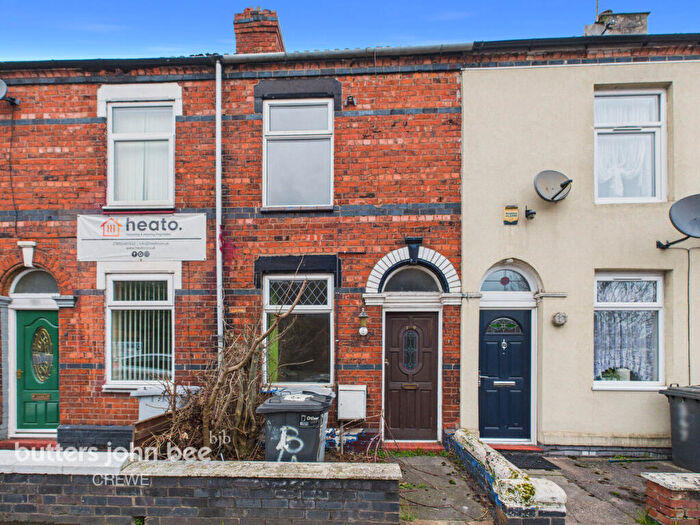
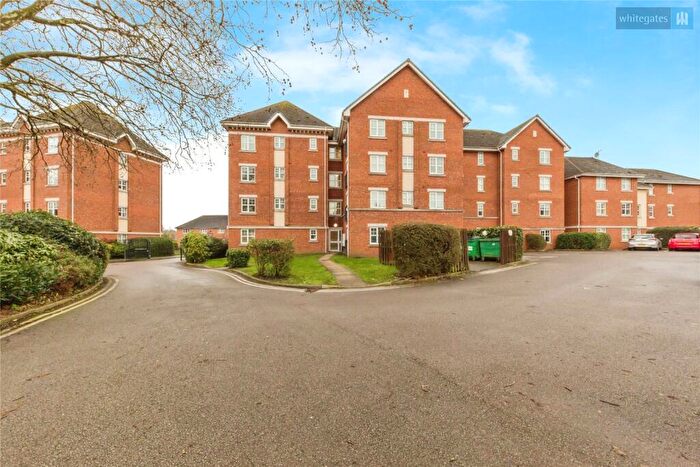
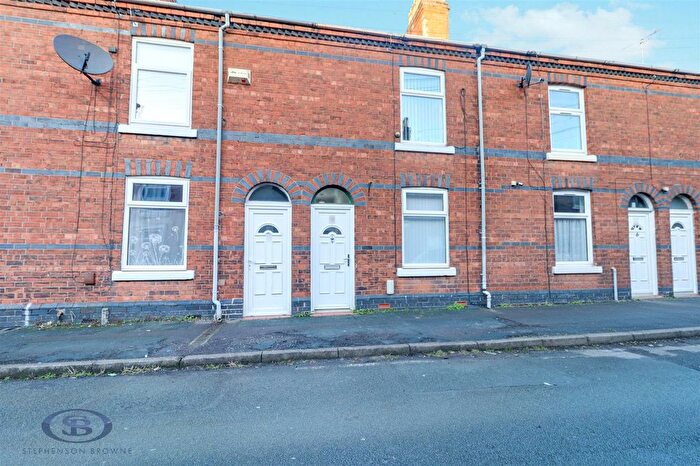
Houses for sale & to rent in Crewe St Barnabas, Crewe
House Prices in Crewe St Barnabas
Properties in Crewe St Barnabas have an average house price of £136,631.00 and had 182 Property Transactions within the last 3 years¹.
Crewe St Barnabas is an area in Crewe, Cheshire with 2,316 households², where the most expensive property was sold for £290,000.00.
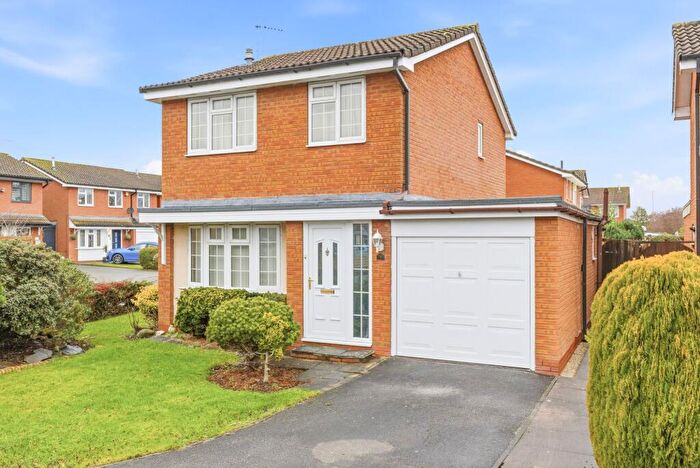
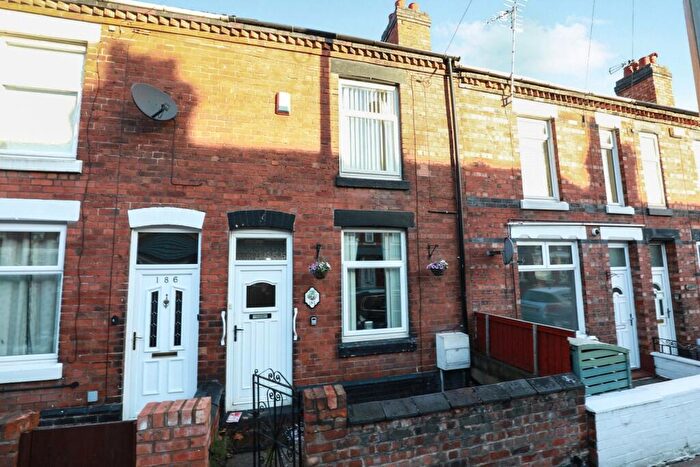
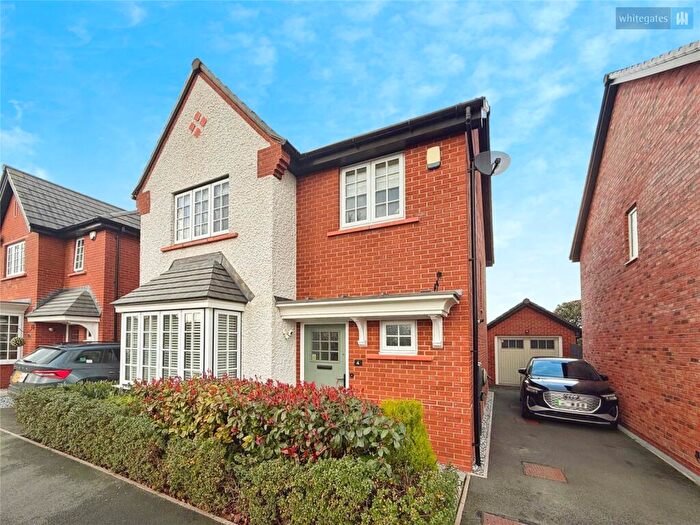
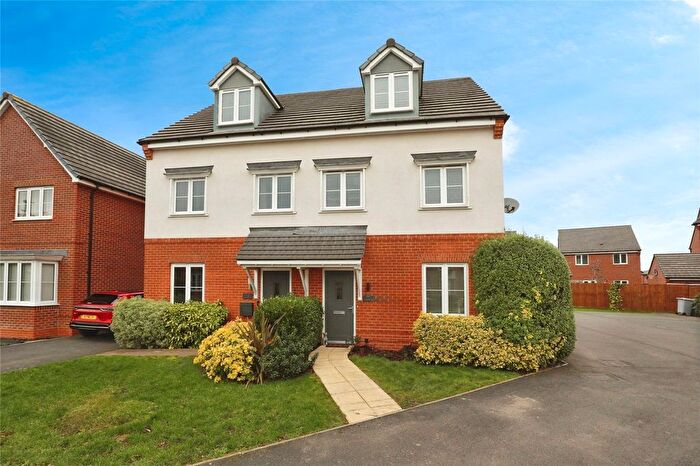
Properties for sale in Crewe St Barnabas
Roads and Postcodes in Crewe St Barnabas
Navigate through our locations to find the location of your next house in Crewe St Barnabas, Crewe for sale or to rent.
| Streets | Postcodes |
|---|---|
| Alder Drive | CW1 3GR |
| Ashbank Place | CW1 3FR |
| Badger Avenue | CW1 3LJ CW1 3LN CW1 3LP CW1 3LW CW1 3LL |
| Barnabas Avenue | CW1 3NS |
| Barnato Close | CW1 3GH |
| Benjafield Court | CW1 3GL |
| Bowen Cooke Avenue | CW1 3NR CW1 3NP |
| Brooklands Grove | CW1 3JS |
| Broom Street | CW1 3LG |
| Chassagne Square | CW1 3GJ |
| Clement Drive | CW1 3GN |
| Darlington Avenue | CW1 3NN |
| Eleanor Close | CW1 3GZ |
| Fallowfield Court | CW1 3LR |
| Falmouth Road | CW1 3QS |
| Foulkes Avenue | CW1 3NA |
| Frank Webb Avenue | CW1 3NE CW1 3NH CW1 3NQ CW1 3NF CW1 3NG |
| Glover Street | CW1 3LD |
| Goulden Street | CW1 3LA CW1 3LB |
| Hulme Street | CW1 3PB |
| Kettell Avenue | CW1 3NJ CW1 3NL |
| Kidston Drive | CW1 3GG |
| Linnet Close | CW1 3WF |
| Mayfield Mews | CW1 3FZ |
| Mcneill Avenue | CW1 3NT CW1 3NW |
| Minshull New Road | CW1 3PD CW1 3PE CW1 3PF CW1 3PG CW1 3PN CW1 3PW |
| Monks Lane | CW1 3PH CW1 3PQ |
| Newcastle Street | CW1 3LF |
| Pyms Lane | CW1 3PJ CW1 3PL |
| Railton Avenue | CW1 3QH |
| Redwood Drive | CW1 3GS |
| Rolls Avenue | CW1 3FT CW1 3FW CW1 3GE CW1 3QB CW1 3QD CW1 3QE |
| Rowans Close | CW1 3GQ |
| Royce Close | CW1 3QJ |
| Rubin Drive | CW1 3GF |
| Sandiway Road | CW1 3QR |
| Sidings Close | CW1 3HW |
| Skylark Close | CW1 3WE |
| Smith Grove | CW1 3ND CW1 3NB |
| Sunnybank Road | CW2 8WD |
| Timbrell Avenue | CW1 3LU CW1 3LX CW1 3LY CW1 3LZ |
| Underwood Industrial Estate | CW1 3TJ |
| Underwood Lane | CW1 3JP CW1 3JR CW1 3JZ CW1 3LE CW1 3SA |
| West Street | CW1 3HU CW1 3HY CW1 3HZ CW1 3PA |
| Westbourne Avenue | CW1 3QP |
| Wheelman Road | CW1 3QL CW1 3QN |
| Windsor Avenue | CW1 3QT |
Transport near Crewe St Barnabas
- FAQ
- Price Paid By Year
- Property Type Price
Frequently asked questions about Crewe St Barnabas
What is the average price for a property for sale in Crewe St Barnabas?
The average price for a property for sale in Crewe St Barnabas is £136,631. This amount is 41% lower than the average price in Crewe. There are 1,485 property listings for sale in Crewe St Barnabas.
What streets have the most expensive properties for sale in Crewe St Barnabas?
The streets with the most expensive properties for sale in Crewe St Barnabas are Kidston Drive at an average of £277,000, Rubin Drive at an average of £274,125 and Clement Drive at an average of £243,333.
What streets have the most affordable properties for sale in Crewe St Barnabas?
The streets with the most affordable properties for sale in Crewe St Barnabas are West Street at an average of £91,411, Hulme Street at an average of £94,833 and Broom Street at an average of £98,000.
Which train stations are available in or near Crewe St Barnabas?
Some of the train stations available in or near Crewe St Barnabas are Crewe, Nantwich and Sandbach.
Property Price Paid in Crewe St Barnabas by Year
The average sold property price by year was:
| Year | Average Sold Price | Price Change |
Sold Properties
|
|---|---|---|---|
| 2025 | £160,788 | 21% |
52 Properties |
| 2024 | £126,488 | -1% |
83 Properties |
| 2023 | £127,818 | -7% |
47 Properties |
| 2022 | £136,542 | 7% |
58 Properties |
| 2021 | £126,615 | 13% |
79 Properties |
| 2020 | £109,816 | 6% |
56 Properties |
| 2019 | £102,837 | -2% |
64 Properties |
| 2018 | £104,597 | -2% |
67 Properties |
| 2017 | £106,469 | -4% |
95 Properties |
| 2016 | £110,910 | 13% |
86 Properties |
| 2015 | £95,981 | 3% |
81 Properties |
| 2014 | £92,833 | 6% |
56 Properties |
| 2013 | £87,441 | -3% |
48 Properties |
| 2012 | £89,804 | 7% |
51 Properties |
| 2011 | £83,398 | -21% |
43 Properties |
| 2010 | £101,132 | 2% |
35 Properties |
| 2009 | £99,289 | -24% |
48 Properties |
| 2008 | £122,998 | 16% |
61 Properties |
| 2007 | £103,255 | -0,2% |
111 Properties |
| 2006 | £103,433 | 3% |
115 Properties |
| 2005 | £100,253 | 3% |
172 Properties |
| 2004 | £97,730 | 15% |
282 Properties |
| 2003 | £83,444 | 56% |
135 Properties |
| 2002 | £36,747 | 15% |
93 Properties |
| 2001 | £31,146 | 8% |
75 Properties |
| 2000 | £28,656 | -5% |
51 Properties |
| 1999 | £30,161 | 1% |
52 Properties |
| 1998 | £29,872 | 8% |
43 Properties |
| 1997 | £27,464 | -4% |
49 Properties |
| 1996 | £28,691 | 1% |
34 Properties |
| 1995 | £28,537 | - |
43 Properties |
Property Price per Property Type in Crewe St Barnabas
Here you can find historic sold price data in order to help with your property search.
The average Property Paid Price for specific property types in the last three years are:
| Property Type | Average Sold Price | Sold Properties |
|---|---|---|
| Semi Detached House | £146,986.00 | 55 Semi Detached Houses |
| Detached House | £233,375.00 | 12 Detached Houses |
| Terraced House | £121,512.00 | 78 Terraced Houses |
| Flat | £121,737.00 | 37 Flats |

