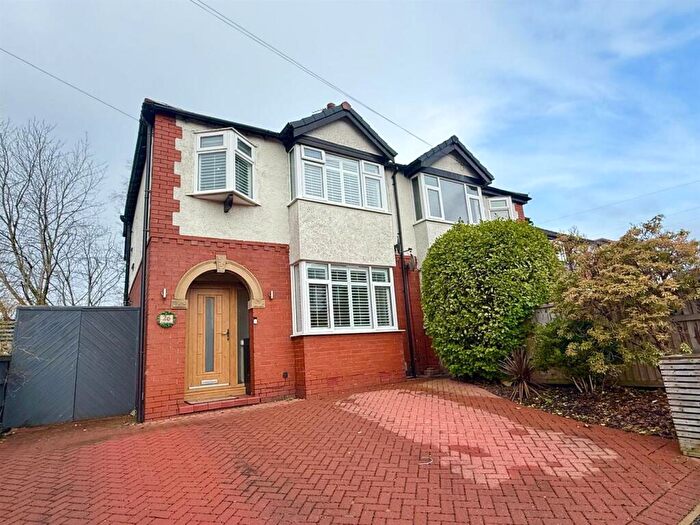
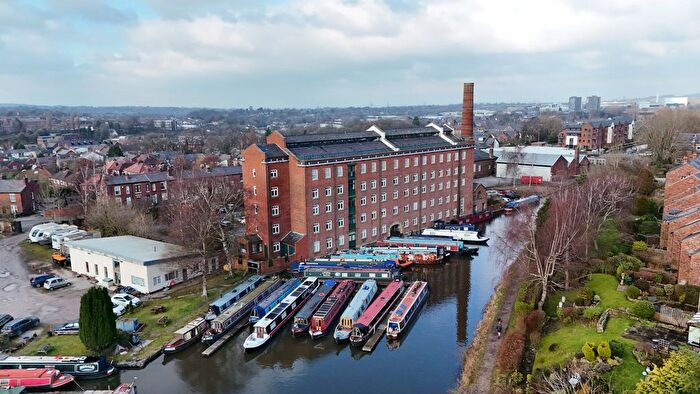
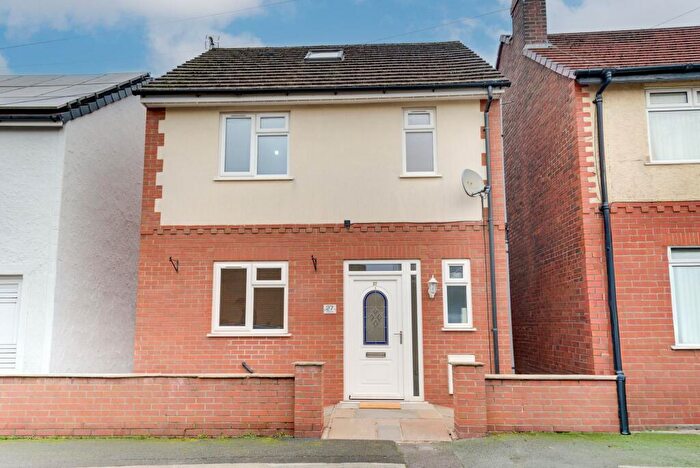
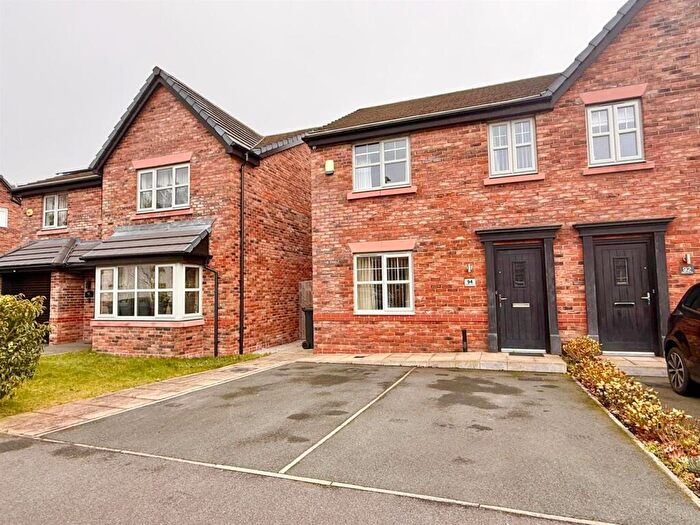
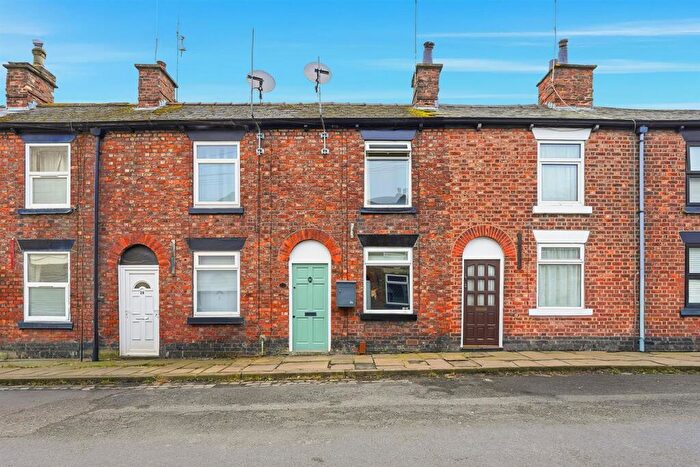
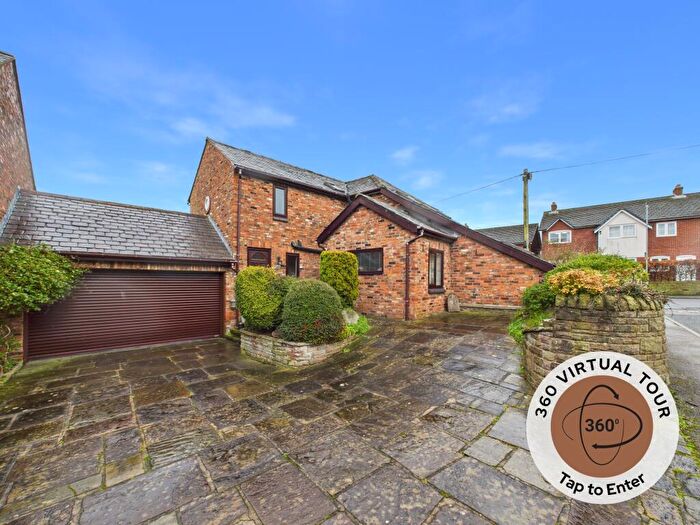
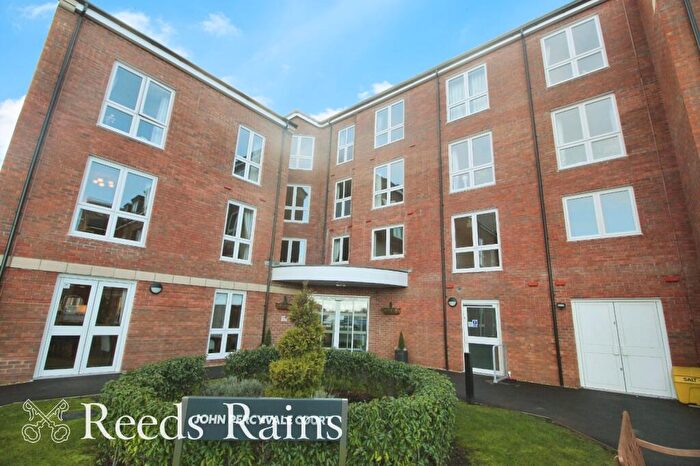
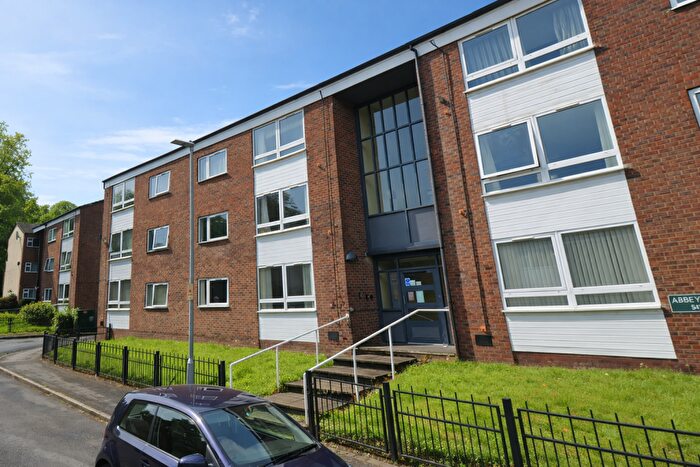
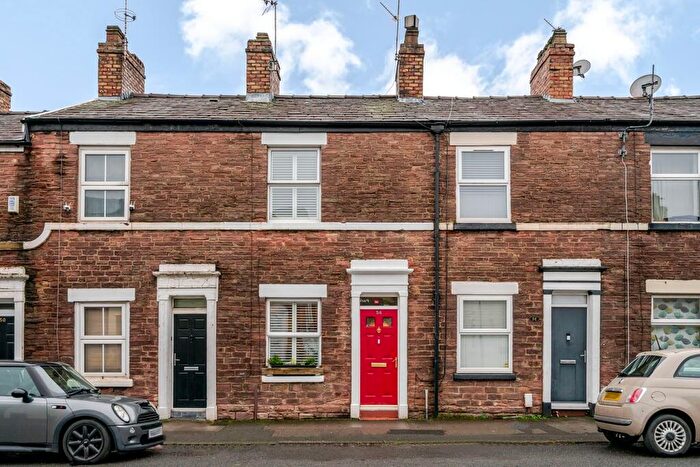
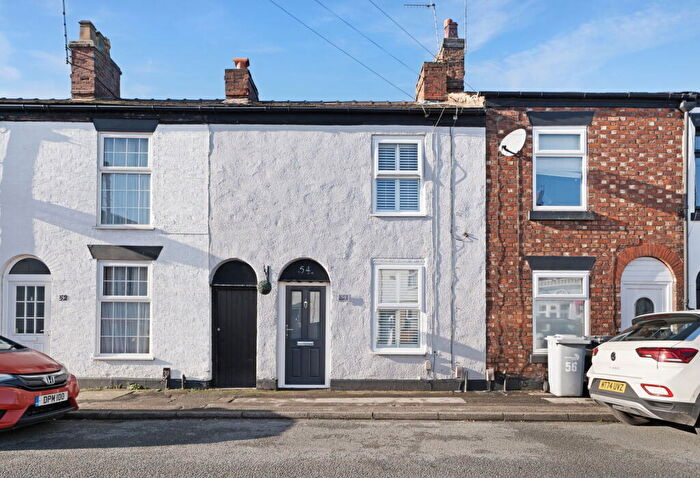
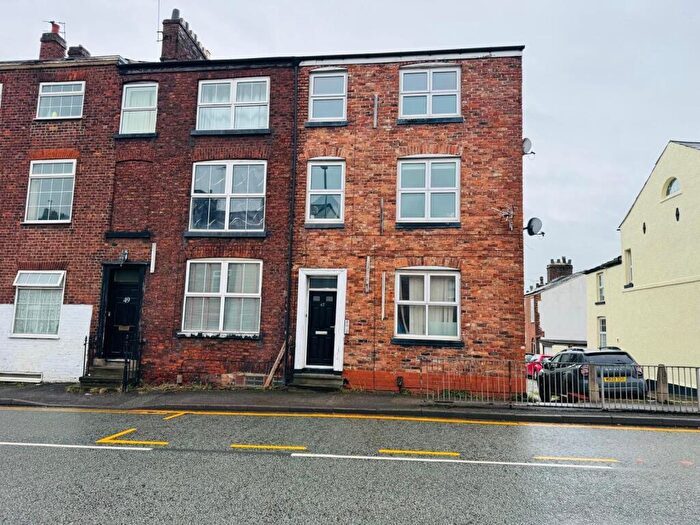
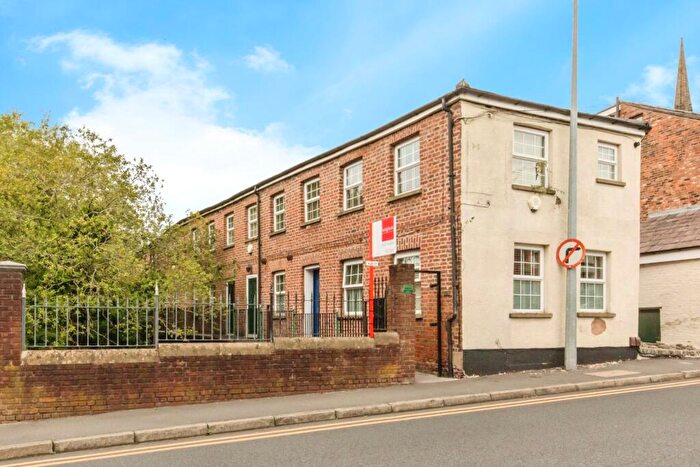
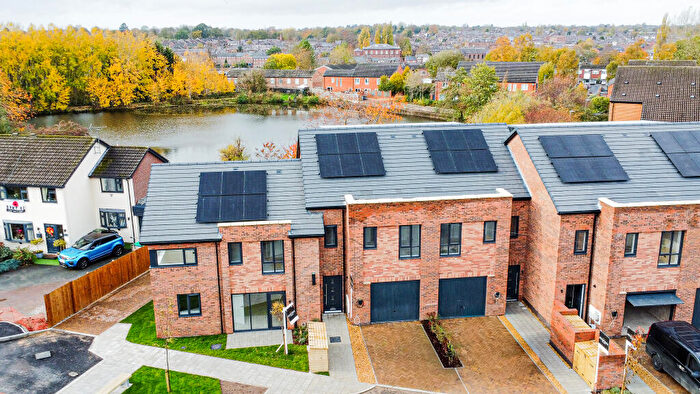
Houses for sale & to rent in Macclesfield Central, Macclesfield
House Prices in Macclesfield Central
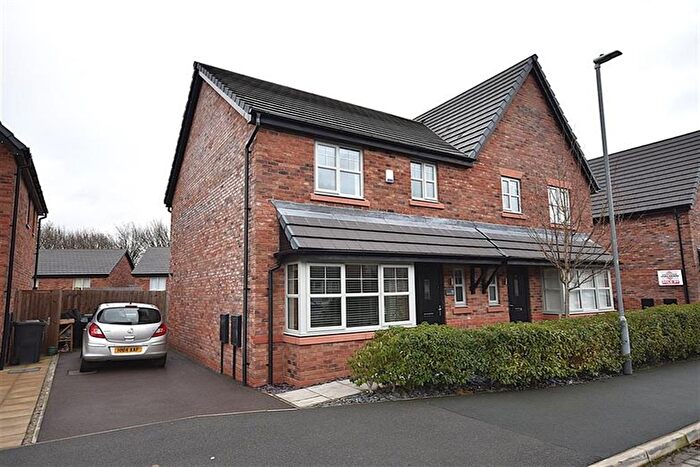
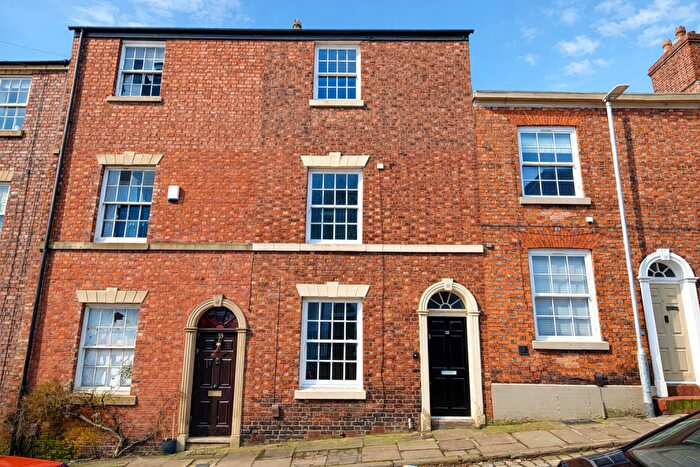
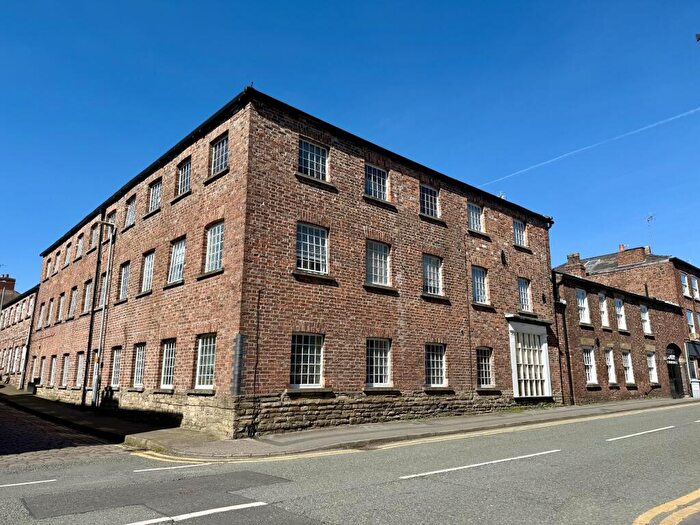
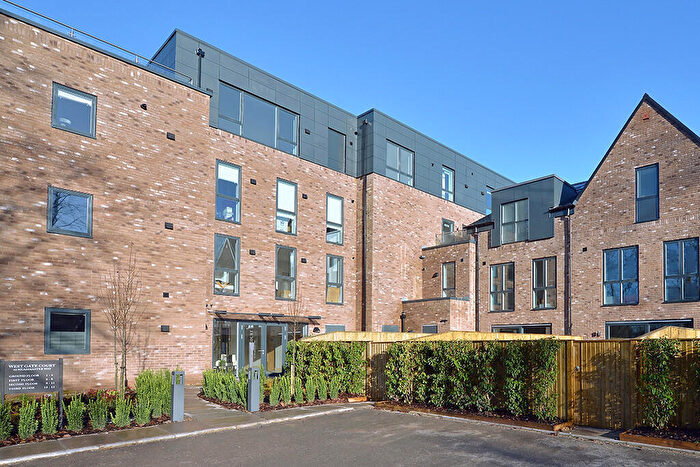
Properties in Macclesfield Central have an average house price of £214,128.00 and had 637 Property Transactions within the last 3 years¹.
Macclesfield Central is an area in Macclesfield, Cheshire with 4,483 households², where the most expensive property was sold for £680,000.00.
Properties for sale in Macclesfield Central
Roads and Postcodes in Macclesfield Central
Navigate through our locations to find the location of your next house in Macclesfield Central, Macclesfield for sale or to rent.
Transport near Macclesfield Central
- FAQ
- Price Paid By Year
- Property Type Price
Frequently asked questions about Macclesfield Central
What is the average price for a property for sale in Macclesfield Central?
The average price for a property for sale in Macclesfield Central is £214,128. This amount is 40% lower than the average price in Macclesfield. There are 2,635 property listings for sale in Macclesfield Central.
What streets have the most expensive properties for sale in Macclesfield Central?
The streets with the most expensive properties for sale in Macclesfield Central are Whalley Hayes at an average of £630,000, Ryles Close at an average of £602,500 and College Court at an average of £558,750.
What streets have the most affordable properties for sale in Macclesfield Central?
The streets with the most affordable properties for sale in Macclesfield Central are Simpsons Court at an average of £69,000, Church Street at an average of £71,000 and Millers Court at an average of £82,661.
Which train stations are available in or near Macclesfield Central?
Some of the train stations available in or near Macclesfield Central are Macclesfield, Prestbury and Adlington (Cheshire).
Property Price Paid in Macclesfield Central by Year
The average sold property price by year was:
| Year | Average Sold Price | Price Change |
Sold Properties
|
|---|---|---|---|
| 2025 | £225,432 | 3% |
208 Properties |
| 2024 | £218,465 | 9% |
220 Properties |
| 2023 | £198,313 | 11% |
209 Properties |
| 2022 | £177,261 | -5% |
337 Properties |
| 2021 | £185,690 | 5% |
363 Properties |
| 2020 | £177,144 | 4% |
219 Properties |
| 2019 | £169,637 | -4% |
241 Properties |
| 2018 | £176,239 | 15% |
267 Properties |
| 2017 | £148,974 | 3% |
267 Properties |
| 2016 | £144,824 | 4% |
268 Properties |
| 2015 | £138,782 | 7% |
295 Properties |
| 2014 | £129,758 | -4% |
223 Properties |
| 2013 | £134,899 | 6% |
198 Properties |
| 2012 | £126,576 | -0,5% |
148 Properties |
| 2011 | £127,146 | -8% |
132 Properties |
| 2010 | £137,602 | 10% |
118 Properties |
| 2009 | £124,145 | -10% |
138 Properties |
| 2008 | £136,177 | -9% |
160 Properties |
| 2007 | £148,273 | 8% |
393 Properties |
| 2006 | £135,980 | 7% |
395 Properties |
| 2005 | £126,211 | 0,2% |
297 Properties |
| 2004 | £125,917 | 21% |
387 Properties |
| 2003 | £98,997 | 16% |
374 Properties |
| 2002 | £83,421 | 15% |
481 Properties |
| 2001 | £71,163 | -4% |
366 Properties |
| 2000 | £73,663 | 22% |
402 Properties |
| 1999 | £57,280 | 12% |
420 Properties |
| 1998 | £50,586 | 8% |
298 Properties |
| 1997 | £46,694 | 2% |
247 Properties |
| 1996 | £45,579 | -4% |
279 Properties |
| 1995 | £47,537 | - |
215 Properties |
Property Price per Property Type in Macclesfield Central
Here you can find historic sold price data in order to help with your property search.
The average Property Paid Price for specific property types in the last three years are:
| Property Type | Average Sold Price | Sold Properties |
|---|---|---|
| Semi Detached House | £279,954.00 | 88 Semi Detached Houses |
| Detached House | £401,046.00 | 34 Detached Houses |
| Terraced House | £203,042.00 | 419 Terraced Houses |
| Flat | £135,976.00 | 96 Flats |

