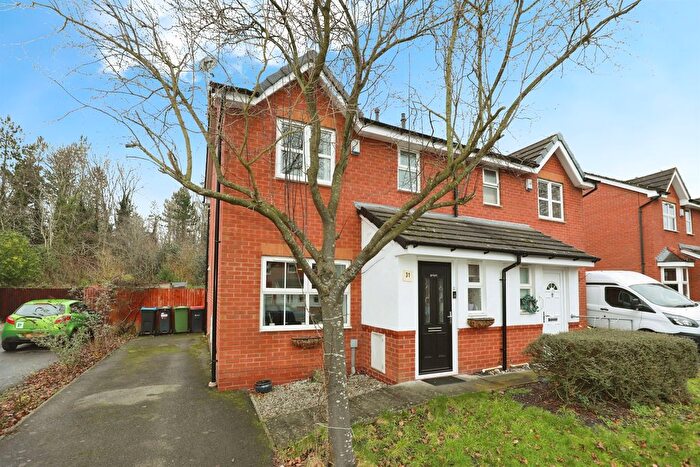
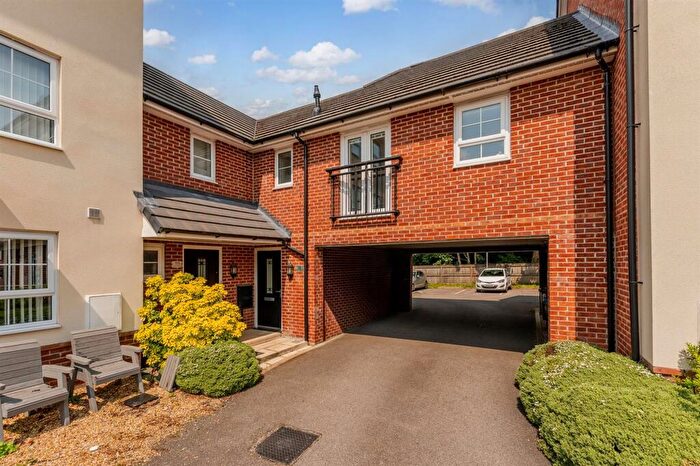
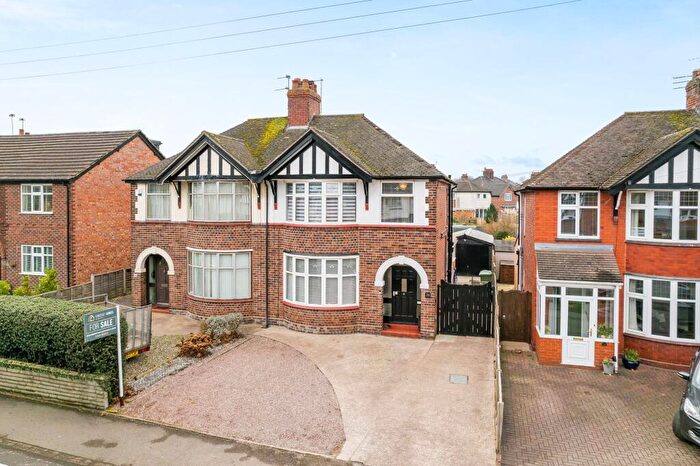
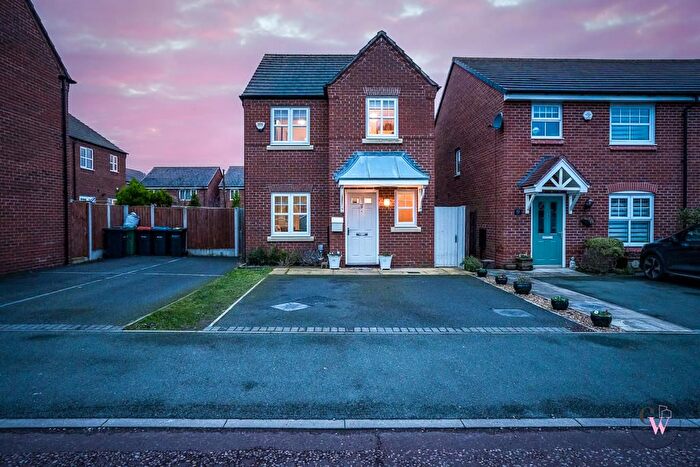
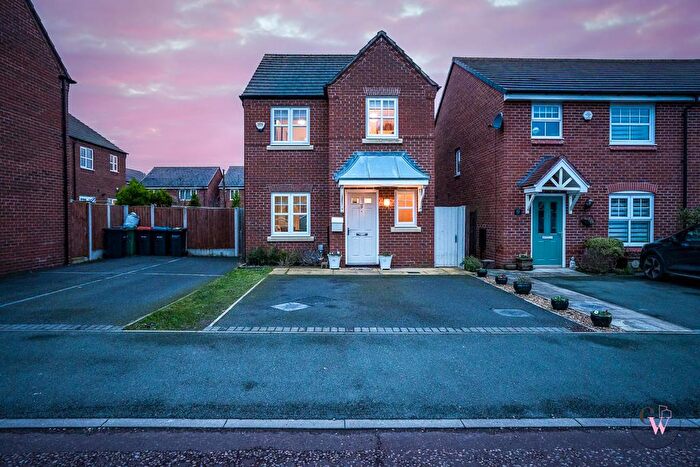
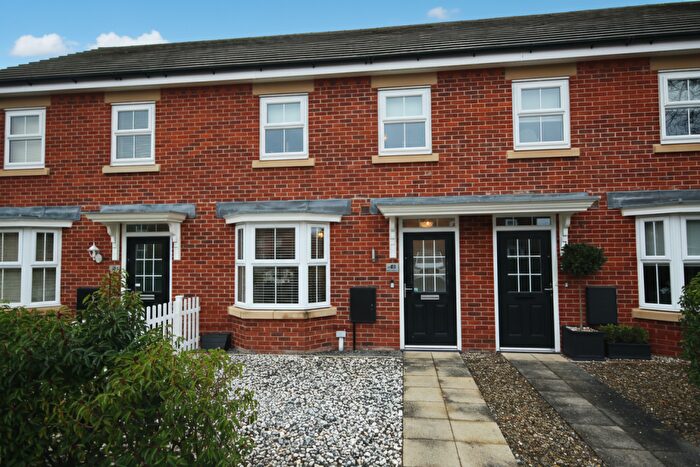
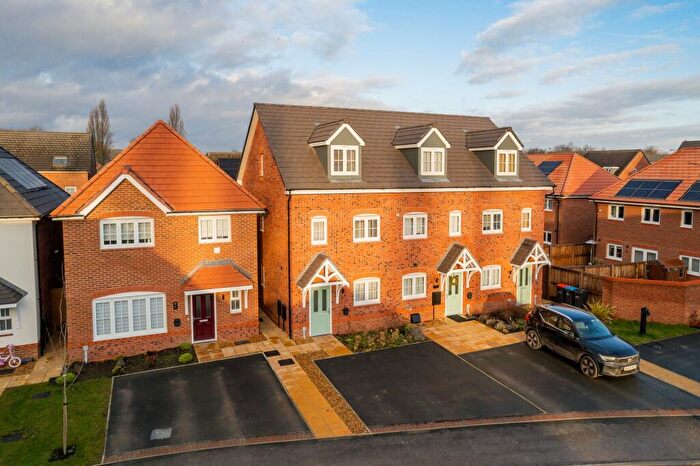
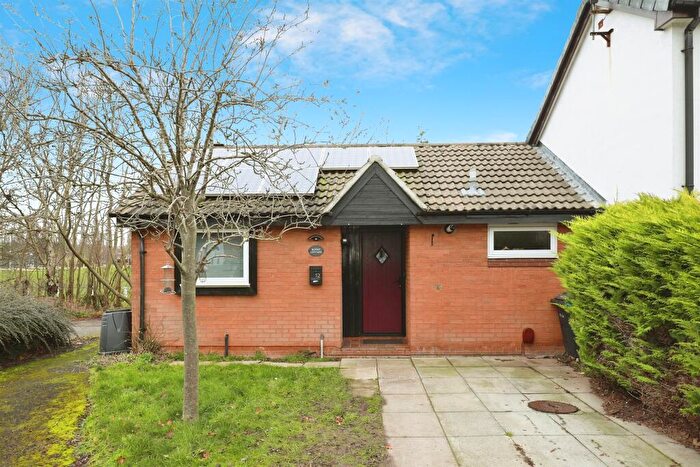
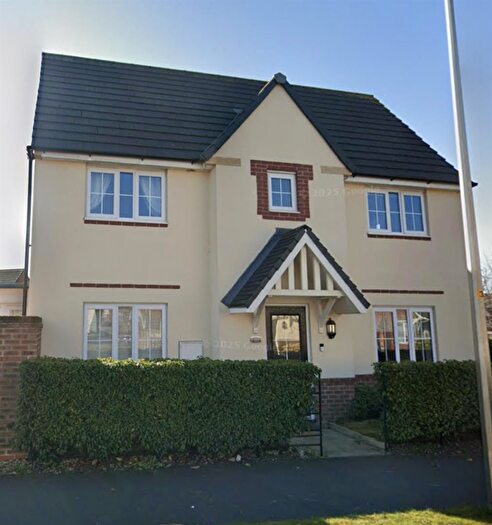
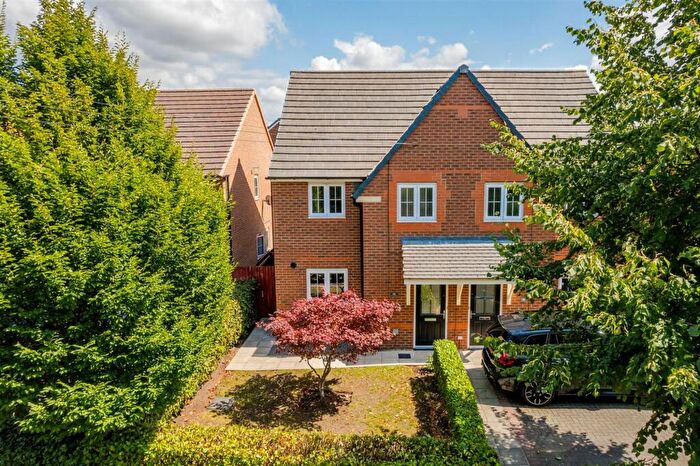
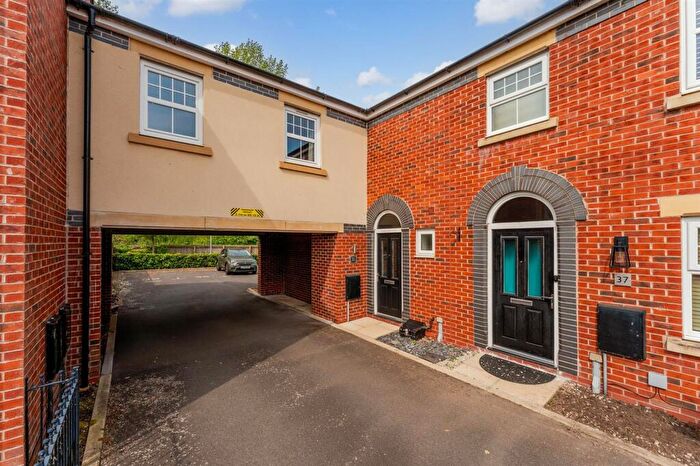
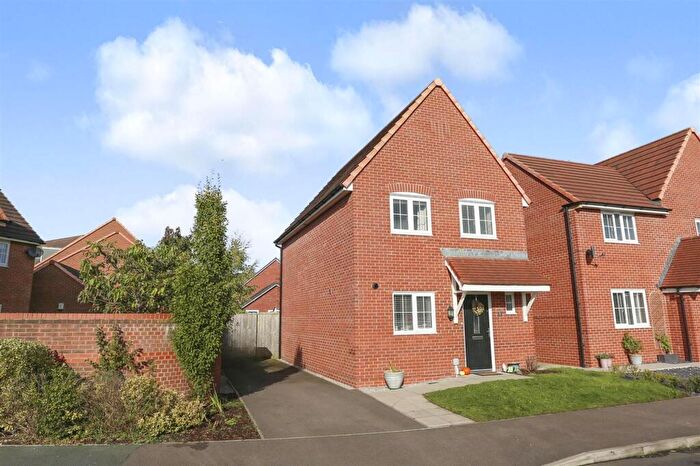
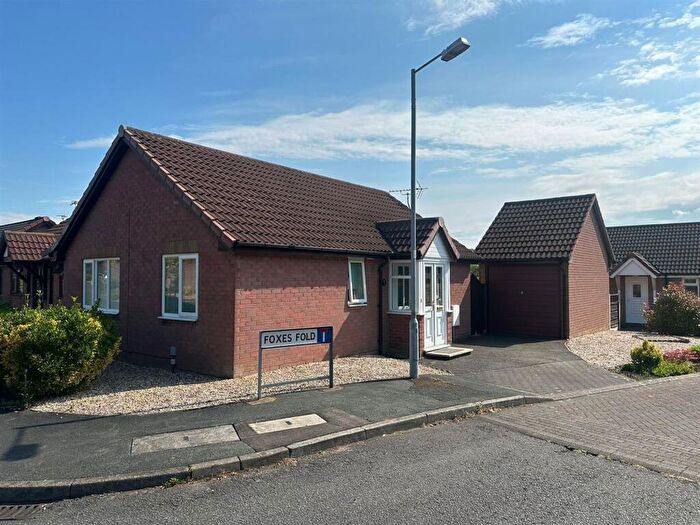
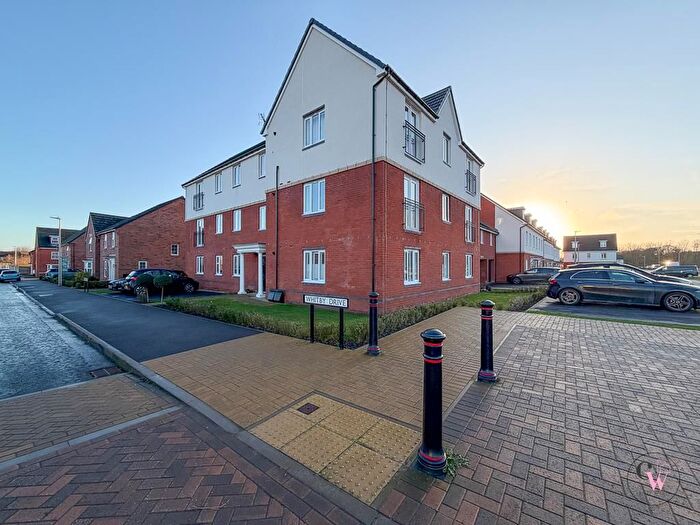
Houses for sale & to rent in Northwich Winnington & Castle, Northwich
House Prices in Northwich Winnington & Castle
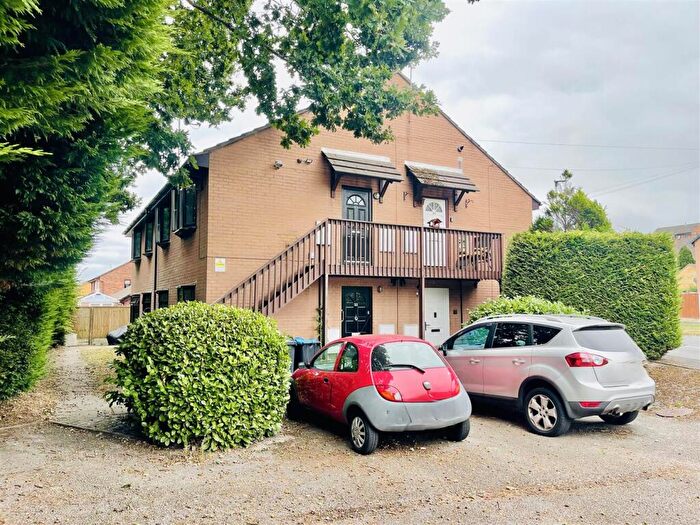
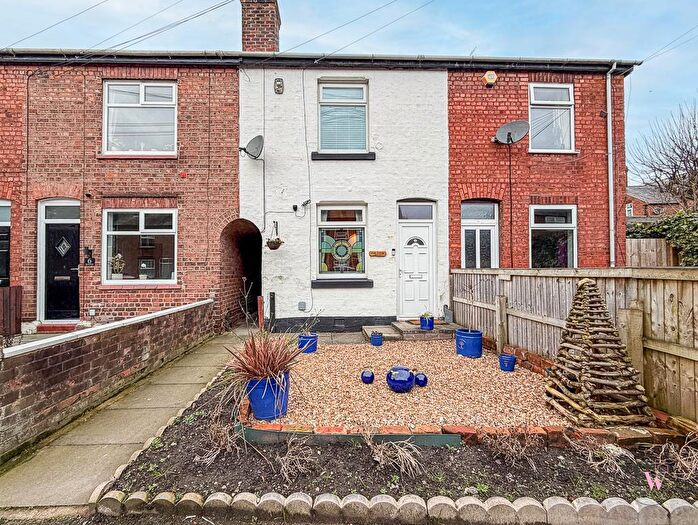
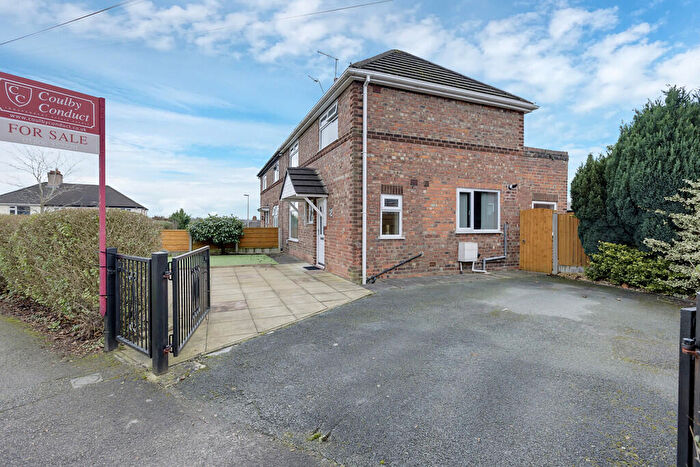
Properties in Northwich Winnington & Castle have an average house price of £240,511.00 and had 158 Property Transactions within the last 3 years¹.
Northwich Winnington & Castle is an area in Northwich, Cheshire with 57 households², where the most expensive property was sold for £411,300.00.
Properties for sale in Northwich Winnington & Castle
Roads and Postcodes in Northwich Winnington & Castle
Navigate through our locations to find the location of your next house in Northwich Winnington & Castle, Northwich for sale or to rent.
| Streets | Postcodes |
|---|---|
| Apple Tree Avenue | CW8 4UJ |
| Arnold Court | CW8 4UB |
| Barker Street | CW8 4ZJ |
| Bellevue Street | CW8 4GL |
| Bishops Way | CW8 4GE |
| Booth Grove | CW8 4DJ |
| Brassey Grange | CW8 4ZT |
| Brooke Avenue | CW8 4ZS |
| Buttercup Crescent | CW8 4EG |
| Butterworth Road | CW8 4YS CW8 4YT |
| Carey Green | CW8 4GF |
| Castle Street | CW8 1AB |
| Century Avenue | CW8 4FY |
| Chester Road | CW8 1EZ CW8 1HG CW8 1LE |
| Clark Drive | CW8 4ZQ |
| Curzon Avenue | CW8 4YU |
| Dahlia Crescent | CW8 4FB |
| Dane Close | CW8 4FD |
| Fielders Close | CW8 4FX |
| Fuchsia Road | CW8 4RQ |
| Gibson Close | CW8 4GN |
| Green Top Bank | CW8 4GG |
| Harper Close | CW8 4SU |
| Hitchen Street | CW8 4ZN |
| Imperial Avenue | CW8 4GB |
| Irving Street | CW8 4ZW |
| Jubilee Crescent | CW8 4GD |
| Leach Drive | CW8 4YW |
| Lilac Drive | CW8 4AQ CW8 4TH CW8 4TP CW8 4TT CW8 4TW CW8 4TY |
| Littler Close | CW8 4US |
| Locke Green | CW8 4ZD |
| Maiden Drive | CW8 4FJ |
| Mckenzie Crescent | CW8 4FA |
| Miller Close | CW8 4ZU |
| Muskett Drive | CW8 4YE CW8 4YP CW8 4YQ |
| Myerscough Street | CW8 4GH |
| Navigation Road | CW8 1BH |
| Outfield Chase | CW8 4FP |
| Park Road | CW8 4FF |
| Pleasant Street | CW8 1TP |
| Rathbones Place | CW8 1EU |
| Roman Way | CW8 4EF |
| Sandeman Crescent | CW8 4ZG |
| Saner Drive | CW8 4ZF |
| Saxons Lane | CW8 1LB |
| Snape Row | CW8 4YX |
| Sunflower Way | CW8 4RS |
| Telford Road | CW8 4YN |
| Violet Grove | CW8 4FG |
| Walker Road | CW8 4UD |
| Waterloo Road | CW8 1ED CW8 1EH |
| Western Way | CW8 4HN |
| Whitby Drive | CW8 4ZL |
| Wickets Lane | CW8 4FS |
| Williams Row | CW8 4ZH |
| Winnington Avenue | CW8 4EQ CW8 4FT |
| Winnington Hill | CW8 1AU CW8 1AW |
| Winnington Lane | CW8 4BE CW8 4DB CW8 4DT CW8 4DU CW8 4DZ CW8 4GW CW8 4GX CW8 4HJ CW8 4NT CW8 4UL |
| Winnington Street | CW8 1AF CW8 1AQ |
| CW8 4BP CW8 4FE CW8 4XP CW8 4DL |
Transport near Northwich Winnington & Castle
- FAQ
- Price Paid By Year
- Property Type Price
Frequently asked questions about Northwich Winnington & Castle
What is the average price for a property for sale in Northwich Winnington & Castle?
The average price for a property for sale in Northwich Winnington & Castle is £240,511. This amount is 14% lower than the average price in Northwich. There are 995 property listings for sale in Northwich Winnington & Castle.
What streets have the most expensive properties for sale in Northwich Winnington & Castle?
The streets with the most expensive properties for sale in Northwich Winnington & Castle are Mckenzie Crescent at an average of £336,500, Williams Row at an average of £322,500 and Brooke Avenue at an average of £312,400.
What streets have the most affordable properties for sale in Northwich Winnington & Castle?
The streets with the most affordable properties for sale in Northwich Winnington & Castle are Butterworth Road at an average of £155,468, Western Way at an average of £156,285 and Arnold Court at an average of £158,769.
Which train stations are available in or near Northwich Winnington & Castle?
Some of the train stations available in or near Northwich Winnington & Castle are Greenbank, Northwich and Hartford.
Property Price Paid in Northwich Winnington & Castle by Year
The average sold property price by year was:
| Year | Average Sold Price | Price Change |
Sold Properties
|
|---|---|---|---|
| 2025 | £244,810 | 6% |
59 Properties |
| 2024 | £230,336 | -7% |
49 Properties |
| 2023 | £245,410 | 4% |
50 Properties |
| 2022 | £235,480 | 13% |
76 Properties |
| 2021 | £204,539 | -1% |
143 Properties |
| 2020 | £206,038 | -6% |
116 Properties |
| 2019 | £218,561 | 7% |
157 Properties |
| 2018 | £203,439 | -2% |
181 Properties |
| 2017 | £207,434 | -7% |
172 Properties |
| 2016 | £221,657 | 7% |
132 Properties |
| 2015 | £206,295 | -2% |
115 Properties |
| 2014 | £209,829 | -38% |
29 Properties |
| 2012 | £289,950 | 55% |
1 Property |
| 2008 | £130,100 | -252% |
1 Property |
| 2007 | £458,000 | 71% |
1 Property |
| 2006 | £131,800 | -2% |
5 Properties |
| 2003 | £135,000 | 33% |
1 Property |
| 2001 | £90,000 | 71% |
2 Properties |
| 1997 | £26,000 | - |
1 Property |
Property Price per Property Type in Northwich Winnington & Castle
Here you can find historic sold price data in order to help with your property search.
The average Property Paid Price for specific property types in the last three years are:
| Property Type | Average Sold Price | Sold Properties |
|---|---|---|
| Semi Detached House | £251,770.00 | 41 Semi Detached Houses |
| Detached House | £334,826.00 | 33 Detached Houses |
| Terraced House | £236,080.00 | 50 Terraced Houses |
| Flat | £141,910.00 | 34 Flats |

