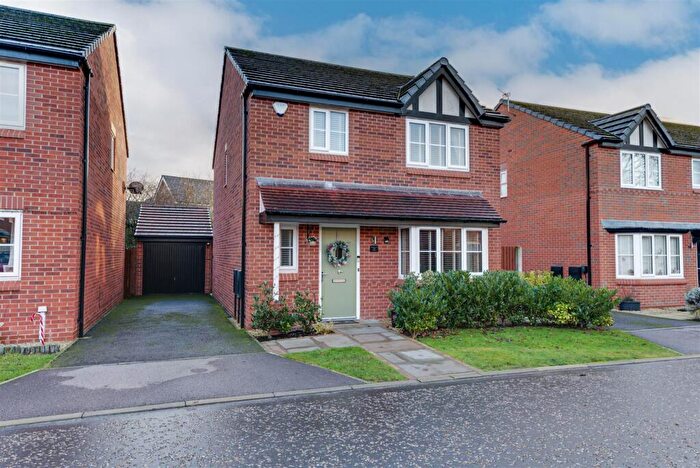
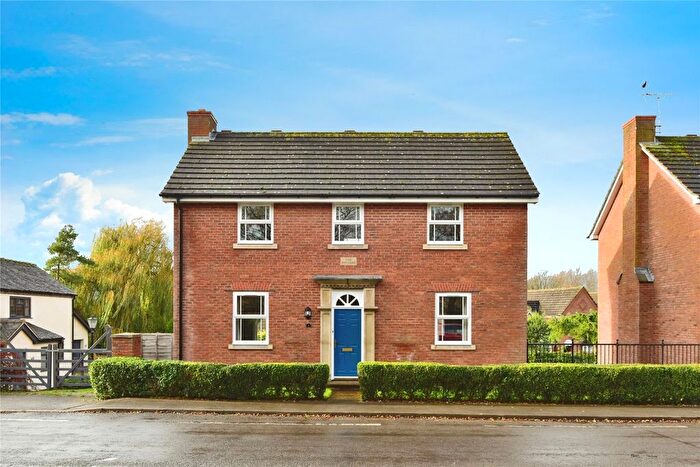
Houses for sale & to rent in Haslington, Sandbach
House Prices in Haslington
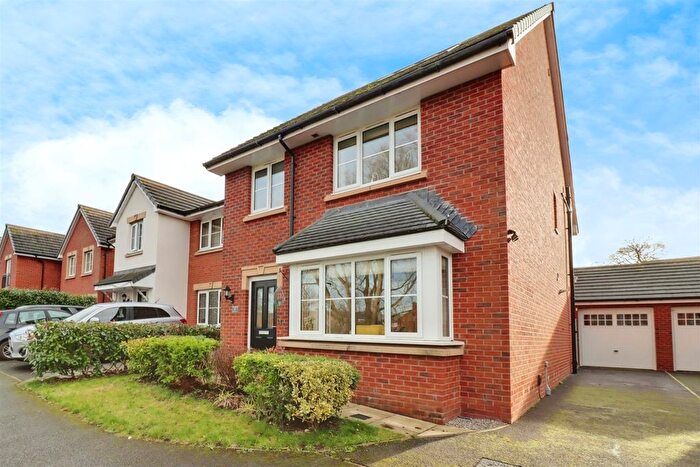
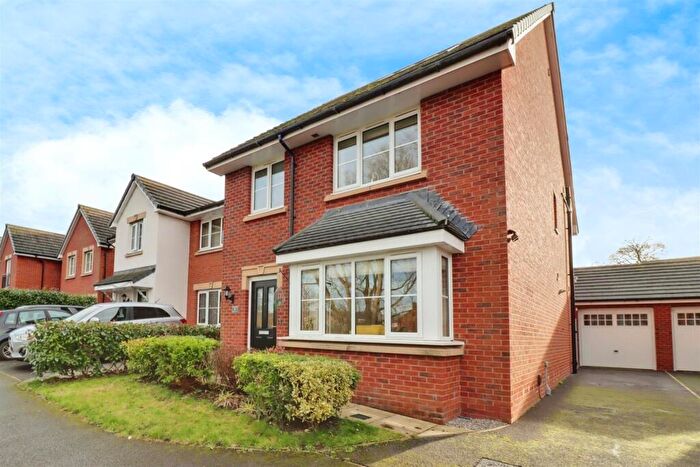
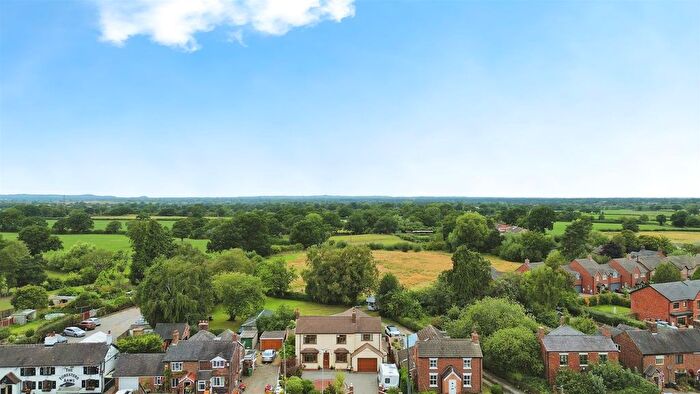
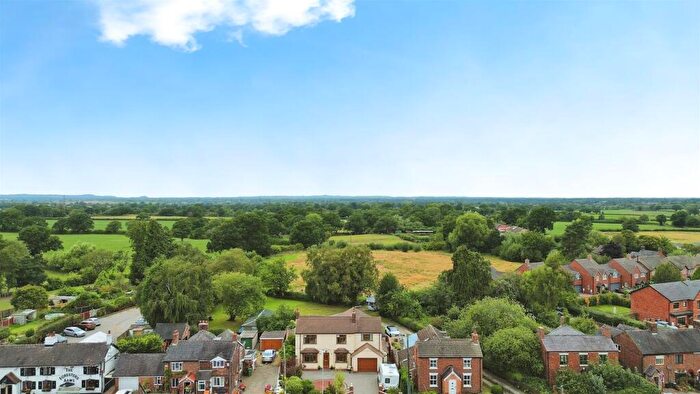
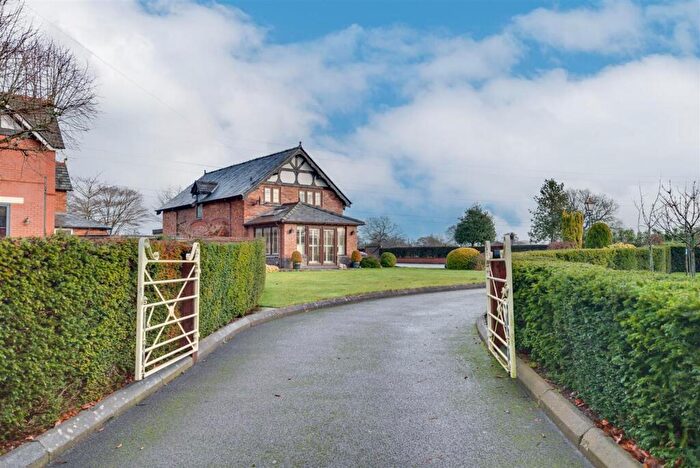
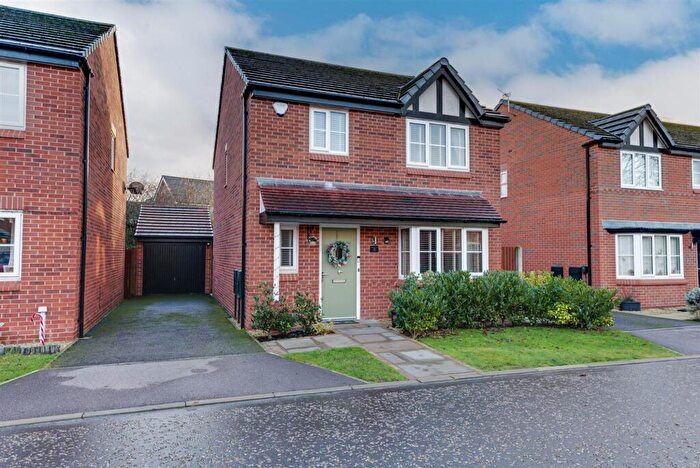
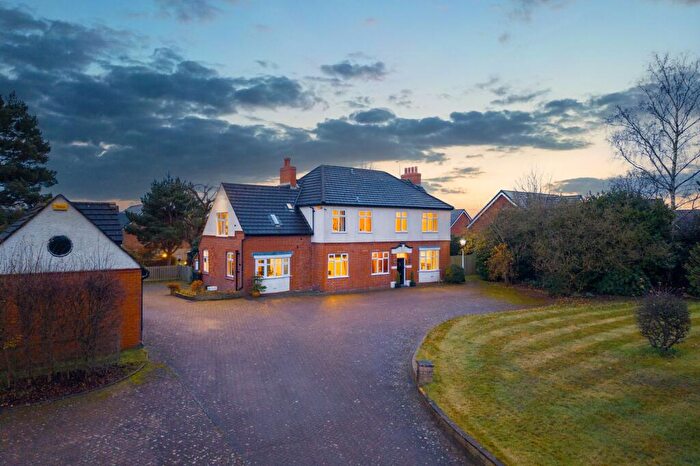
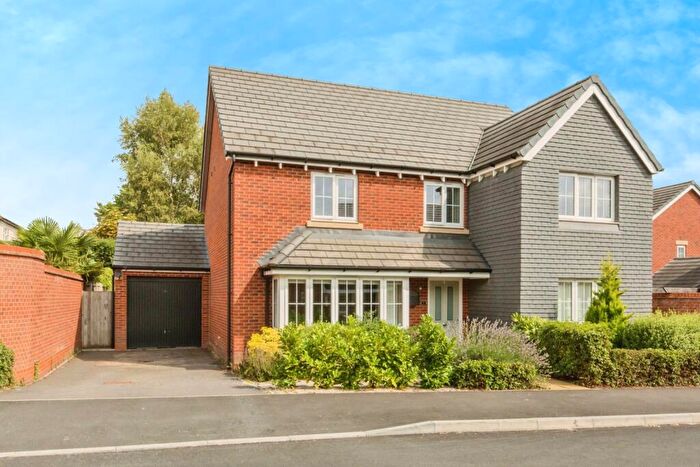
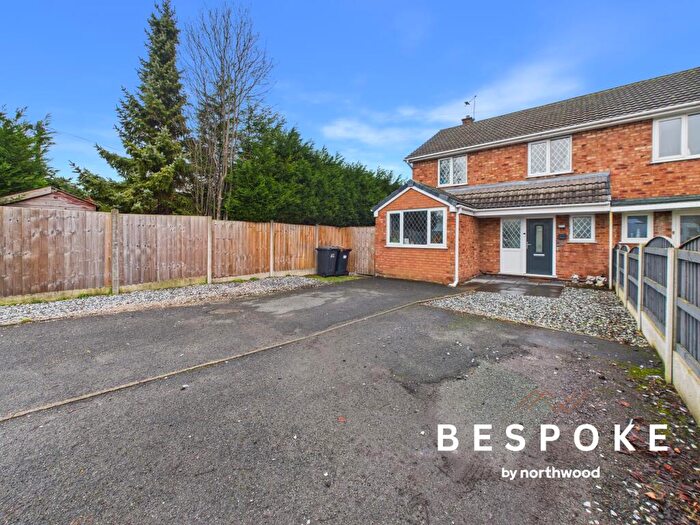
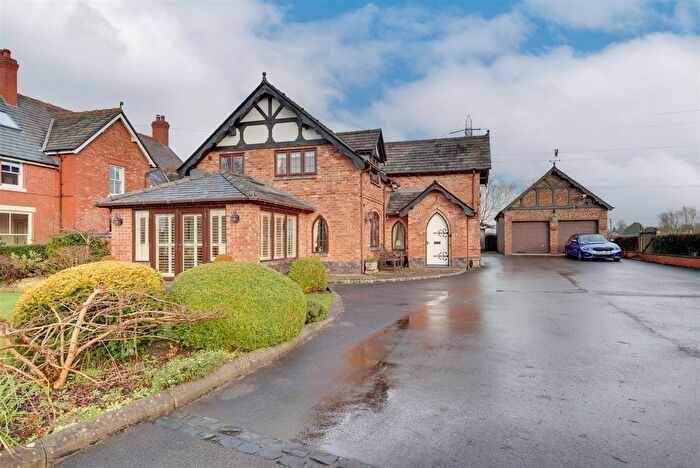
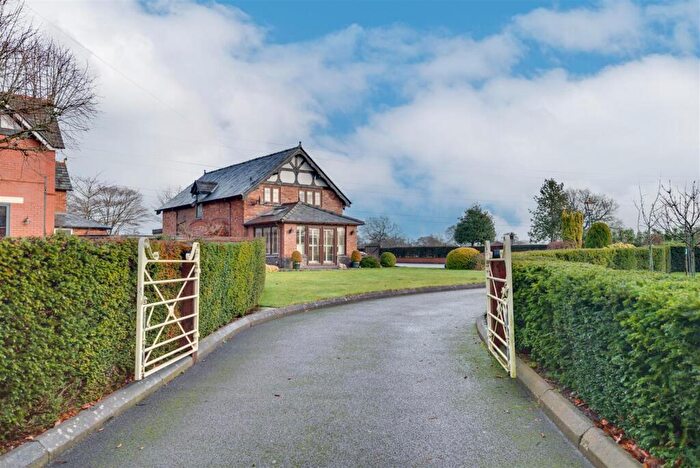
Properties in Haslington have an average house price of £339,710.00 and had 50 Property Transactions within the last 3 years¹.
Haslington is an area in Sandbach, Cheshire with 487 households², where the most expensive property was sold for £1,200,000.00.
Properties for sale in Haslington
Previously listed properties in Haslington
Roads and Postcodes in Haslington
Navigate through our locations to find the location of your next house in Haslington, Sandbach for sale or to rent.
| Streets | Postcodes |
|---|---|
| Alsager Road | CW11 4RG CW11 4RQ |
| Arthur Price Close | CW11 4TX |
| Bowkers Croft | CW11 4RR |
| Bridgehouse Lane | CW11 4DG |
| Charles Barnett Road | CW11 4TT |
| Coppice Road | CW11 4RN |
| Crewe Road | CW11 4RF CW11 4RP CW11 4RS |
| Cross Lane | CW11 4RW |
| Elton Lane | CW11 4TN CW11 4TJ |
| Fishermans Close | CW11 4SW |
| Frederick Howarth Drive | CW11 4TQ |
| Hassall Road | CW11 4RJ CW11 4RL CW11 4RT CW11 4RU |
| Hollyfields | CW11 4NH |
| John Simpson Crescent | CW11 4AZ |
| Joseph Wood Drive | CW11 4BT |
| Nesfield Court | CW11 4TU |
| Nesfield Drive | CW11 4NT |
| Newtons Crescent | CW11 4TS |
| Newtons Grove | CW11 4TR |
| Newtons Lane | CW11 4TL CW11 4TP |
| Nursery Fields Way | CW11 4AY |
| Pool Lane | CW11 4RY CW11 4RZ |
| Pool View | CW11 4QZ |
| Samuel Twemlow Avenue | CW11 4TY |
| Sandy Lane | CW11 4RH |
| Swain Drive | CW11 4AX |
| Sydney Newton Road | CW11 4BF |
| Woodcote Place | CW11 4RA |
Transport near Haslington
- FAQ
- Price Paid By Year
- Property Type Price
Frequently asked questions about Haslington
What is the average price for a property for sale in Haslington?
The average price for a property for sale in Haslington is £339,710. This amount is 16% higher than the average price in Sandbach. There are 239 property listings for sale in Haslington.
What streets have the most expensive properties for sale in Haslington?
The streets with the most expensive properties for sale in Haslington are Hassall Road at an average of £737,500, Elton Lane at an average of £534,333 and Pool View at an average of £498,333.
What streets have the most affordable properties for sale in Haslington?
The streets with the most affordable properties for sale in Haslington are Cross Lane at an average of £170,000, Newtons Grove at an average of £196,000 and Sandy Lane at an average of £221,000.
Which train stations are available in or near Haslington?
Some of the train stations available in or near Haslington are Sandbach, Crewe and Alsager.
Property Price Paid in Haslington by Year
The average sold property price by year was:
| Year | Average Sold Price | Price Change |
Sold Properties
|
|---|---|---|---|
| 2025 | £360,441 | 0,4% |
17 Properties |
| 2024 | £358,961 | 14% |
13 Properties |
| 2023 | £309,575 | -37% |
20 Properties |
| 2022 | £424,809 | 29% |
21 Properties |
| 2021 | £301,674 | 11% |
35 Properties |
| 2020 | £267,967 | 6% |
17 Properties |
| 2019 | £251,436 | -10% |
20 Properties |
| 2018 | £275,453 | 14% |
46 Properties |
| 2017 | £237,342 | -19% |
39 Properties |
| 2016 | £282,666 | 6% |
20 Properties |
| 2015 | £265,578 | 23% |
19 Properties |
| 2014 | £203,590 | -24% |
11 Properties |
| 2013 | £251,874 | 23% |
20 Properties |
| 2012 | £193,345 | -31% |
11 Properties |
| 2011 | £253,156 | 11% |
16 Properties |
| 2010 | £225,480 | -18% |
5 Properties |
| 2009 | £266,444 | 5% |
9 Properties |
| 2008 | £253,500 | 8% |
15 Properties |
| 2007 | £234,232 | 14% |
23 Properties |
| 2006 | £200,581 | -5% |
26 Properties |
| 2005 | £210,582 | 14% |
16 Properties |
| 2004 | £181,346 | 1% |
28 Properties |
| 2003 | £179,564 | 21% |
14 Properties |
| 2002 | £142,473 | 6% |
26 Properties |
| 2001 | £133,884 | 5% |
35 Properties |
| 2000 | £127,702 | 40% |
25 Properties |
| 1999 | £77,181 | -22% |
24 Properties |
| 1998 | £93,940 | 10% |
39 Properties |
| 1997 | £84,221 | -10% |
33 Properties |
| 1996 | £92,554 | 2% |
41 Properties |
| 1995 | £91,067 | - |
31 Properties |
Property Price per Property Type in Haslington
Here you can find historic sold price data in order to help with your property search.
The average Property Paid Price for specific property types in the last three years are:
| Property Type | Average Sold Price | Sold Properties |
|---|---|---|
| Semi Detached House | £235,766.00 | 15 Semi Detached Houses |
| Terraced House | £209,833.00 | 6 Terraced Houses |
| Detached House | £420,344.00 | 29 Detached Houses |

