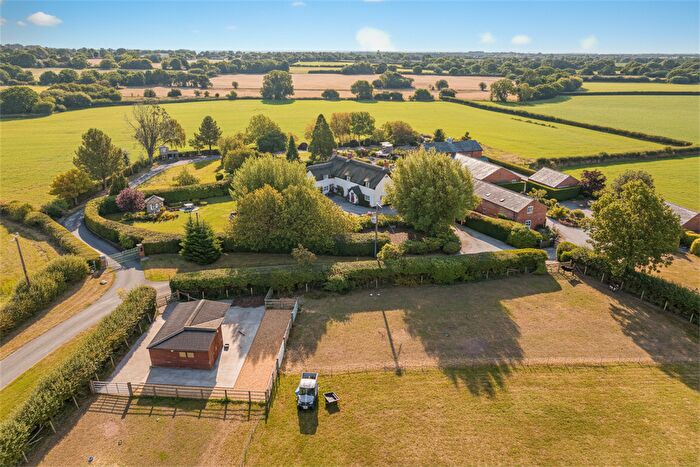
Houses for sale & to rent in Marbury, Warrington
House Prices in Marbury
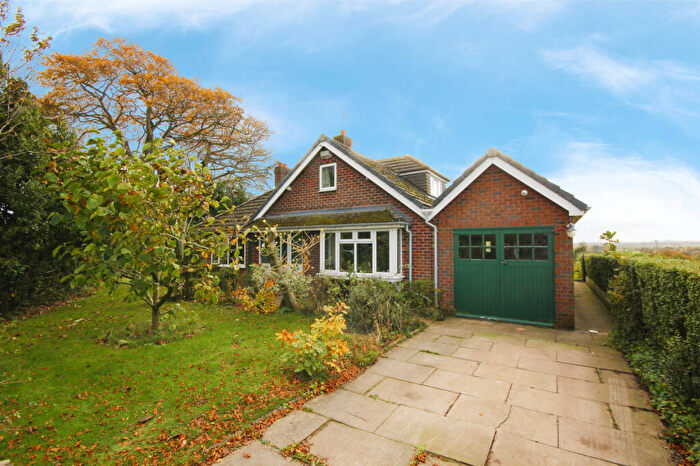
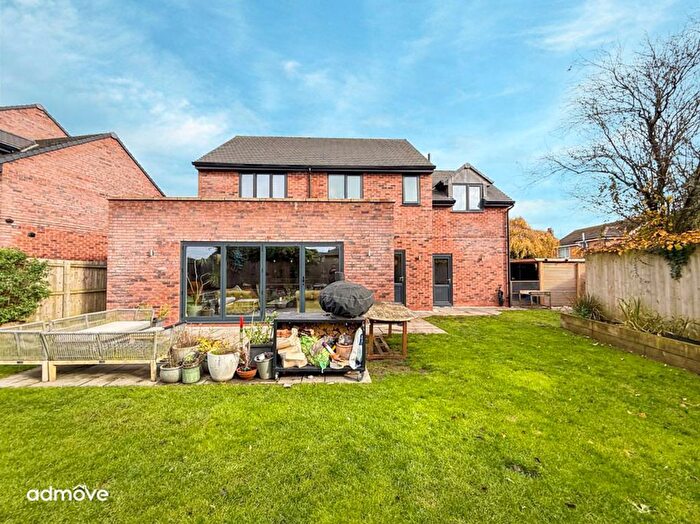
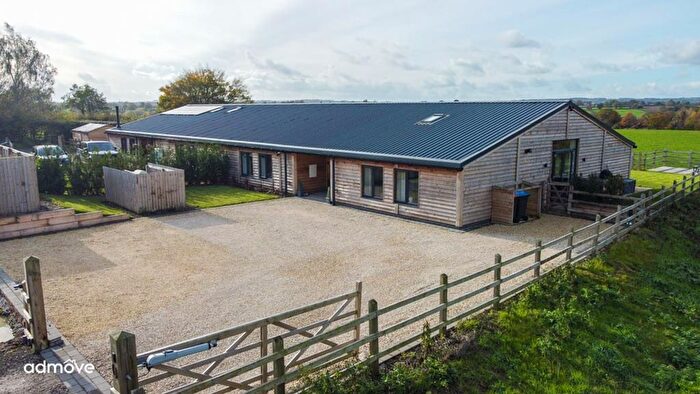
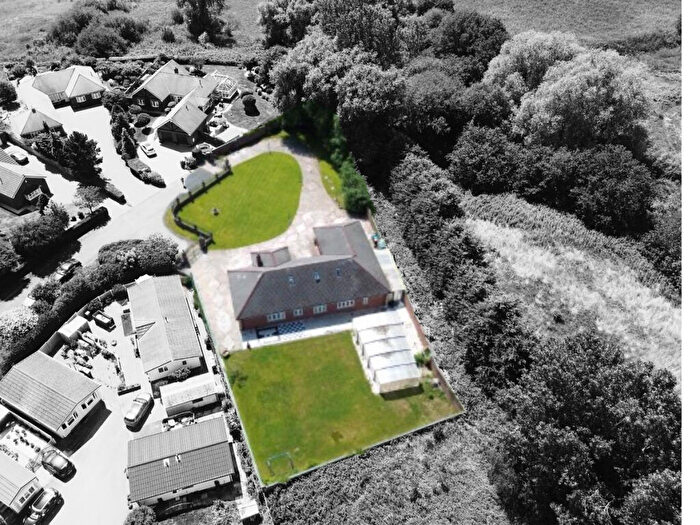
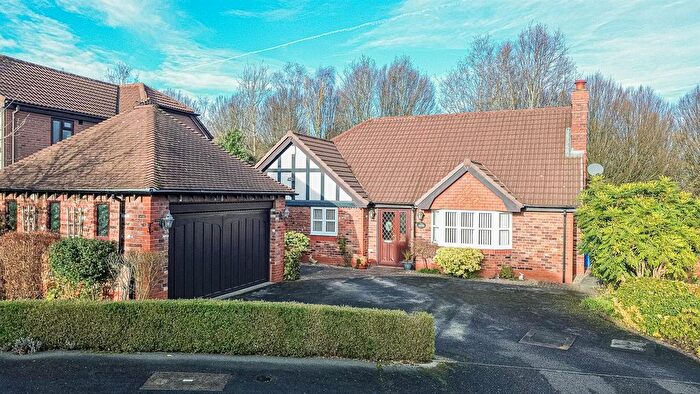
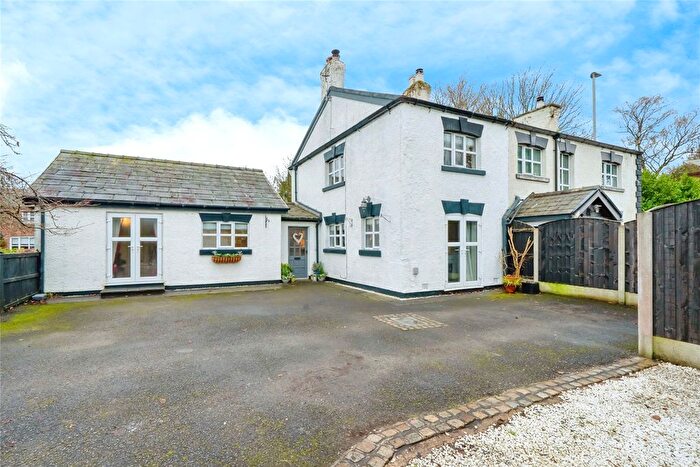
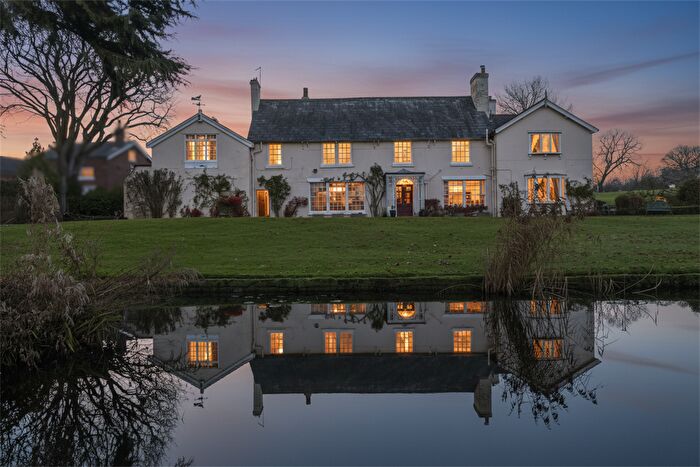
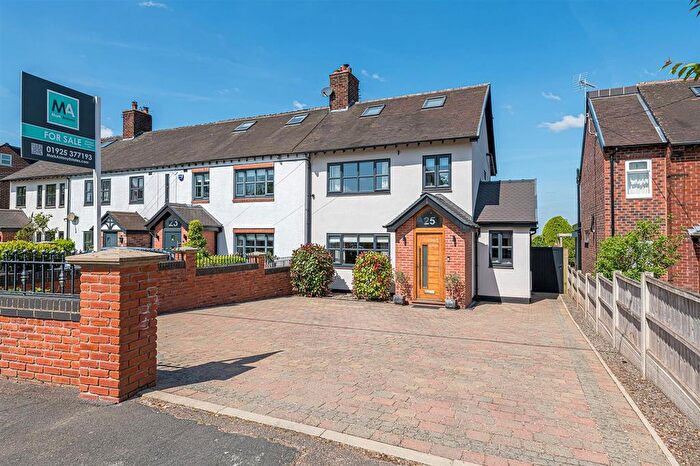
Properties in Marbury have an average house price of £711,075.00 and had 28 Property Transactions within the last 3 years¹.
Marbury is an area in Warrington, Cheshire with 232 households², where the most expensive property was sold for £1,500,000.00.
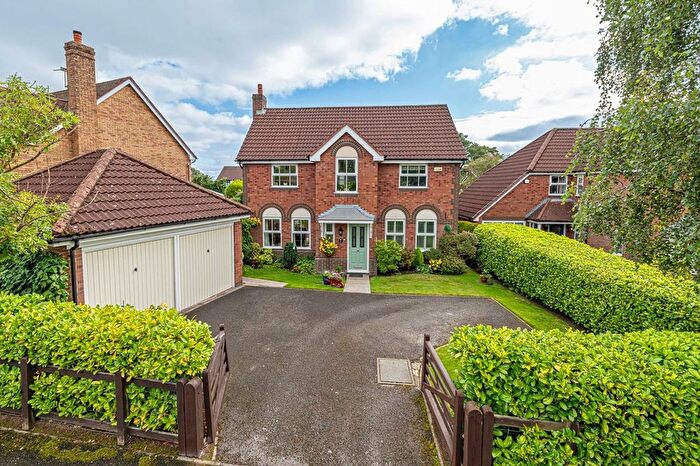
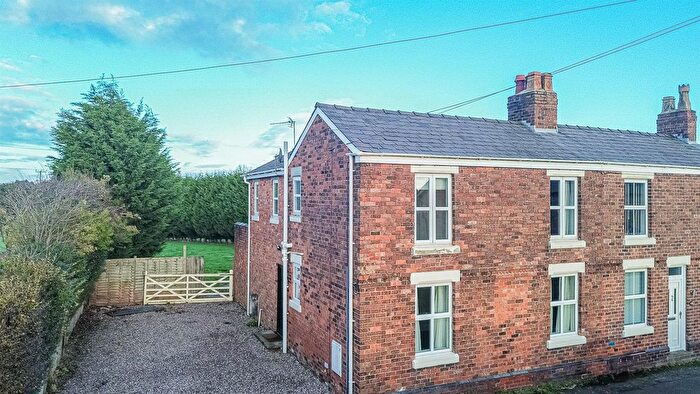
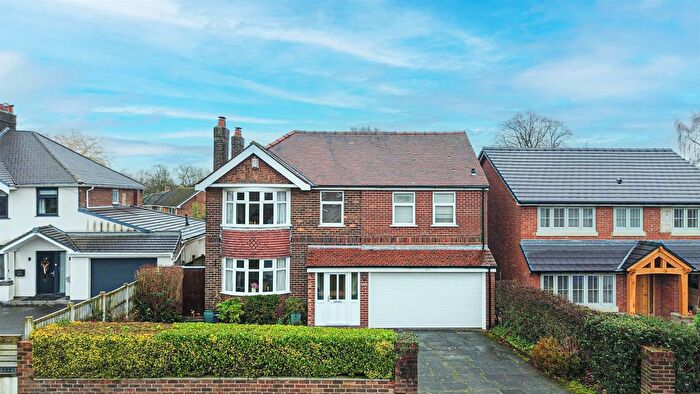
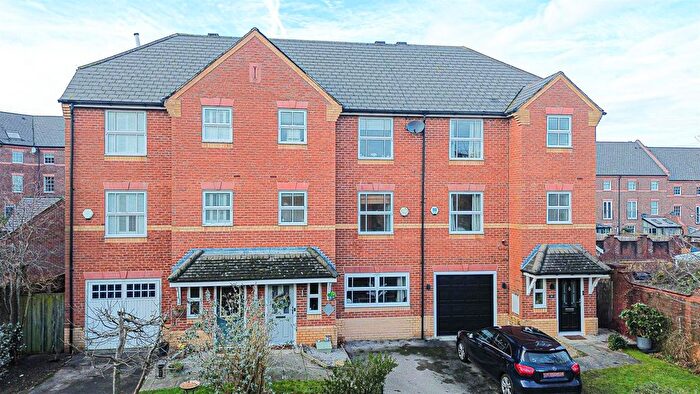
Properties for sale in Marbury
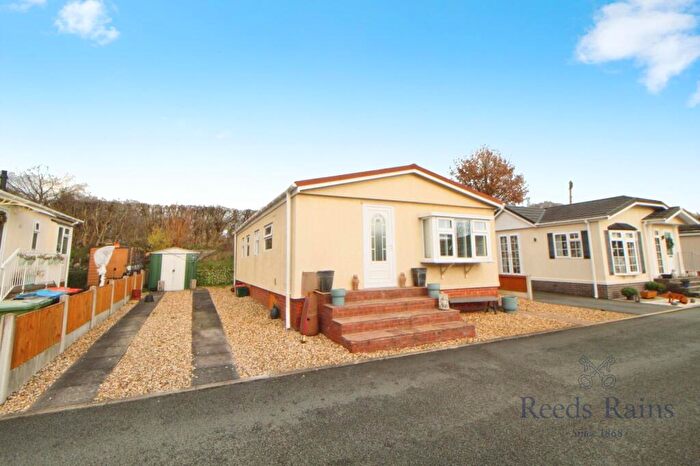
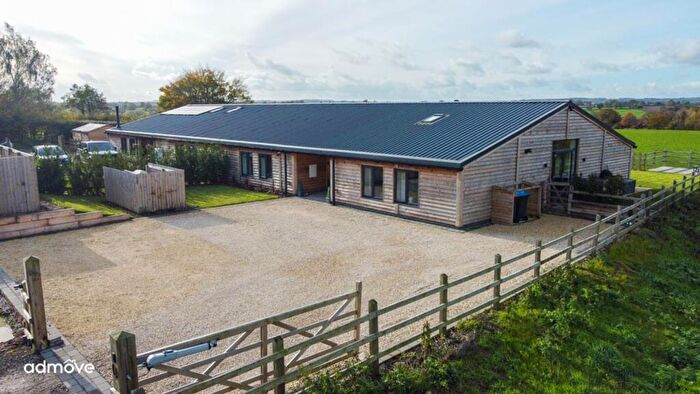
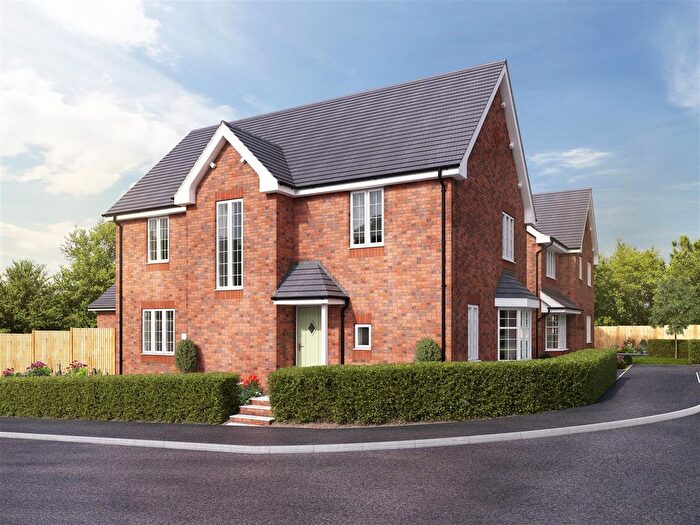
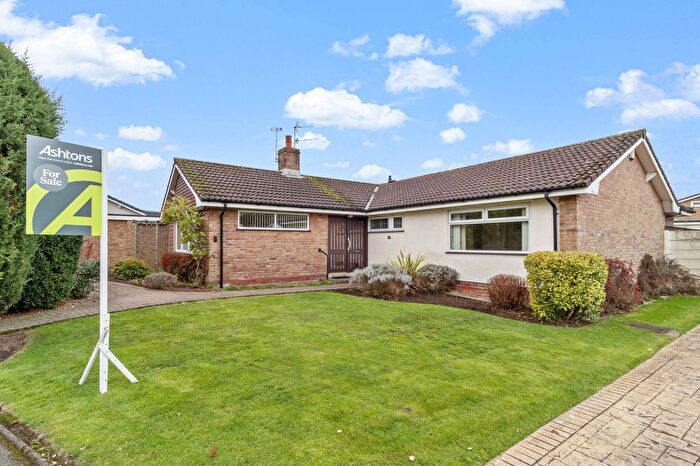
Previously listed properties in Marbury
Roads and Postcodes in Marbury
Navigate through our locations to find the location of your next house in Marbury, Warrington for sale or to rent.
| Streets | Postcodes |
|---|---|
| Back Lane | WA4 4QL WA4 4QP WA4 4PX WA4 4QJ |
| Bentleys Farm Lane | WA4 4PZ WA4 4QN WA4 4QW WA4 4QA |
| Birch Tree Lane | WA4 4PJ |
| Brook House Lane | WA4 4EP |
| Brookhouse Lane | WA4 4ER |
| Dark Lane | WA4 4QF WA4 4QG |
| Goosebrook Lane | WA4 4PT WA4 4PU |
| Greenhill Lane | WA4 4JD WA4 4JE |
| Grimsditch Lane | WA4 4EB WA4 4ED |
| Higher Lane | WA4 4JH WA4 4JP WA4 4JW |
| Lake Lane | WA4 4PW |
| Limes Lane | WA4 4DU |
| Lodge Lane | WA4 4HL WA4 4HN |
| Marsh Lane | WA4 4EU WA4 4JJ WA4 4JL |
| Normans Lane | WA4 4PY |
| Northwich Road | WA4 4PH WA4 4PN WA4 4HD WA4 4LB WA4 4LD WA4 4LJ WA4 4LQ |
| Old Mill Lane | WA4 4PP WA4 4PS |
| Pillmoss Lane | WA4 4DW |
| Raddel Lane | WA4 4EE |
| Red Lane | WA4 4ES |
| School Lane | WA4 4QB WA4 4QD WA4 4QE |
| Stockley Lane | WA4 4PL |
| Street Lane | WA4 4EH WA4 4EL WA4 4EN |
| Tarporley Road | WA4 4DS WA4 4DT WA4 4DX WA4 4DY WA4 4EF WA4 4EG WA4 4ET WA4 4EW WA4 4DZ WA4 4EA WA4 4EQ |
| The Town Green | WA4 4QQ |
| Village Lane | WA4 4EJ WA4 4QH |
| Well Lane | WA4 4PR |
Transport near Marbury
- FAQ
- Price Paid By Year
- Property Type Price
Frequently asked questions about Marbury
What is the average price for a property for sale in Marbury?
The average price for a property for sale in Marbury is £711,075. This amount is 4% higher than the average price in Warrington. There are 401 property listings for sale in Marbury.
What streets have the most expensive properties for sale in Marbury?
The streets with the most expensive properties for sale in Marbury are Village Lane at an average of £1,168,366, Higher Lane at an average of £925,000 and Lake Lane at an average of £835,000.
What streets have the most affordable properties for sale in Marbury?
The streets with the most affordable properties for sale in Marbury are Northwich Road at an average of £416,166, Lodge Lane at an average of £550,000 and Street Lane at an average of £640,800.
Which train stations are available in or near Marbury?
Some of the train stations available in or near Marbury are Acton Bridge, Runcorn East and Greenbank.
Property Price Paid in Marbury by Year
The average sold property price by year was:
| Year | Average Sold Price | Price Change |
Sold Properties
|
|---|---|---|---|
| 2025 | £897,622 | 31% |
9 Properties |
| 2024 | £623,090 | 0,1% |
11 Properties |
| 2023 | £622,187 | 11% |
8 Properties |
| 2022 | £554,285 | -6% |
7 Properties |
| 2021 | £587,214 | 25% |
7 Properties |
| 2020 | £442,250 | -2% |
4 Properties |
| 2019 | £451,937 | -22% |
8 Properties |
| 2018 | £551,278 | 26% |
8 Properties |
| 2017 | £406,332 | 29% |
12 Properties |
| 2016 | £286,999 | -58% |
4 Properties |
| 2015 | £452,990 | 23% |
5 Properties |
| 2014 | £350,563 | 23% |
11 Properties |
| 2013 | £270,136 | -20% |
11 Properties |
| 2012 | £325,198 | -8% |
5 Properties |
| 2011 | £350,000 | -15% |
4 Properties |
| 2010 | £402,400 | -27% |
5 Properties |
| 2009 | £511,835 | 18% |
4 Properties |
| 2008 | £418,600 | 15% |
5 Properties |
| 2007 | £356,999 | -16% |
5 Properties |
| 2006 | £414,450 | 22% |
10 Properties |
| 2005 | £321,666 | -29% |
6 Properties |
| 2004 | £413,810 | 36% |
10 Properties |
| 2003 | £266,104 | -3% |
12 Properties |
| 2002 | £274,666 | -22% |
9 Properties |
| 2001 | £335,966 | 47% |
15 Properties |
| 2000 | £177,825 | -17% |
6 Properties |
| 1999 | £207,411 | -15% |
17 Properties |
| 1998 | £238,750 | 41% |
4 Properties |
| 1997 | £140,085 | -5% |
7 Properties |
| 1996 | £147,250 | 34% |
8 Properties |
| 1995 | £97,500 | - |
2 Properties |
Property Price per Property Type in Marbury
Here you can find historic sold price data in order to help with your property search.
The average Property Paid Price for specific property types in the last three years are:
| Property Type | Average Sold Price | Sold Properties |
|---|---|---|
| Semi Detached House | £565,416.00 | 6 Semi Detached Houses |
| Detached House | £756,255.00 | 18 Detached Houses |
| Terraced House | £726,250.00 | 4 Terraced Houses |

