
Houses for sale & to rent in City and County of the City of London, England
House Prices in City and County of the City of London
Properties in City and County of the City of London have
an average house price of
£1,015,538.00
and had 647 Property Transactions
within the last 3 years.¹
City and County of the City of London is a location in
England with
4,357 households², where the most expensive property was sold for £5,350,000.00.
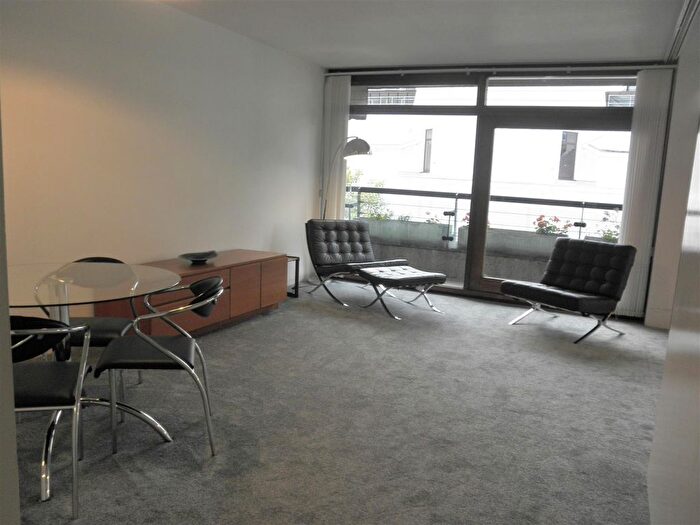
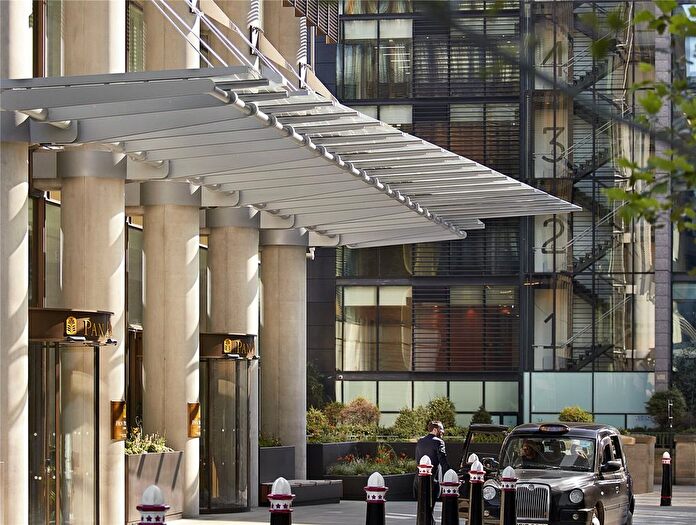
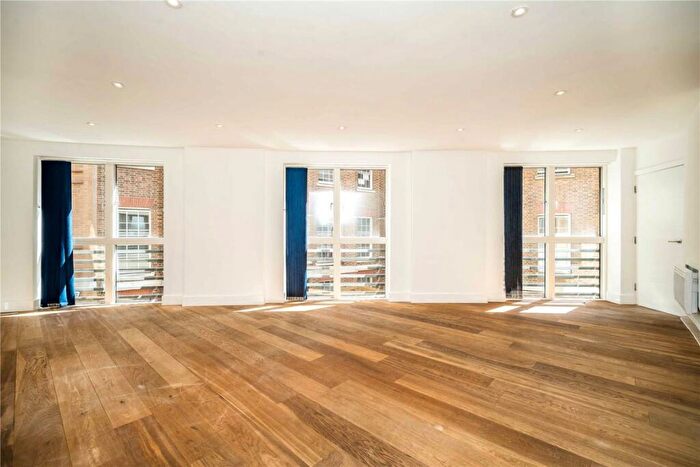
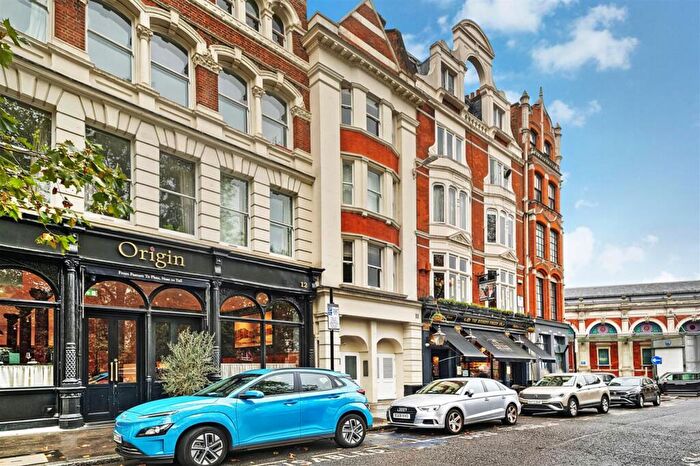
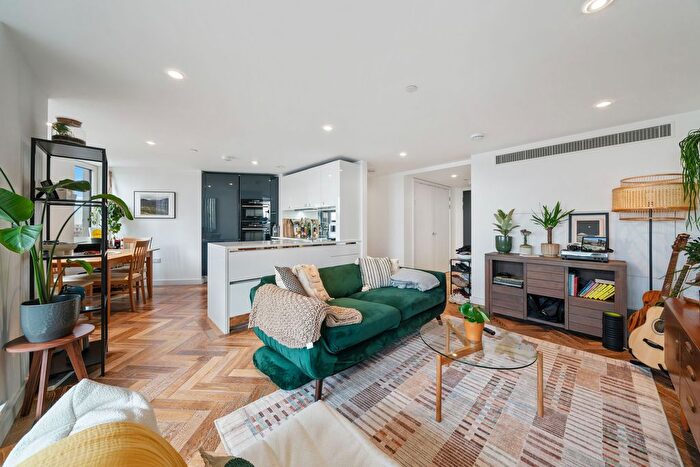
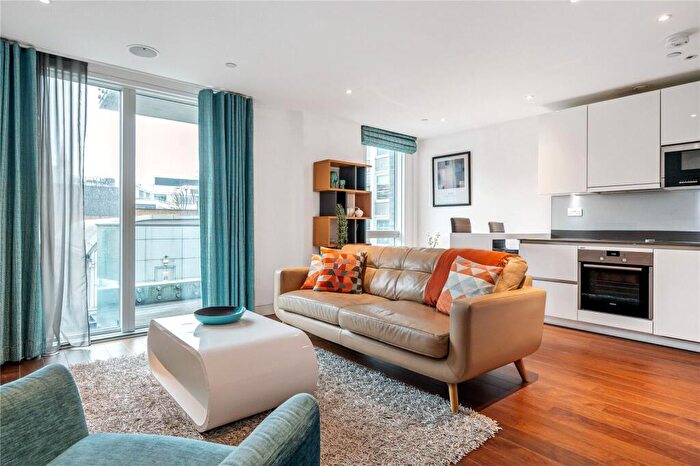
Properties for sale in City and County of the City of London
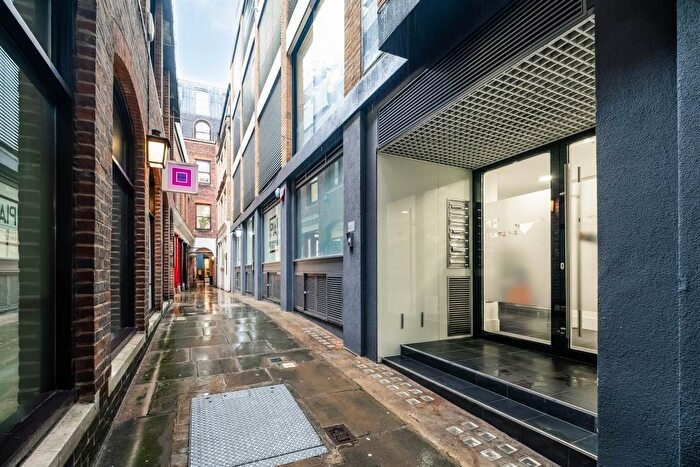

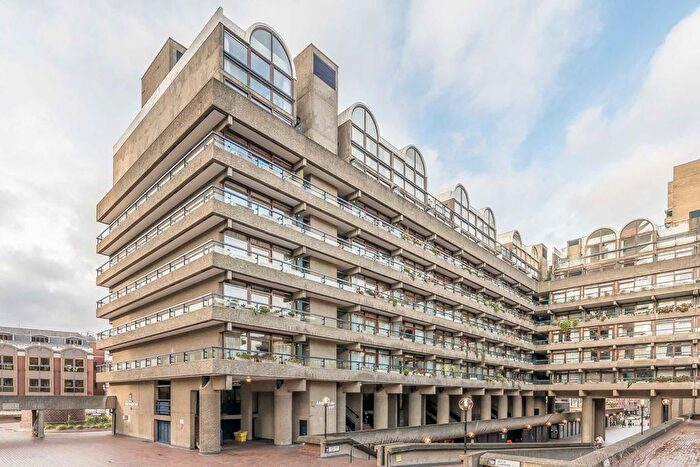
![]()
If you are looking to sell your house, let it out, or receive a property valuation, an expert can help you.
Click the button below to get started.


Towns in City and County of the City of London
Navigate through our locations to find the location of your next house in City and County of the City of London, England for sale or to rent.
Transport in City and County of the City of London
Please see below transportation links in this area:
-

 Bank Station
 -
Mansion House Station
-
 Cannon Street Station
 -
St. Pauls Station
-
Moorgate Station
-
Monument Station
-
Barbican Station
-

 Liverpool Street Station
 -
City Thameslink Station
-
Blackfriars Station
- FAQ
- Price Paid By Year
- Property Type Price
Frequently asked questions about City and County of the City of London
What is the average price for a property for sale in City and County of the City of London?
The average price for a property for sale in City and County of the City of London is £1,015,538. This amount is 181% higher than the average price in England. There are 4,992 property listings for sale in City and County of the City of London.
Which train stations are available in or near City and County of the City of London?
Some of the train stations available in or near City and County of the City of London are Cannon Street, Moorgate and Liverpool Street.
Which tube stations are available in or near City and County of the City of London?
Some of the tube stations available in or near City and County of the City of London are Bank, Mansion House and Cannon Street.
Property Price Paid in City and County of the City of London by Year
The average sold property price by year was:
| Year | Average Sold Price | Price Change |
Sold Properties
|
|---|---|---|---|
| 2025 | £859,585 | -11% |
102 Properties |
| 2024 | £955,157 | -10% |
169 Properties |
| 2023 | £1,049,186 | -6% |
177 Properties |
| 2022 | £1,116,825 | -9% |
199 Properties |
| 2021 | £1,217,506 | 3% |
225 Properties |
| 2020 | £1,177,110 | 2% |
158 Properties |
| 2019 | £1,159,448 | -9% |
161 Properties |
| 2018 | £1,268,479 | 22% |
399 Properties |
| 2017 | £984,696 | -1% |
235 Properties |
| 2016 | £995,202 | 3% |
153 Properties |
| 2015 | £969,824 | 5% |
330 Properties |
| 2014 | £920,582 | 14% |
343 Properties |
| 2013 | £789,665 | 32% |
443 Properties |
| 2012 | £537,159 | -1% |
197 Properties |
| 2011 | £540,214 | 7% |
257 Properties |
| 2010 | £502,241 | 10% |
202 Properties |
| 2009 | £451,222 | 8% |
158 Properties |
| 2008 | £414,721 | -19% |
142 Properties |
| 2007 | £492,198 | 24% |
271 Properties |
| 2006 | £375,577 | 12% |
297 Properties |
| 2005 | £329,840 | 11% |
305 Properties |
| 2004 | £292,420 | -10% |
377 Properties |
| 2003 | £322,700 | 16% |
473 Properties |
| 2002 | £270,879 | 2% |
393 Properties |
| 2001 | £266,276 | 4% |
373 Properties |
| 2000 | £256,037 | 9% |
439 Properties |
| 1999 | £232,868 | 3% |
544 Properties |
| 1998 | £224,803 | 30% |
432 Properties |
| 1997 | £156,848 | 13% |
327 Properties |
| 1996 | £136,344 | -7% |
284 Properties |
| 1995 | £146,430 | - |
164 Properties |
Property Price per Property Type in City and County of the City of London
Here you can find historic sold price data in order to help with your property search.
The average Property Paid Price for specific property types in the last three years are:
| Property Type | Average Sold Price | Sold Properties |
|---|---|---|
| Terraced House | £1,908,106.00 | 6 Terraced Houses |
| Flat | £1,007,184.00 | 641 Flats |